
A subscription to JoVE is required to view this content. Sign in or start your free trial.
Method Article
Phenotypic Profiling of Human Stem Cell-Derived Midbrain Dopaminergic Neurons
In This Article
Summary
This protocol describes the cell culturing of human midbrain dopaminergic neurons, followed by immunological staining and the generation of neuronal phenotypic profiles from acquired microscopic high-content images allowing the identification of phenotypic variations due to genetic or chemical modulations.
Abstract
Parkinson's disease (PD) is linked to a range of cell biological processes that cause midbrain dopaminergic (mDA) neuron loss. Many current in vitro PD cellular models lack complexity and do not take multiple phenotypes into account. Phenotypic profiling in human induced pluripotent stem cell (iPSC)-derived mDA neurons can address these shortcomings by simultaneously measuring a range of neuronal phenotypes in a PD-relevant cell type in parallel. Here, we describe a protocol to obtain and analyze phenotypic profiles from commercially available human mDA neurons. A neuron-specific fluorescent staining panel is used to visualize the nuclear, α-synuclein, Tyrosine hydroxylase (TH), and Microtubule-associated protein 2 (MAP2) related phenotypes. The described phenotypic profiling protocol is scalable as it uses 384-well plates, automatic liquid handling and high-throughput microscopy. The utility of the protocol is exemplified using healthy donor mDA neurons and mDA neurons carrying the PD-linked G2019S mutation in the Leucine-rich repeat kinase 2 (LRRK2) gene. Both cell lines were treated with the LRRK2 kinase inhibitor PFE-360 and phenotypic changes were measured. Additionally, we demonstrate how multidimensional phenotypic profiles can be analyzed using clustering or machine learning-driven supervised classification methods. The described protocol will particularly interest researchers working on neuronal disease modeling or studying chemical compound effects in human neurons.
Introduction
A variety of cell biological processes are disturbed in Parkinson's disease (PD). For example, mitochondrial dysfunction, oxidative stress, protein degradation defects, disruption of vesicular trafficking and endolysosomal function have been associated with midbrain dopaminergic (mDA) neuron loss, are commonly observed in PD1. Therefore, PD appears to involve multiple disease mechanisms that can interact with and worsen each other. One useful way to investigate this mechanistic interplay is the creation of a comprehensive phenotypic fingerprint or profile of midbrain dopaminergic (mDA) neurons.
Phenotypic profiling is an approach that involves creating a profile of a sample based on a collection of measurable characteristics, and second, it involves making predictions about a sample based on this profile2,3. The goal of profiling is to capture a diverse range of features, some of which may not have been previously associated with a disease or treatment3. As a result, profiling can reveal unexpected biological processes. Phenotypic profiling typically relies on fluorescently stained cells, and standardized assays, such as Cell Painting, have been developed to create phenotypic profiles4. Recently, phenotypic profiling has, for example, been applied for the characterization of small molecules or the accurate prediction of PD-subtypes solely based on patient-derived fibroblasts5,6. Despite these advances, phenotypic profiling has rarely been applied to post-mitotic differentiated cells, such as human induced pluripotent stem cell (iPSC)-derived mDA neurons that express PD-linked mutations such as LRRK2 G2019S. Significant challenges of iPSC-derived models include the presence of subtle or variable pathological features across differentiation batches or genotypes, and the fact that isolated PD phenotypes do not capture the full complexity of the disease. Furthermore, while iPSC neuronal models are physiologically relevant, they are rarely used in PD drug discovery processes due to concerns about technical complexity7,8.
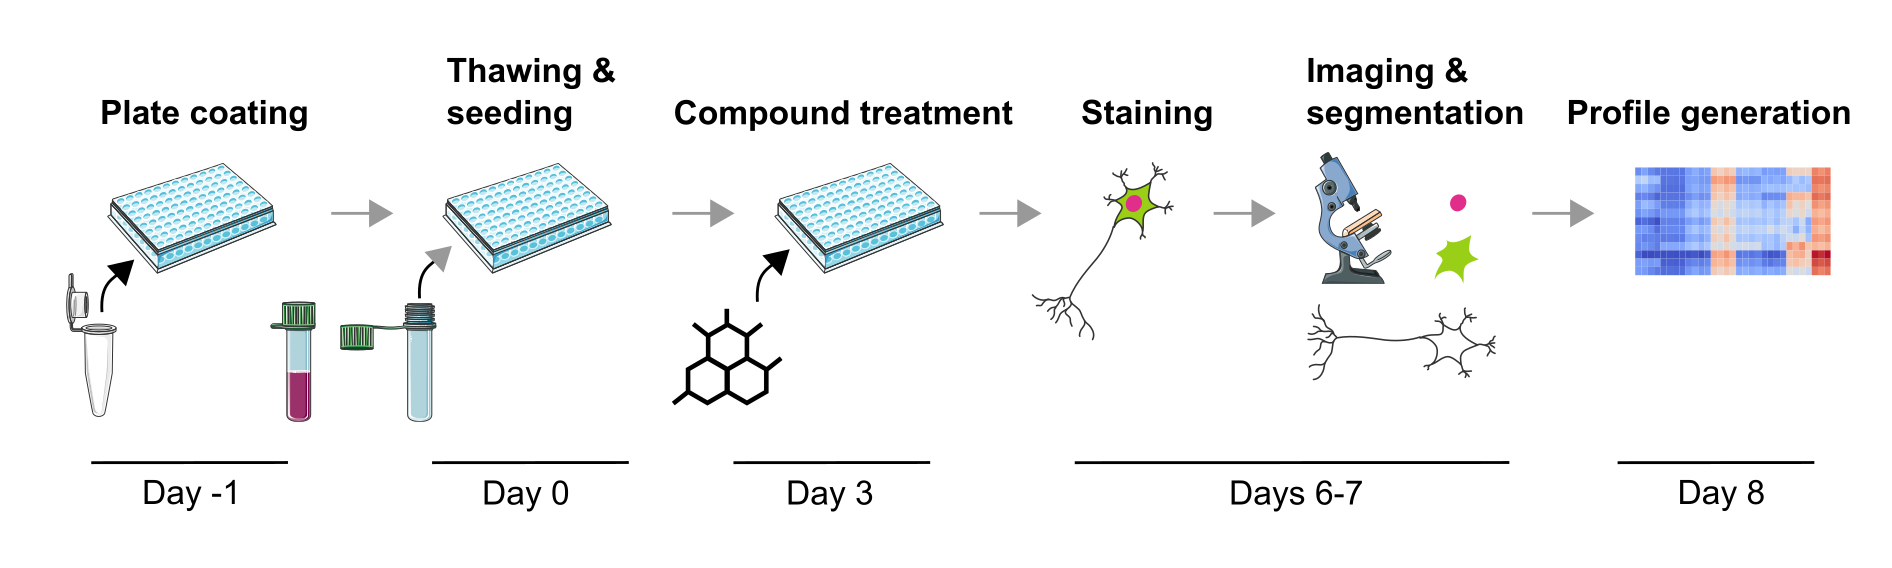
We previously developed a robust methodology to measure multiple PD-related pathophysiological phenotypes in human mDA neurons that are both sensitive to genetic and chemical compound-induced phenotypic changes9. This article describes in detail a further optimized version of this methodology to create phenotypic profiles from mDA neurons (Figure 1). This protocol has several advantages over the previously described phenotypic profiling approaches, such as the use of high-quality mDA neurons and technical reproducibility. For the first time, this protocol enables phenotypic profiling in physiologically relevant post-mitotic mDA neurons after chemical perturbations in a highly scalable fashion. Fully differentiated and cryopreserved mDA neurons are commercially available, significantly decreasing batch-to-batch differentiation variability. Secondly, technical variability can be further reduced by using a well-defined experimental design (i.e., culture duration or avoiding edge wells), automated liquid handling and automated microscopy. Additionally, the initial steps of phenotypic profile analysis using unsupervised clustering or supervised classification approaches are outlined here, indicating how phenotypic profiling data can be analyzed. This protocol will be of use for researchers interested in phenotypic changes of mDA neurons induced by genetic or chemical perturbations, specifically when a highly scalable study setup is required, for example, during screening campaigns or when the effects of a smaller number of compounds are to be studied, for example, to determine toxic effects. In summary, it is anticipated that the application of phenotypic profiling of human neurons is a valuable technique to study complex disease-related phenotypes and characterize the cellular effects of drug candidates.

Figure 1: Schematic depiction of the experimental protocol to generate image-based phenotypic profiles from human iPSC-derived mDA neurons. Please click here to view a larger version of this figure.
Protocol
1. Preparation of medium and plates for neuron seeding (Day 1)
- To prepare the plates for neuron seeding on Day-1, warm Laminin to room temperature (RT) just before use. Prepare the Laminin solution by diluting the Laminin stock solution (0.1 mg/mL) 1/10 in cold PBS+/+ (with Ca2+ and Mg2+).
NOTE: All reagents are listed in the Table of Materials. The compositions of solutions and buffers are described in Tables 1-4. - Then, add 25 µL of the Laminin solution to each well of a Poly-D-Lysine (PDL) precoated 384-well plate, and incubate overnight at 4 °C. The coated plates can be stored at 4 °C for up to one week.
NOTE: The protocol can be paused here for up to one week. Seal plates using plastic film. - Prepare Complete Maintenance Media and store at 4 °C for up to one month (Table 1).
2. Thawing of neurons (Day 0)
- To thaw the neurons on Day 0, prewarm a water bath to 37 °C, and equilibrate the Complete Maintenance Media to RT, protected from light.
- Take the vial containing the commercially obtained frozen neurons (see Table of Materials) out of the liquid nitrogen tank and place it on dry ice. Then place the vial in the water bath for 2 min. Once the liquid is completely thawed, disinfect the vial with 70% ethanol.
- Aspirate the thawed neurons with a P1000 pipette (around 370 µL) and transfer them in a 50 mL centrifuge tube without up-and-down pipetting. Next, rinse the vial with 630 µL of Complete Maintenance Medium, dispense drop by drop (45° angle) in the 50 mL tube. Agitate slowly while dispensing.
NOTE: It is critical to dispense the medium slowly, drop by drop, to avoid osmotic rupture of the cells. A 45° angle and light agitation minimizes high local osmotic pressure during pipetting. - Similarly, add 1 mL of Complete Maintenance Medium in the 50 mL centrifuge tube with a P1000 pipette. Then, slowly add 2 mL of Complete Maintenance Medium. Agitate carefully while dispensing.
- Count the cells. Prepare a microtube with 10 µL Trypan Blue and 10 µL cell suspension and add to a counting chamber slide (10 µL). Perform counting using an automated cell counter (see Table of Materials) or manually.
- After counting, centrifuge the 50 mL tube containing the neurons at 400 x g for 5 min at RT, and remove the supernatant. Carefully resuspend the pellet using a P1000 pipette and 1 mL of Complete Maintenance Medium. Then add the necessary volume to reach the desired concentration (300,000 cells/mL, see also next step).
3. Seeding of neurons on prepared plates (Day 0)
- To seed neurons on the prepared plates on Day 0, take the coated plates out of the refrigerator, place them under the cell culture hood and let them equilibrate to RT for about 30 min.
- Just before seeding, aspirate 15 µL coating solution with an automated liquid handler or a 16-channel pipette. Leave approximately 10 µL per well to prevent damage to the coating.
- Next, dispense 50 µL of the cell solution containing 300,000 cells/mL (prepared in step 2.6) per well with a 16-channel pipette, resulting in 15,000 seeded neurons per well and a final volume per well of 60 µL.
- In a 384-well plate, avoid using columns 1, 2, 23, 24, and rows A, B, O, and P to minimize possible edge effects which can impact the phenotypic profiles. Fill the unused empty wells with 80 µL of PBS. Incubate the plates at 37 °C and 5% CO2.
4. Medium change or compound treatment (Day 3)
- Depending on the number wells, pre-warm an appropriate volume of Complete Maintenance Medium at RT. Protect from light.
- If a medium change is required, proceed to step 4.4. If compound treatment is desired, verify the compound stock concentration and the used solvent (water, DMSO, methanol, etc.).
- Prepare a 1.5x concentrated compound solution for all desired concentrations to be tested. Prepare the compound dilutions using Complete Maintenance Medium.
NOTE: As a neutral control, use the respective solvent at the same concentration as the tested compound. If multiple or unknown compounds at different concentrations are used, it is advisable to perform a separate dose-response experiment to measure solvent effects on the phenotypic profile. - If an automatic pipetting system is used, add 60 µL of the 1.5x compound solution to a 384-well storage plate. Alternatively, use a 16-channel pipette. If a medium change is required, add 60 µL of Complete Maintenance Medium instead.
- Using the automatic pipetting system, aspirate and discard 40 µL of medium per well from the neuron-containing plate to keep 20 µL/well. Then add 40 µL/well of 1.5x compound solution from the 384-well storage plate to each well to obtain the desired final concentration.
NOTE: It is critical not to perform full medium changes but to always leave residual medium in the well to prevent damage to the neuronal carpet or the coating. - In case neuronal culture is performed for more than the 6 days described in this protocol, change the medium every 2-3 days.
5. Neuron fixation and staining (Days 6 to 7)
- To fix and stain the neurons on Days 6 and 7, make use of an automated liquid handler for all dispensing and washing steps. Alternatively, use a 16-channel pipette.
- Prepare a 10% Triton X-100 solution by diluting Triton X-100 in 1x PBS. Vortex until the solution is homogeneous. Store at 4 °C.
- To fix the neurons, dispense 20 µL/well of 16% PFA resulting in a 4% final concentration. Incubate the plate for 30 min at RT, and wash it three times with 1x PBS. Leave 20 µL/well of PBS after the last wash.
CAUTION: PFA is recognized as a hazardous substance known to cause oral, dermal, and respiratory toxicity. It also poses a threat to the eyes and may lead to genetic mutations and cancer. Proper handling of PFA requires the use of suitable personal protective equipment, such as eye and face protection, in addition to ensuring proper ventilation. It is important to prevent the release of PFA into the environment. - For permeabilization and blocking, prepare a 2x blocking solution (Table 2).
- Add 20 µL/well of 2x blocking solution (1x final concentration), incubate for 1 h at RT, and wash once with PBS. Keep 20 µL/well of PBS after washing.
- For primary antibody (see Table of Materials) staining, prepare a 2x primary staining buffer (Table 3).
- Add 20 µL/well of 2x primary staining buffer (1x final concentration) and incubate overnight at 4 °C. The next morning on Day 7, wash three times with PBS. Leave 20 µL/well of PBS after washing.
- For secondary antibody (see Table of Materials) staining, prepare a 2x secondary staining buffer (Table 4).
- Add 20 µL/well of 2x secondary staining buffer (1x final concentration), incubate for 2 h at RT away from light, and wash three times with PBS. Leave 100 µL PBS/well after the last wash.
- Add aluminum sealing on the plate to minimize evaporation. Alternatively, cover the plate using plastic film and aluminum foil. Proceed to image acquisition, or store the plate at 4 °C.
NOTE: The protocol can be paused here for up to one week. If background fluorescence is observed, consider increasing the blocking time. If the staining is insufficient, try increasing the primary antibody concentration or incubation time.
- Add aluminum sealing on the plate to minimize evaporation. Alternatively, cover the plate using plastic film and aluminum foil. Proceed to image acquisition, or store the plate at 4 °C.
6. Imaging of fluorescently stained neurons (Day 7)
- Acquire images of the plated, cultured, and stained neurons on Day 7. Ideally, use an automated confocal fluorescence microscope (see Table of Materials). Alternatively, acquire images manually.
- Acquire the Hoechst, TH, α-synuclein, and MAP2 channels using 405 nm, 488 nm, 561 nm, and 647 nm lasers, respectively (Figure 2).
NOTE: To generate sufficient amount of detailed data for phenotypic profiling, use a 40x objective and acquire 16 fields/well using Z-stacks consisting of 3 Z-slices separated by 2 µm. In case there are pipetting-related damages in the neuronal carpet, try to avoid imaging these areas. - Depending on the microscope and camera, adjust the exposure times and excitation intensities for each of the four fluorescent channels separately to obtain an optimal dynamic range of the fluorescent intensities.
NOTE: Imaging software often provides a histogram to determine the ideal exposure time. If the histogram is shifted too much to the left in the low signal range, then the exposure time is too short or the excitation intensity is too low. If there is a sharp cliff at the maximum signal level on the right, then the signal value is saturated. In this case, reduce the excitation intensity or shorten the exposure time. - Store images in a loss-free and open format such as .tif.
7. Image processing (Day 8)
- Image segmentation and phenotypic feature extraction are required for the creation of quantitative phenotypic profiles. Use the PhenoLink software for image segmentation and feature extraction (Table of Materials). Instructions for installing PhenoLink can be found in the GitHub repository (https://github.com/Ksilink/PhenoLink).
NOTE: Image segmentation is used to identify and separate different objects or regions in an image, while phenotypic feature extraction is used to analyze and extract relevant information from those regions. Several alternative software solutions, such as CellProfiler10, ImageJ/FIJI11, Napari12, or the Knime Analytics Platform13 are available to extract quantitative information from multichannel fluorescence images. - Perform image segmentation on illumination-corrected raw images. Determine the respective fluorescent channel intensity thresholds empirically per plate so that the background signal is minimal, and the desired segmented signal corresponds to the signal in the raw image. Plates processed and stained on the same day typically require comparable channel intensity thresholds for segmentation.
- Define the nucleus size and intensity to separate living from dead cells. When using 40x images, keep all other default parameters and run the software. One hundred twenty-six quantitative image features will be calculated per well (Supplementary Table 1).
- Use the resulting tabular quantitative data to construct phenotypic profiles and compare phenotypic profiles from different cell lines or treatment conditions. Each row corresponds to a biological condition (well) and each column corresponds to a determined phenotypic feature.
NOTE: We provide an example output file together with the data analysis pipeline to illustrate its use (see Table of Materials). Additionally, Figure 3 shows the composition of a phenotypic profile.
8. Phenotypic profile generation and visualization (Day 8)
- If you do not have Python and Jupyter installed on your computer, install the Anaconda Distribution and open the Jupyter software. Download the provided Jupyter notebook and all other provided files and save them in the same directory (see Table of Materials). Open the Jupyter notebook file using the Jupyter software.
NOTE: Anaconda is a free and open-source platform for programming languages such as Python. This platform comes with the Python interpreter Jupyter which can execute the provided Jupyter notebook to create and analyze phenotypic profiles (https://github.com/Ksilink/Notebooks/tree/main/Neuro/DopaNeuronProfiling). - Execute the Jupyter notebook cell by cell using the Jupyter software. The provided sample data .fth and requirements .txt files need to be located in the same directory as the Jupyter notebook. Each Jupyter notebook cell is annotated to explain its functionality.
NOTE: It is crucial to use the Jupyter notebook in the correct order starting with data loading and scaling and to proceed cell by cell to the end. All data and graphics output will be stored in a newly created folder in the Jupyter notebook source directory. Figure 4 depicts the workflow and the workflow output.
Results
Phenotypic profiling in mDA neurons is an efficient way to quantify multiple aspects of cellular biology and their changes during the experimental modulation. To exemplify this methodology, this study made use of cryopreserved LRRK2 G2019S and healthy donor mDA neurons. These neurons have been differentiated for approximately 37 days, are post-mitotic and express neuronal markers (TUBB3 and MAP2) and dopaminergic neuron markers, including tyrosine hydroxylase (TH) in combination with FOXA2, while the glial marker Glial F...
Discussion
Phenotypic profiling is a technique to measure a large number of phenotypes in cells by applying fluorescent stainings, microscopy, and image analysis3. Phenotypic profiles can be obtained and compared across cell lines or other experimental conditions to understand complex changes in cellular biology that might go unnoticed when using a single readout. Here we describe the application of phenotypic profiling to human iPSC-derived mDA neurons, a cell type frequently used to model PD cellular biolo...
Disclosures
All authors are employed by Ksilink.
Acknowledgements
The authors would like to thank all colleagues at Ksilink for their valuable help and discussions that lead to the design of the presented protocol.
Materials
| Name | Company | Catalog Number | Comments |
| Anti- chicken – Alexa 647 | Jackson ImmunoRearch | 703-605-155 | Immunofluorescence |
| Anaconda | https://www.anaconda.com/download | ||
| Anti-Map2 | Novus | NB300-213 | Immunofluorescence |
| Anti-mouse - Alexa 488 | Thermo Fisher | A11001 | Immunofluorescence |
| Anti-rabbit - Alexa 555 | Thermo Fisher | A21429 | Immunofluorescence |
| Anti-Tyrosine Hydroxylase | Merck | T2928 | Immunofluorescence |
| Anti-α-synuclein | Abcam | 138501 | Immunofluorescence |
| Bravo Automated Liquid Handling Platform with 384ST head | Agilent | If no liquid handler is available, the use of an electronic multichannel pipette is recommended. | |
| Confocal microscope | Yokogawa | CV7000 | The use of an automated confocal fluorescence microscope is recommended to ensure image quality consistency. |
| Countess Automated cell counter | Invitrogen | Cell counting before seeding. Can also be done using a manual counting chamber. | |
| DPBS +/+ | Gibco | 14040-133 | Buffer for washing |
| EL406 Washer Dispenser | BioTek (Agilent) | If no liquid handler is available, the use of an electronic multichannel pipette is recommended. | |
| Formaldehyde Solution (PFA 16 %) | Euromedex | EM-15710-S | Fixation before staining |
| Hoechst 33342 | Invitrogen | H3570 | Nuclear staining |
| iCell Base Medium 1 | Fujifilm | M1010 | Base medium for neurons |
| iCell DPN, Donor#01279, Phenotype AHN, lot#106339, 1M | Fujifilm | C1087 | Apparently healthy donor |
| iCell DPN, Donor#11299, Phenotype LRRK2 G2019S, phenotype PD lot#106139 | Fujifilm | C1149 | Donor carrying LRRK2 G2019S mutation |
| iCell Nervous System Supplement | Fujifilm | M1031 | Supplement for base medium |
| iCell Neural Supplement B | Fujifilm | M1029 | Supplement for base medium |
| Jupyter Python Notebook | In-house development | https://github.com/Ksilink/Notebooks/tree/main/Neuro/DopaNeuronProfiling | Notebook to perform phenotypic profile visualization and classification from raw data. |
| Laminin | Biolamina | LN521 | Plate coating |
| PFE-360 | MedChemExpress | HY-120085 | LRRK2 kinase inhibitor |
| PhenoLink | In-house development | https://github.com/Ksilink/PhenoLink | Software for image analysis |
| PhenoPlate 384w, PDL coated | Perkin Elmer | 6057500 | Pre-coated plate for cell culture and imaging. This plate allows imaging of all wells using all objectives of the Yokogawa CV7000 microscope. |
| Storage plates Abgene 120 µL | Thermo Scientific | AB-0781 | Necessary for compound dispensing using the Vprep pipetting system. If not available, the use of an electronic multichannel pipette is recommended. |
| Triton | Sigma | T9284 | Permeabilization before lysis |
| Trypan Blue | Sigma | T8154-20ML | Determination of living cells |
| Vprep Pipetting System | Agilent | Medium change and compound dispensing. Alternatively, an electronic multichannel pipette can be used. |
References
- Panicker, N., Ge, P., Dawson, V. L., Dawson, T. M. The cell biology of Parkinson's disease. The Journal of Cell Biology. 220 (4), 202012095 (2021).
- Caicedo, J. C., et al. Data-analysis strategies for image-based cell profiling. Nature Methods. 14 (9), 849-863 (2017).
- Chandrasekaran, S. N., Ceulemans, H., Boyd, J. D., Carpenter, A. E. Image-based profiling for drug discovery: due for a machine-learning upgrade. Nature Reviews Drug Discovery. 20 (2), 145-159 (2021).
- Bray, M. -. A., et al. Cell Painting, a high-content image-based assay for morphological profiling using multiplexed fluorescent dyes. Nature Protocols. 11 (9), 1757-1774 (2016).
- Schiff, L., et al. Integrating deep learning and unbiased automated high-content screening to identify complex disease signatures in human fibroblasts. Nature Communications. 13 (1), 1590 (2022).
- Ziegler, S., Sievers, S., Waldmann, H. Morphological profiling of small molecules. Cell Chemical Biology. 28 (3), 300-319 (2021).
- Cobb, M. M., Ravisankar, A., Skibinski, G., Finkbeiner, S. iPS cells in the study of PD molecular pathogenesis. Cell and Tissue Research. 373 (1), 61-77 (2018).
- Elitt, M. S., Barbar, L., Tesar, P. J. Drug screening for human genetic diseases using iPSC models. Human Molecular Genetics. 27 (R2), 89-98 (2018).
- Vuidel, A., et al. High-content phenotyping of Parkinson's disease patient stem cell-derived midbrain dopaminergic neurons using machine learning classification. Stem Cell Reports. 17 (10), 2349-2364 (2022).
- Stirling, D. R., Swain-Bowden, M. J., Lucas, A. M., Carpenter, A. E., Cimini, B. A., Goodman, A. CellProfiler 4: improvements in speed, utility and usability. BMC Bioinformatics. 22 (1), 433 (2021).
- Schindelin, J., et al. Fiji: an open-source platform for biological-image analysis. Nature Methods. 9 (7), 676-682 (2012).
- Sofroniew, N., et al. . napari: a multi-dimensional image viewer for Python. , (2022).
- Berthold, M. R., et al. KNIME: The Konstanz Information Miner. Data Analysis, Machine Learning and Applications. , 319-326 (2008).
- Fathi, A., et al. Diverging Parkinson's Disease Pathology between patient-derived GBAN370S, LRRK2G2019S and engineered SNCAA53T iPSC-derived Dopaminergic Neurons. bioRxiv. , (2023).
- Wang, Y., Huang, H., Rudin, C., Shaposhnik, Y. Understanding How Dimension Reduction Tools Work: An Empirical Approach to Deciphering t-SNE, UMAP, TriMap, and PaCMAP for Data Visualization. Journal of Machine Learning Research. 22 (201), 1-73 (2021).
- Ke, G., et al. LightGBM: A highly efficient gradient boosting decision tree. Advances in Neural Information Processing Systems. 30, (2017).
- Avazzadeh, S., Baena, J. M., Keighron, C., Feller-Sanchez, Y., Quinlan, L. R. Modelling Parkinson's Disease: iPSCs towards Better Understanding of Human Pathology. Brain Sciences. 11 (3), 373 (2021).
- Sánchez-Danés, A., et al. Disease-specific phenotypes in dopamine neurons from human iPS-based models of genetic and sporadic Parkinson's disease. EMBO Molecular Medicine. 4 (5), 380-395 (2012).
- Oosterveen, T., et al. Pluripotent stem cell derived dopaminergic subpopulations model the selective neuron degeneration in Parkinson's disease. Stem Cell Reports. 16 (11), 2718-2735 (2021).
- Hughes, R. E., et al. Multiparametric high-content cell painting identifies copper ionophores as selective modulators of esophageal cancer phenotypes. ACS Chemical Biology. 17 (7), 1876-1889 (2022).
- Akbarzadeh, M., et al. Morphological profiling by means of the Cell Painting assay enables identification of tubulin-targeting compounds. Cell Chemical Biology. 29 (6), 1053-1064 (2022).
- Schiff, L., et al. Integrating deep learning and unbiased automated high-content screening to identify complex disease signatures in human fibroblasts. Nature Communications. 13 (1), 1590 (2022).
- Way, G. P., et al. Morphology and gene expression profiling provide complementary information for mapping cell state. Cell Systems. 13 (11), 911-923 (2022).
- Feng, Y., Mitchison, T. J., Bender, A., Young, D. W., Tallarico, J. A. Multi-parameter phenotypic profiling: using cellular effects to characterize small-molecule compounds. Nature Reviews Drug Discovery. 8 (7), 567-578 (2009).
- Antonov, S. A., Novosadova, E. V. Current state-of-the-art and unresolved problems in using human induced pluripotent stem cell-derived dopamine neurons for parkinson's disease drug development. International Journal of Molecular Sciences. 22 (7), 3381 (2021).
- Miller, J. D., et al. Human iPSC-based modeling of late-onset disease via progerin-induced aging. Cell Stem Cell. 13 (6), 691-705 (2013).
- Bezard, E., Gross, C. E., Brotchie, J. M. Presymptomatic compensation in Parkinson's disease is not dopamine-mediated. Trends in Neurosciences. 26 (4), 215-221 (2003).
- Wu, Y., Le, W., Jankovic, J. Preclinical Biomarkers of parkinson disease. Archives of Neurology. 68 (1), 22-30 (2011).
- Verstraelen, P., et al. Systematic quantification of synapses in primary neuronal culture. iScience. 23 (9), 101542 (2020).
- Liu-Yesucevitz, L., et al. ALS-Linked mutations enlarge TDP-43-enriched neuronal RNA granules in the dendritic arbor. The Journal of Neuroscience. 34 (12), 4167-4174 (2014).
Reprints and Permissions
Request permission to reuse the text or figures of this JoVE article
Request PermissionExplore More Articles
This article has been published
Video Coming Soon
Copyright © 2025 MyJoVE Corporation. All rights reserved