
Method Article
Préparation de Cores de tissus enrobés de paraffine fixés au formol pour les ARN et d'extraction d'ADN
Dans cet article
Résumé
This modified extraction protocol improves RNA and DNA yields from more precisely targeted regions of interest in histopathologic tissue blocks.
Résumé
Formalin-fixed paraffin embedded tissue (FFPET) represents a valuable, well-annotated substrate for molecular investigations. The utility of FFPET in molecular analysis is complicated both by heterogeneous tissue composition and low yields when extracting nucleic acids. A literature search revealed a paucity of protocols addressing these issues, and none that showed a validated method for simultaneous extraction of RNA and DNA from regions of interest in FFPET. This method addresses both issues. Tissue specificity was achieved by mapping cancer areas of interest on microscope slides and transferring annotations onto FFPET blocks. Tissue cores were harvested from areas of interest using 0.6 mm microarray punches. Nucleic acid extraction was performed using a commercial FFPET extraction system, with modifications to homogenization, deparaffinization, and Proteinase K digestion steps to improve tissue digestion and increase nucleic acid yields. The modified protocol yields sufficient quantity and quality of nucleic acids for use in a number of downstream analyses, including a multi-analyte gene expression platform, as well as reverse transcriptase coupled real time PCR analysis of mRNA expression, and methylation-specific PCR (MSP) analysis of DNA methylation.
Introduction
La recherche de biomarqueurs génomiques cherche à identifier les corrélats moléculaires qui reflètent avec précision et de manière fiable l' état de la maladie, et le font d'une manière cliniquement utile. 1 Le développement Biomarker est tributaire de l' analyse rétrospective des échantillons de tissus bien annotés. des échantillons de tissus malades et normaux sont stockés soit le tissu frais congelé dans des biobanques spécialisées ou tissu enrobé de paraffine (FFPET) blocs fixés au formol dans les archives cliniques. Les tissus frais congelé permet l'extraction des acides nucléiques de haute qualité et a été largement utilisé dans les études de découverte de biomarqueurs génomiques. 2,3 Cependant, moins d' échantillons de tissus sont disponibles dans les biobanques et à étudier un tel tissu introduit un biais vers des échantillons plus larges, des catégories inhabituelles de la maladie, et les patients vus dans des centres spécialisés avec une plus grande capacité au tissu bancaire. 4 FFPET, en revanche, est la méthode de stockage par défaut pour les tissus humains et animaux malades. Bien que les blocs FFPET maintiennent m cellulaireorphology, le processus de fixation des liens croisés autres constituants cellulaires à des acides nucléiques. ARN et l' ADN réticulé sont recouvrables, mais seulement dans des formes dégradées, très fragmentées. 5,6 Cependant, ces fragments d'ADN et d' ARN se prêtent à une analyse par un éventail croissant de tests, y compris l' expression de l' ARNm, l' ADN hypermethylation, et le séquençage ciblé. 7,8 pour exploiter cette occasion dans la grande quantité et variété de FFPET disponible pour la recherche, il existe un besoin pour un protocole d'extraction efficace et fiable.
Une grande partie de la recherche de marqueurs biologiques dans le tissu se concentre sur le cancer. Comme d'autres types de tissus malades, le tissu cancéreux se manifeste souvent hétérogénéité régionale importante en matière de préservation des cellules et le type de cellule. Puisque la recherche de marqueurs biologiques repose sur la capacité à corréler constituants du tissu malade avec des caractéristiques moléculaires, une étape critique de ce processus est la récolte précise du tissu qui est bien préservé et enrichi pour la dalad ie l'étude. Dans FFPET, deux techniques d'enrichissement sont souvent utilisées: microdissection par capture laser (LCM), et la coupe du microtome. LCM permet fortement axé la récolte des tissus et peut être utilisé pour isoler des types cellulaires spécifiques, bien conservés dans les tissus hétérogènes. 9,10 Cependant, LCM nécessite un équipement coûteux et est extrêmement laborieuse , pour un grand nombre d'échantillons. Tronçonnage Microtome est un processus plus largement utilisé où les sections minces sont découpées à partir de blocs FFPET. 11,12 sections Microtome coupées comprennent souvent un tissu qui est hétérogène dans la préservation de la cellule (par exemple, par rapport à nécrotique bien conservé) et de la composition (par exemple, le cancer vs. parenchyme bénigne), et peut donc conduire à l'homogénéisation des caractéristiques moléculaires meilleurs étudiés séparément. Par conséquent, il existe un besoin pour un procédé à haut débit, qui enrichit les cellules d'intérêt. Une troisième méthode, l'isolement des acides nucléiques à partir des noyaux de FFPET, fournit cet enrichissement, convient pour une grande throughput protocoles, et a été utilisé par d' autres pour isoler l' ARN ou de l' ADN à partir de noyaux de tissus séparés. 7,13,14
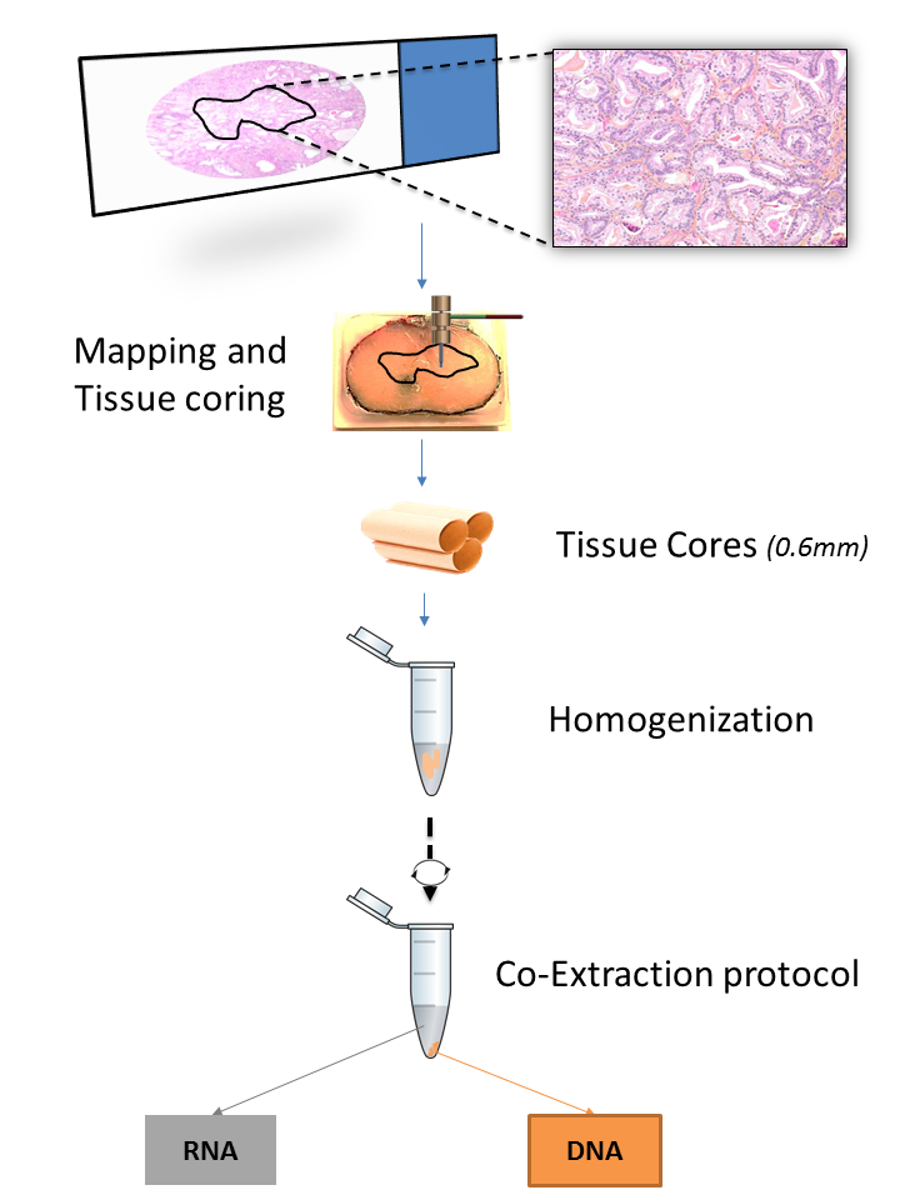
Un certain nombre de protocoles publiés de préciser les méthodes d'extraction d' acides nucléiques à partir de FFPET (tableau 1). Cependant, les protocoles où l' ARN et l' ADN sont extraits du même tissu ont été optimisés pour des coupes de tissus microtome, mais pas pour les cœurs de tissu. 15,16 protocoles De même, publiés qui offrent une spécificité accrue de tissus, soit par des noyaux de tissus ou microdissections de diapositives, spécifier les procédures pour l' extraction de l' ADN, mais pas l' ARN. 7,17 ici, un protocole optimisé pour une double extraction à la fois de l' ADN et de l' ARN à partir du même cœur de tissu est démontrée. noyaux de tissus sont récoltés en insérant microarray de tissu (TMA) poinçons dans des régions d'intérêt mappés sur des blocs de FFPET. La mise en correspondance est effectuée en annotant une lame de microscope avec un stylo marqueur et transférer l'annotation à la surface correspondante de la FFPEBloc de T (figure 1).
Des travaux antérieurs qui ont conduit à l'élaboration de ce protocole comprenait une comparaison de plusieurs systèmes d'extraction d'acide nucléique disponibles dans le commerce. Dans cette comparaison, les modifications des protocoles commerciaux, tels que décrits ci - après à condition que les ADN et ARN plus hauts rendements et de la qualité (Selvarajah et al., En préparation). Carottes de tissu sont plus épaisses que les sections de 5 à 10 microns um typiquement utilisés dans des protocoles d'extraction FFPET 11,12,14,18 - 20, et peuvent contenir des quantités variables de plus de paraffine. Pour compenser cela, déparaffinage a été renforcée par la répétition des traitements de xylène et l' éthanol et en introduisant une étape d'homogénéisation motorisé (Figure 1). Par ailleurs, la protéinase K temps de digestion ont été allongées pour augmenter le rendement de l'ADN. Dans l'ensemble, ce protocole est rentable et permet l'établissement de liens entre les caractéristiques moléculaires et histopathologiques de la maladie dans large, populations bien caractérisées. Le protocole dans son intégralité peut être effectuée de manière fiable dans les 2 jours, y compris 3 heures de mains sur le temps, avec peu de besoin d'équipement spécialisé ou coûteux.
Le protocole étape par étape est ci-après comme une version modifiée du protocole du fabricant. 21 S'il vous plaît voir le tableau des matériaux / équipement pour les réactifs spécifiques, l' équipement et les fabricants.
Protocole
1. Tissue Coring
- Review the microscope slide and outline the region(s) of interest using a fine-point permanent marker. Cut out a section of paraffin film large enough to cover the region of interest on the microscope slide. Place film firmly on slide and wrap film over edges to keep the film from slipping. Using a fine-point permanent marker, outline the entire tissue and the region(s) of interest within the tissue, keeping the outline touching – but outside of – the region(s).
- Remove the film and transfer it to the corresponding tissue block. Orient the film by flipping or rotating it so that the outline of the entire tissue matches the observed shape of the tissue in the block (Figure 1). Press the section of film firmly to the surface of the block to prevent slippage.
- Using the tip of the permanent marker, make shallow but visible (~0.2 mm) indentations along the outline of the region(s) of interest, then remove the film. Load 1 ml of bleach, 70% ethanol, and water into separate 1.5 or 2.0 ml microcentrifuge tubes.
- Clean the receptor (red) punch from the 0.6 mm punch set by sliding the punch up and down several times while the tip is submerged into the tube containing bleach. Repeat the above step with 70% ethanol and then water (critical to ensure that bleach is removed).
- Press the punch into the tissue, inside the region of interest to a depth of 3 mm and withdraw the punch. Release the core into a low binding 1.5 or 2 ml tube by pushing it out of the punch with the stylus. Store the cores at -20 °C (long-term) or 4 °C for short-term use.
- Clean the punch according to step 1.4 and continue with the next regions or sample.
2. Deparaffinize the FFPE Tissue Cores
- Carryout deparaffinization in 1.5 or 2 ml tubes by adding 1 ml xylene to the tissue core and vortexing vigorously for 10 sec. Heat for 3 min at 50 °C.
- Centrifuge for 2 min at room temperature (RT) and maximum speed (21,130 x g) and place tube on ice for 5 min (allows the waxy residue to solidify on the top).
- Carefully remove paraffin accumulated around meniscus with supernatant using a pipette tip and repeat xylene treatment (steps 2.1-2.2).
- Add 1 ml of ethanol (100%) and vortex vigorously for 10 sec. Centrifuge for 2 min at RT (maximum speed), and carefully discard the ethanol. Repeat the above step once.
3. Homogenization of the Deparaffinized Cores
- Resuspend the cores in 700 µl of ethanol (100%) prior to homogenization. Using a motorized tissue homogenizer, grind the cores into fine tissue particles (~1 min on medium setting). Clean the homogenizer probe between each sample to minimize carry-over contamination.
- Fill 15 ml tubes with ~10 ml of bleach, RNase neutralizing solution and 70% ethanol. After sample homogenization, wash the homogenizer probe in each of the cleaning solutions in the order stated above. Run the homogenizer on the highest speed during the washing stage.
- Wipe the probe with tissue and allow probe to dry completely before homogenizing the next sample. Visually inspect the probe blades for residual tissue pieces. If found, clean the probe again. Change the cleaning solutions (bleach, ethanol, and RNase neutralizing solution) daily.
- Following homogenization, bring the sample volume to 1 ml by adding more 100% ethanol (~300 µl). Centrifuge at maximum speed for 15 min, carefully aspirate the ethanol and air dry pellet for approximately 15-20 min before proceeding with RNA extraction.
4. Digestion with Proteinase K
- Resuspend the pellet in 150 µl Proteinase K digestion Buffer and flick tube to loosen the pellet. Add 10 µl of temperature-stable proteinase K and mix by flicking (do not vortex the tube). Incubate the content in the tube at 56 °C for 15 min with mild agitation.
- Allow tube to incubate on ice for 3 min. Complete cooling is important for efficient precipitation in the following step. Centrifuge for 15 min at maximum speed.
5. Separate RNA from DNA
- Carefully transfer the supernatant, without disturbing the pellet, to a new 1.5 ml for RNA purification.
- Keep the pellet for DNA purification (pellet can be stored for 2 hr at RT, for up to 1 day at 2-8 °C, or for longer periods at -20 °C).
6. RNA Purification
- Incubate the RNA-containing supernatant at 80 °C for 15 min (do not exceed this time). Next, briefly centrifuge the tube to collect drops from the inside of the lid.
- Add 320 µl Buffer RLT to adjust binding conditions, and mix by pipetting. Next, add 720 µl ethanol (100%), and vortex.
- Transfer 600 µl of the sample, including any precipitate that may have formed, to RNA spin column (supplied in the kit) placed in a 2 ml collection tube and set aside the remaining content. Centrifuge for 15 sec at ≥8,000 x g, discard the flow-through and reuse the collection tube.
- Transfer remaining sample onto a column, including droplets that may have accumulated in the lid of the tube, centrifuge for 15 sec at ≥8,000 x g, and discard the flow-through.
- Add 350 µl Buffer FRN to the spin column and centrifuge for 15 sec at ≥8,000 x g, discard the flow-through and reuse collection tube.
- Gently mix 10 µl DNase I stock solution with 70 µl Buffer RDD, add directly to the spin column membrane, and incubate at RT for 15 min.
- Add 500 µl Buffer FRN to the spin column, centrifuge for 15 sec at ≥8,000 x g and save the flow-through for use in the next step. To enhance recovery of small RNAs, place the spin column in a new 2 ml collection tube and apply the flow-through from the previous step to the spin column.
- Centrifuge for 15 sec at ≥8,000 x g, discard the flow-through and reuse the collection tube in next step. Add 500 µl Buffer RPE to the spin column and centrifuge for 15 sec at ≥8,000 x g, discard the flow-through and reuse the collection tube in the next step.
- Add 500 µl Buffer RPE to the spin column and centrifuge for 15 sec at ≥8,000 x g and discard the collection tube with the flow-through.
- Place the spin column in a new 2 ml collection tube, open the lid and centrifuge at maximum speed for 5 min. Discard the collection tube with the flow-through.
- Place the spin column in a new 1.5 ml collection, add 20 µl of RNase-free water directly onto the spin column membrane, and incubate the tube for 1 min at RT. Centrifuge at maximum speed for 1 min to elute the RNA. Store the eluted RNA sample at -80 °C.
7. DNA Purification
- Resuspend the pellet obtained during the RNA extraction by stepwise addition of 45 µl of proteinase K buffer (400 mM Tris 7.5, 400 mM NaCl, 3 mM MgCl2, 4% SDS); 45 µl H2O; and 400 µg of high potency Proteinase K.
- Incubate the above solution at 56 °C for 24 hr (recommended) or overnight. Performincubation at 90 °C for 2 hr without agitation and briefly centrifuge the microcentrifuge tube to collect drops from inside of the lid.
- Allow the sample to cool to RT and then add 4 µl RNase A (100 mg/ml). Incubate the sample for 2 min at RT.
- Add 200 µl Buffer AL to the sample, and mix thoroughly by vortexing. Next, add 200 µl of 100% ethanol, and mix thoroughly by vortexing. Transfer the entire sample to the provided spin column, place in a 2 ml collection tube, and centrifuge for 1 min at ≥8,000 x g.
- Discard the collection tube with the flow-through and place the spin column in a new 2 ml collection tube. Add 700 µl Buffer AW1 to the spin column, centrifuge for 15 sec at ≥8,000 x g, discard the flow-through and reuse the collection tube.
- Add 700 µl Buffer AW2 to the spin column, centrifuge for 15 sec at ≥8,000 x g, discard the flow-through and reuse the collection tube. Next, add 700 µl of 100% ethanol to the spin column, centrifuge for 15 sec at ≥8,000 x g and discard the collection tube with the flow-through.
- Place the spin column in a new 2 ml collection tube, open the lid of the spin column, and centrifuge at full speed for 5 min. Discard the collection tube with the flow-through.
- Place the spin column in a new 1.5 ml collection tube and add 25 µl of heated nuclease-free water (50 °C). Incubate column and tube at 50 °C for 10 min. Centrifuge for 1 min at maximum speed, add 25 µl of nuclease-free water (RT) to column and incubate for 1 min at RT.
- Centrifuge for 1 min at maximum speed (21,130 x g) and harvest flow-through containing genomic DNA (approximately 50 µl of DNA in total). Store the column at -20 °C (in case another elution is required later).
Résultats
This protocol represents an optimized method for recovering DNA and RNA from tissue cores, using modifications of a commercial extraction system designed for tissue sections. Optimization included the introduction of tissue homogenization, utilization of more potent Proteinase K for DNA extraction, and extension of tissue digestion time. Graphs and statistical analyses included 2-way ANOVA, linear regression and correlation.
Optimizations of Proteinase Digestion
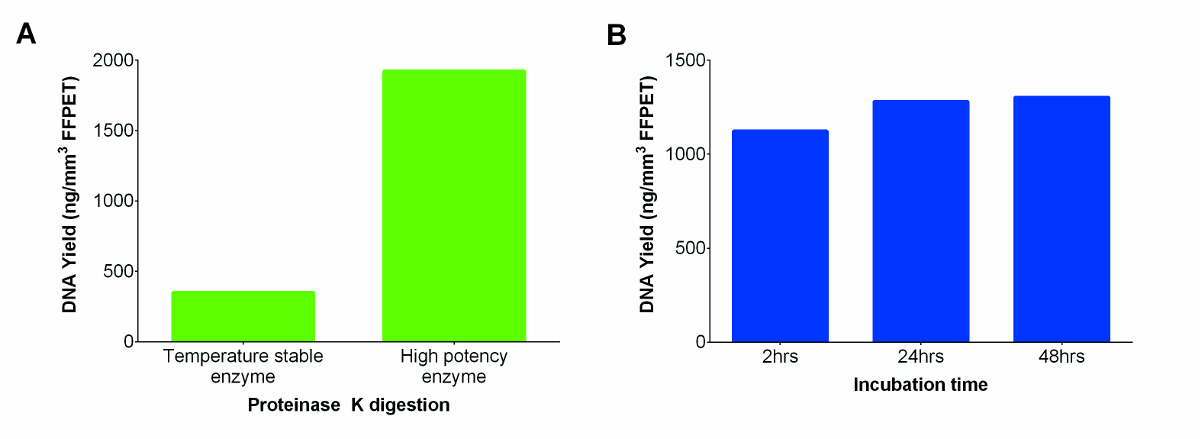
The commercial kit included a room temperature stable proteinase K solution which was substituted with a more potent proteinase K, resulting in higher DNA yield (Figure 2A). To further increase the DNA yields, digestion was extended from 2 to 24 hr. No significant differences were seen between the two time points, but the 24 hr digestion appeared to provide more consistent yields across samples. However, further incubation to 48 hr did not further improve DNA recovery (Figure 2B; p = 0.74).
Typical DNA Recovery from FFPE Prostate Cancer Tissue Samples
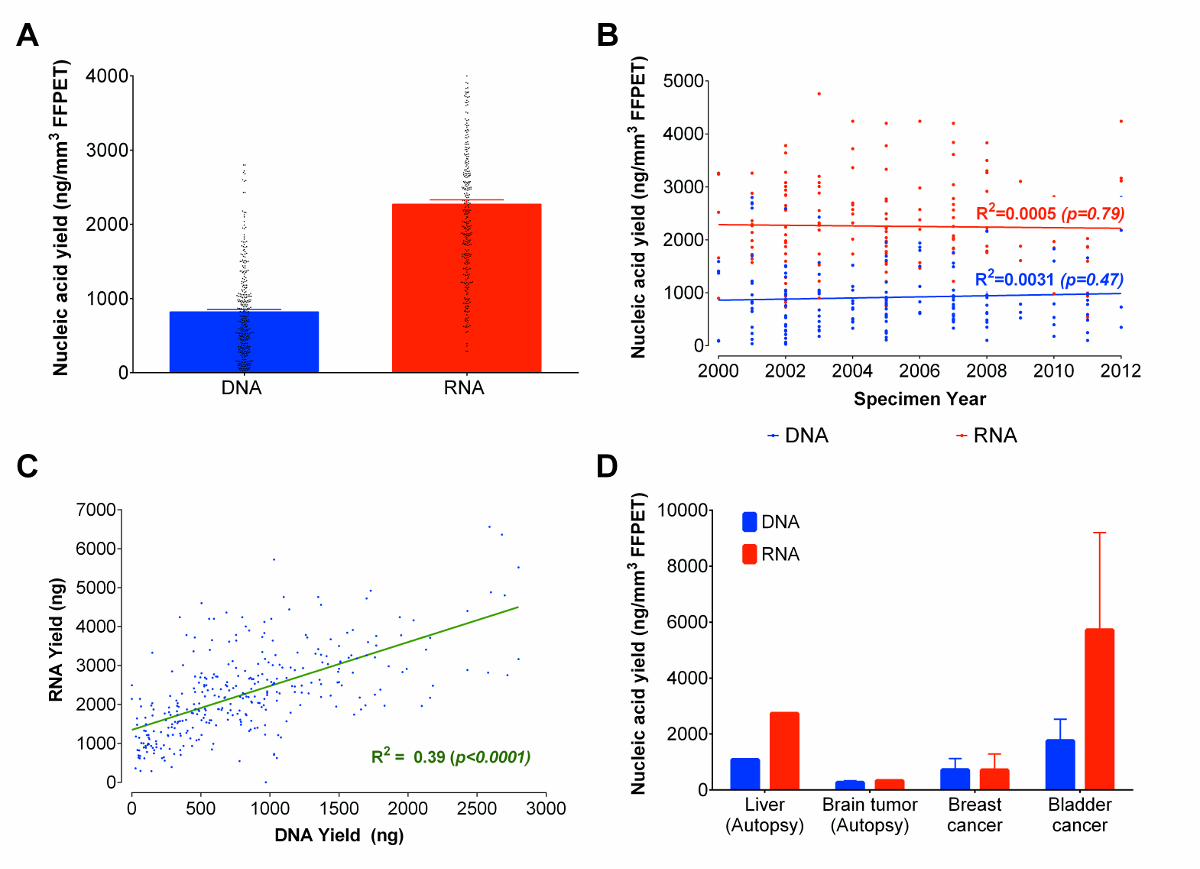
Using the optimized protocol, RNA and DNA were co-extracted from 333 prostate cancer FFPET samples ranging from 3 to 14 years in sample age. From each sample, 3 tissue cores (average total tissue volume of 0.95 ± 0.13 mm3) were used as input. While there are other microfluidic based gel-electrophoresis methods which can estimate concentrations and provide evaluations of the size distribution of nucleic acids molecules, such methods do not provide reproducible nucleic acids quantification, and cannot distinguish between RNA and DNA as flourometrically-based assays do.22 And, because microfluidic based gel-electrophoresis results are not reliable for fragmented nucleic acids derived from FFPET,23 nucleic acid yields were measured fluorometrically (see reagent list for details). The average yield was 2,270 ng of RNA and 820 ng of DNA (Figure 3A). Approximately 90% of all FFPET samples analysed in this study yielded ≥100 ng of DNA and ≥ 500 ng of RNA. Interestingly, there was no significant correlation between the age of the FFPET sample and nucleic acid recovery (Figure 3B). Overall, RNA and DNA yields were correlated across samples (R2 = 0.39; p <0.0001), although more than twice as much RNA than DNA was recovered from each sample (Figure 3C).
As the pilot and optimization work was performed on prostate tissues, the next step was to investigate the performance of this protocol on a few additional types of archival tissue. Starting with surgically removed and autopsy FFPET samples representing benign liver (1 sample from 1 case), cancers of the brain (8 samples from 1 case), urinary bladder (2 samples from 2 cases), and breast (3 samples from 3 cases), the protocol yielded >100 ng of DNA and RNA from 90% of samples (Figure 3D). While nucleic acid yields were lower in autopsy tissues than in surgical tissues, representative results indicate that the protocol produces similar yields across cancers derived from different sites.
Assessment of RNA and DNA Integrity and their Representative Performance in Downstream Analysis
RNA expression analysis of 47 genes in 8 selected FFPET prostate cancer samples and a fresh PC-3 prostate cancer cell line sample (as a positive control) was performed using a commercial multianalyte gene expression platform that is optimized for FFPET. The mRNA counts in PC3 were typically higher than those from FFPET samples (Figure 4A). However, comparing relative expression of all genes, FFPET prostate cancer samples showed similar expression profiles to PC-3 RNA, indicating that both sources of RNA are suitable for RNA expression profiling.
To demonstrate performance of genomic DNA extracted with this protocol, bisulfite-converted DNA extracts from FFPET samples were amplified by methylation specific PCR (MSP).24 MSP analysis of ALU repetitive elements, highly methylated regions present in millions of copies in the human genome,25 was used as a genomic methylation control, and expected to show minimal variations between samples. As shown in Figure 4B, there was little to no variation seen between different samples in ALU MSP methylation levels. Further, MSP assays based on GSTP1, a gene known to be hypermethylated in prostate cancer but not in benign samples,26 showed no detectable amplifications in DNA from benign samples. As expected, lower qPCR cycle threshold values were detected in DNA from cancer tissues, indicating enrichment of methylated GSTP1 copies. The utility of nucleic acids recovered by this protocol was further tested in typical downstream assays, using nucleic acids recovered from benign liver and from a brain (post-mortem) and from two surgically removed breast cancer samples. Both RT-qPCR based expression and MSP assays performed well on breast cancer and liver FFPET, but the RT-PCR assay failed to amplify a highly expressed mRNA from the post-mortem brain tumor sample (Figure 4C), suggesting that RNA had degraded, likely due to delayed tissue fixation.

Figure 1: Overview of the Extraction Procedure for FFPET Samples. The figure illustrates how an area of interest in a tissue block is mapped based on histopathologic selection from a microscope slide. Three 0.6 mm tissue cores are then obtained from each tissue area by using biopsy punches, homogenized together and then subjected to extraction of both RNA and DNA. Please click here to view a larger version of this figure.

Figure 2: Nucleic Acids (DNA and RNA) yields in ng/mm3 of FFPET from two Proteinase K (Temperature Stable and High Potency Enzymes), and Tested across a Range of Incubation Times for the Latter. (A) Performance of Proteinase K from different suppliers. DNA extractions were performed on a representative FFPET sample using temperature stable enzyme supplied with the kit versus a more potent enzyme from another manufacturer. (B) Determining optimum Proteinase K incubation time to maximize the DNA yield. Performance of high concentration Proteinase K digestion was evaluated at three different incubation periods using 3 FFPET samples. Error bars represent standard error of mean (SEM). Please click here to view a larger version of this figure.

Figure 3: Nucleic Acids (DNA and RNA) yields in ng/mm3 of FFPET in Total, across Sample Years and Representative Tissue Types. (A) Total recovered nucleic acids from formalin-fixed paraffin-embedded tissue. The nucleic acids quantities presented are based on the extractions of 333 FFPET samples using the optimized protocol. (B) Correlation plot between recovered total DNA and RNA and the age of FFPET samples. The extracted FFPET samples used were obtained from the years 2000 to 2012. (C) Correlation between yields from concurrently extracted DNA and RNA from 333 prostate samples. There is a positive correlation between DNA and RNA yields. (D) Demonstration of the protocol using additional archival tissue types. The optimized protocol was used to extract nucleic acids from 14 cancer (breast, bladder and brain) and normal (liver) samples. Error bars represent SEM. Please click here to view a larger version of this figure.

Figure 4: Performance of RNA and DNA Co-extracted from Tissue Cores in Downstream Applications. (A) mRNA counts for FFPE prostate cancer tissues and for fresh PC-3 cell line control. Each point represents the average of 3 technical replicates extracted separately. Fresh PC-3 cell line RNA values are illustrated by yellow bars and FFPET tissue values are represented by coloured dots. (B) Methylation specific PCR assays on DNA of FFPET prostate cancer samples. Cycle threshold values were obtained for 10 samples performed as expected using 50 ng/reaction of bisulfite converted DNA. ALU MSP assays from all FFPET samples had similar cycle threshold values (p >0.67). GSTP1 MSP assays showed higher methylation (lower cycle threshold) levels in prostate cancer than in benign prostate. (C) Assessment of DNA and RNA quality from additional tissue types. HPRT1 gene expression and Alu gene methylation assays were performed on nucleic acids (RNA and DNA respectively) extracted from normal liver (autopsy), and brain (autopsy) and breast cancers (all FFPET). Results from prostate are shown for comparison. Note: similar results were observed from each tissue type, except for failed mRNA amplification from one autopsy sample. Each point or bar represents a sample, and error bars represent SEM. Please click here to view a larger version of this figure.
| Tissue Cores | |||||||||||
| Tissue Input (mm3) | Extracted Nucleic Acid | Validation | Quality check: DNA | Quality check: RNA | |||||||
| (# of samples) | Age of Sample (years) | Total Yield (ng) | Fragment size (bp) | PCR | Total Yield (ng) | Fragment size (bp) | PCR | NanoString | |||
| Pikor et al. | 43 - 129 | DNA | No data | No data | No data | No data | |||||
| Montaser-Kouhsari et al. | 18 - 29.5 | RNA | 763 | 0-25 | 843 | No data | |||||
| This paper | 1.71 | DNA and RNA | >350 | 3-12 | 820 | 100 - 500 |  | 2270 | 100-500 | | |
| Tissue Sections | |||||||||||
| Tissue Input | Extracted Nucleic Acid | Validation | Quality check: DNA | Quality check: RNA | |||||||
| (# of samples) | Age of Sample (years) | Total Yield (ng) | Fragment size (bp) | PCR | Total Yield (ng) | Fragment size (bp) | PCR | NanoString | |||
| Heikal et al. | 5 x 5 µm | DNA | 12 | 7-22 | 88-300 | 103-351 | | ||||
| Chung et al. | 1 x 20 um | RNA | 9 | >5 | 16,000- 23,000 | 100-200 | | ||||
| Antica et al. | 2 x 4 µm | RNA | 18 | No data | Unknown (621 ng/µl) | 80-202 + | | ||||
| Ghatak et al. | 5 x 5 µm | DNA and RNA | 5 | 1 | 14 256 | <1030 | | 16 000 | 109-400 + | | |
| Hennig et al. | 1 x 10 µm | DNA and RNA | 210 | 1-25 | No data | No data | | No data | No data | | |
| Laser Capture Microdissection | |||||||||||
| Tissue Input (mm2) | Extracted Nucleic Acid | Validation | Quality check: DNA | Quality check: RNA | |||||||
| (# of samples) | Age of Sample (years) | Total Yield (ng) | Fragment size (bp) | PCR | Total Yield (ng) | Fragment size (bp) | PCR | NanoString | |||
| Snow et al. | 1-2 | DNA | 110 | 0-2 | 430 | No data | | ||||
Table 1: A comparison of published DNA and RNA extraction protocols for tissue cores, sections and laser capture microdissections. Also included are several molecular endpoints assessment of these methods using PCR and Nanostring assays.
Discussion
For successful extraction of DNA and RNA from tissue regions of interest, accurate coring is critical. This protocol describes the use of a tissue punch to isolate 0.6 mm diameter cores and outlines the process for transferring notations from microscope slides to corresponding FFPET blocks. Modifications to the manufacturer's protocol were required to efficiently extract nucleic acids from cores, which are approximately 50 times thicker than the microtome sections for which the protocol was intended. Since the cores may contain more paraffin wax relative to tissue sections, effective deparaffinization of cores through repeated xylene and ethanol treatment steps were required. The success of the post-deparaffinization steps depended on proper mechanical tissue cores homogenization and efficient proteinase K digestion. Further optimization of the proteinase K digestion can be performed.
It is worth mentioning that this method identifies areas of interest on the surface of the block, as identified in corresponding histopathology slides. As the core harvests tissue that may be 3 or 4 mm deep, users of this protocol may be concerned about what cells or tissues lay beneath the block surface. While this is a valid concern, multiple studies (reviewed in reference27) have demonstrated that tissue cores faithfully represent the histologic and molecular features of pathologic tissue blocks, particularly when duplicate or triplicate cores are sampled from the area of interest.
As the modified commercial extraction kit adopted in this protocol enables concurrent extraction of both DNA and RNA from the same tissue, the protocol saves precious biological material and allows a direct comparison between the two resulting nucleic acids from the same sample. Concurrent extraction of RNA and DNA cuts down labor and tissue depletion by half, and enables precise integrated analysis of gene expression, as well as epigenetic and genetic features found in DNA. Since the yields of both RNA and DNA from these representative tissue cores typically exceed 600 and 300 ng, respectively, and since most current PCR and next generation sequencing applications typically require 10-100 ng, most of the samples purified by this protocol should provide adequate material for several downstream assays. This protocol has been shown to be reproducible across independent laboratories (Selvarajah et al., In Prep.). RNA from this protocol was of sufficient quality for gene expression analysis using either RT-PCR or a popular multianalyte platform, and DNA performed well in methylation specific PCR assays. Future studies aimed at assessing the utility of recovered nucleic acids in next generation sequencing are warranted.
Thus, several modifications were made to a commercially available protocol, designed for thin FFPET sections, rendering it suitable for the co-extraction of RNA and DNA from 0.6 mm FFPET cores. The protocol demonstrated consistently high yields in a large cohort of prostate cancer samples and in a limited set of samples from cancers of the breast, brain and bladder. Overall, the protocol should enable users to carry out targeted gene-based analyses of large well-annotated tissue collections. Importantly, the protocol enables efficient focused sampling of regions of interest in FFPET, relatively little hands-on time, and high enough yields for most downstream applications.
Déclarations de divulgation
The authors declare no competing financial interests.
Remerciements
This research was supported by a team grant from Movember/Prostate Cancer Canada to JMSB, DMB, PCP, and JL, and by the Ontario Institute of Cancer Research (JMSB, DMB, and PCP) and Motorcycle Ride for Dad Kingston/University Hospitals Kingston Foundation/Kingston General Hospital (DMB, PCP).
matériels
| Name | Company | Catalog Number | Comments |
| Plastic paraffin film, "Parafilm 'M'" | Bemis | RK-06720-40 | Any generic paraffin film will work as a substitute |
| Sodium Hypochlorite, "Ultra Bleach" | Likewise | 53-2879-2 | Any generic bleach will work as a substitute. Hazardous material that can cause burns on contact. |
| Molecular biology grade absolute ethanol | Fisher BioReagents | BP2818-500 | Sigma-Aldrich E7023 suffices as a substitute |
| Molecular Grade H2O | G-Biosciences | 786-293 | Sigma W4502 suffices, as well as any other brand of molecular grade H2O |
| 0.6 mm Punch Set for Beecher Instruments | Estigen | MPO6[Yellow] | Make sure to use the red receiver punch from the set |
| Fine point permanent marker | Sharpie | 10365796S | Using the marker on FFPE tissues causes it to dry out quickly, so several may be required |
| FFPE tissue block | |||
| Stained tissue slide corresponding to FFPE block | |||
| 1.5 ml Micro-Centrifuge Tubes | Fisher BioReagents | 05-408-137 | |
| 2.0 ml Low binding tubes (LoBind Micro-Centrifuge Tubes) | Eppendorf | 22431048 | |
| 1.5 ml Low binding tubes (LoBind Micro-Centrifuge Tubes) | Eppendorf | 22431021 | |
| Histology Xylene | VWR | CA 95057-822 | Fisher Scientific X5-500 suffices as a substitute |
| Molecular Biology Grade 2-Propanol | Sigma | I9516 | |
| AllPrep FFPE DNA/RNA Kit | Qiagen | 80234 | Prepare buffers accodring to the AllPrep DNA/RNA FFPE Handbook21 |
| Buffers: RLT, FRN, RPE, ATL, AL, AW1, AW2, DNaseI solution | Qiagen | 80234 | Prepare buffers accodring to the AllPrep DNA/RNA FFPE Handbook21 |
| Temperature stable proteinase K | Qiagen | 80234 | |
| High potency proteinase K | Invitrogen | 25530-049 | Invitrogen 25530-015 suffices as a substitute |
| RNAse neutralizing solution (Rnase AWAY) | Molecular BioProducts | 7003 | |
| RNaseA 100 mg/ml | Qiagen | 19101 | |
| BD Integra Syringe 3 ml 21G x 1/2 | BD | 305274 | |
| Motorized tissue homogenizer (TissueRuptor) | Qiagen | 9001271 | Fisher Scientific 14-261-29 suffices as a substitute |
| -20 °C and -80 °C Laboratory Freezer | |||
| Micro-Centrifuge with rotor for 2 ml tubes | |||
| Digital Vortex Mixer | |||
| Pipettes and filter tips | |||
| Heating blocks or water baths | |||
| Tris Hydrochloride | Amresco | 0234 | |
| Sodium Chloride | Amresco | 0241 | |
| Anhydrous Magnesium Chloride | Sigma | M8266 | |
| Sodium Dodecyl Sulfate | Sigma | L4509 | |
| Acrodisc 25 mm syring filters with 0.45 µm Supor membrane | Pall | PN 4614 | |
| Syringe with retracting BD PrecisionGlide needle 3 ml | BD Integra | 305274 | |
| Hydrochloric Acid | BDH | 3026 | |
| Multianalyte gene expression platfrom (nCounter ® CAE codeset and Nanostring nCounter platform) | Nanostring nCounter platform, Nanostring | ||
| Fluorometric nucleic acid quantification (Qubit dsDNA HS Assay Kit and Qubit® RNA BR Assay Kit) | Invitrogen |
Références
- Kern, S. E. Why your new cancer biomarker may never work: recurrent patterns and remarkable diversity in biomarker failures. Cancer Res. 72 (23), 6097-6101 (2012).
- Klopfleisch, R., Weiss, A. T. A., Gruber, A. D. Excavation of a buried treasure--DNA, mRNA, miRNA and protein analysis in formalin fixed, paraffin embedded tissues. Histol. Histopathol. 26 (6), 797-810 (2011).
- Beltran, H., et al. Targeted Next-generation Sequencing of Advanced Prostate Cancer Identifies Potential Therapeutic Targets and Disease Heterogeneity. Eur. Urol. 63 (5), 920-926 (2013).
- Hoppin, J. A., Tolbert, P. E., Taylor, J. A., Schroeder, J. C., Holly, E. A. Potential for selection bias with tumor tissue retrieval in molecular epidemiology studies. Ann. Epidemiol. 12 (1), 1-6 (2002).
- von Ahlfen, S., Missel, A., Bendrat, K., Schlumpberger, M. Determinants of RNA quality from FFPE samples. PLOS ONE. 2 (12), e1261 (2007).
- Masuda, N., Ohnishi, T., Kawamoto, S., Monden, M., Okubo, K. Analysis of chemical modification of RNA from formalin-fixed samples and optimization of molecular biology applications for such samples. Nucleic Acids Res. 27 (22), 4436-4443 (1999).
- Pikor, L. A., Enfield, K. S. S., Cameron, H., Lam, W. L. DNA extraction from paraffin embedded material for genetic and epigenetic analyses. J. Vis. Exp. (49), (2011).
- Turashvili, G., et al. Nucleic acid quantity and quality from paraffin blocks: defining optimal fixation, processing and DNA/RNA extraction techniques. Exp. Mol. Pathol. 92 (1), 33-43 (2012).
- Espina, V., et al. Laser-capture microdissection. Nat. Protoc. 1 (2), 586-603 (2006).
- Hackler, L., Masuda, T., Oliver, V. F., Merbs, S. L., Zack, D. J. Use of laser capture microdissection for analysis of retinal mRNA/miRNA expression and DNA methylation. Methods Mol. Biol. 884, 289-304 (2012).
- Bonin, S., Stanta, G. Nucleic acid extraction methods from fixed and paraffin-embedded tissues in cancer diagnostics. Expert Rev. Mol. Diagn. 13 (3), 271-282 (2013).
- Bonin, S., et al. Multicentre validation study of nucleic acids extraction from FFPE tissues. Virchows Archiv. 457 (3), 309-317 (2010).
- Montaser-Kouhsari, L., et al. Image-guided Coring for Large-scale Studies in Molecular Pathology. Appl. Immunohistochem. Mol. Morphol. , (2015).
- van Eijk, R., Stevens, L., Morreau, H., van Wezel, T. Assessment of a fully automated high-throughput DNA extraction method from formalin-fixed, paraffin-embedded tissue for KRAS, and BRAF somatic mutation analysis. Exp. Mol. Pathol. 94 (1), 121-125 (2013).
- Ghatak, S., Sanga, Z., Pautu, J. L., Kumar, N. S. Coextraction and PCR Based Analysis of Nucleic Acids From Formalin-Fixed Paraffin-Embedded Specimens. J. Clin. Lab. Anal. , (2014).
- Hennig, G., et al. Automated extraction of DNA and RNA from a single formalin-fixed paraffin-embedded tissue section for analysis of both single-nucleotide polymorphisms and mRNA expression. Clin. Chem. 56 (12), 1845-1853 (2010).
- Snow, A. N., Stence, A. A., Pruessner, J. A., Bossler, A. D., Ma, D. A simple and cost-effective method of DNA extraction from small formalin-fixed paraffin-embedded tissue for molecular oncologic testing. BMC Clin. Pathol. 14 (1), 30 (2014).
- Torrente, M. C., et al. DNA extraction from formalin-fixed laryngeal biopsies: Comparison of techniques. Acta Otolaryngol. 131 (3), 330-333 (2011).
- Okello, J. B. A., et al. Comparison of methods in the recovery of nucleic acids from archival formalin-fixed paraffin-embedded autopsy tissues. Anal. Bochem. 400 (1), 110-117 (2010).
- Abramovitz, M., et al. Optimization of RNA extraction from FFPE tissues for expression profiling in the DASL assay. BioTechniques. 44 (3), 417-423 (2008).
- . . AllPrep DNA/RNA FFPE Handbook. , (2012).
- Laurent, L. C., et al. Meeting report: discussions and preliminary findings on extracellular RNA measurement methods from laboratories in the NIH Extracellular RNA Communication Consortium. Journal of Extracell. Vesicles. 4, (2015).
- . Methods of RNA Quality Assessment Available from: https://www.promega.ca/resources/pubhub/methods-of-rna-quality-assessment (2012)
- Herman, J. G., Graff, J. R., Myohanen, S., Nelkin, B. D., Baylin, S. B. Methylation-specific PCR: a novel PCR assay for methylation status of CpG islands. Proc. Natl. Acad. Sci. U.S.A. 93 (18), 9821-9826 (1996).
- Weisenberger, D. J., Campan, M., et al. Analysis of repetitive element DNA methylation by MethyLight. Nucleic acids research. 33 (21), 6823-6836 (2005).
- Yegnasubramanian, S. Hypermethylation of CpG Islands in Primary and Metastatic Human Prostate Cancer. Cancer Res. 64 (6), 1975-1986 (2004).
- Parsons, M., Grabsch, H. How to make tissue microarrays. Diagn. Histopathol. 15 (3), 142-150 (2009).
Réimpressions et Autorisations
Demande d’autorisation pour utiliser le texte ou les figures de cet article JoVE
Demande d’autorisationThis article has been published
Video Coming Soon
À PROPOS DE JoVE
Copyright © 2025 MyJoVE Corporation. Tous droits réservés.