
A subscription to JoVE is required to view this content. Sign in or start your free trial.
Method Article
זיהוי תפוקה גבוהה של עמידות לפסאודומונס syringae pv. עגבניה בעגבניה באמצעות שתיל שיטפון שיטת
In This Article
Erratum Notice
Summary
השטף שתיל המבול מאפשר הקרנה מהירה של הקלה עגבניות בר עבור התנגדות פסבדו החיידק syringae bacterium. מעשה זה, המשמש בשילוב עם השימוש בקביעת הצמיחה החיידקית של הנבט, יכול לסייע עוד יותר באפיון ההתנגדות הבסיסית לחיידק, וניתן להשתמש בו כדי לקבוע את הבסיס לאוכלוסיות מיפוי כדי לברר את היסוד הגנטי של ההתנגדות.
Abstract
עגבנייה היא יבול חשוב agronomically שיכול להיות נגוע על ידי פסאודומונס syringae, חיידק גראם שלילי, וכתוצאה מכך מחלת הגרגר חיידקי. העגבנייה-P. syringae pv. מערכת העגבניות היא בשימוש נרחב כדי לנתח את הבסיס הגנטי של הצמח תגובות מולדים התנגדות המחלה. בעוד המחלה הצליחה בהצלחה במשך עשרות שנים רבות באמצעות המבוא של pto/Prf האשכול גנים מסולנום פיפינליות לתוך עגבניה מעובד, גזע 1 זנים של P. syringae התפתחו כדי להתגבר על התנגדות הענקת ידי pto/prf האשכול גנים ומתרחשים ברחבי העולם.
מינים עגבניות בר הם מאגרים חשובים של גיוון טבעי בזיהוי הפתוגן, כי הם התפתחו בסביבות מגוונות עם לחצים הפתוגן שונים. במסכים טיפוסיים עבור עמידות למחלות בעגבניות בר, צמחים למבוגרים משמשים, אשר יכול להגביל את מספר הצמחים שניתן לוקרן בשל זמן צמיחה המורחבת שלהם ודרישות שטח גדילה גדול יותר. פיתחנו שיטה למסך 10-יום-שתילי עגבניות של התנגדות, אשר ממזער את הצמיחה הצמח זמן וחלל קאמרית הצמיחה, מאפשר תחלופת מהירה של צמחים, ומאפשר לדגום גדלים גדולים להיבדק. שתילים התוצאות של הישרדות או מוות יכול להיות מטופלים כמו פנוטיפים דיסקרטית או על סולם ההתנגדות המוגדר על ידי כמות הצמיחה החדשה בשתילים ששרדו לאחר ההצפה. שיטה זו כבר ממוטבת למסך 10-יום-שתילי עגבניות התנגדות לשני זני p. syringae והוא יכול בקלות להתאים זנים p syringae אחרים.
Introduction
פסאודומונס syringae הוא חיידק פתוגניים שלילי גרם מדביק מגוון רחב של מארחי הצמח. חיידקים להיכנס למפעל מארח דרך הסטוטה או פצעים פיזיים מתרבים בתוך האפוסט1. צמחים התפתחו תגובה חיסונית דו שכבתית כדי להגן מפני זיהום על ידי פתוגנים חיידקיים. הרמה הראשונה מתרחשת במשטח התא של הצמח, שבו קולטני הזיהוי תבניות על קרום התא הצמח תופס מאוד שימור הפתוגן הקשורים דפוסי מולקולרי (PAMPs) בתהליך שנקרא PAMPS-מופעל חסינות (PAMPS)2. במהלך תהליך זה, המפעל המארח upregulates תגובת ההגנה מסלולים, כולל התצהיר של callose לקיר התא, סגירת שיניים, ייצור של מינים חמצן תגובתי, ו אינדוקציה של הגנים הקשורים בפתוגנזה.
חיידקים יכולים להתגבר על PTI על ידי ניצול סוג III הפרשה מערכת כדי לספק חלבונים, הנקראים מפלעריקים, ישירות לתא הצמח3. אפקטור חלבונים בדרך כלל המטרה מרכיבים של PTI ולקדם התקפה אלימה הפתוגן4. הרמה השנייה של חסינות הצמח מתרחשת בתוך תא הצמח על ידי הכרה של חלבונים האפקטור. הכרה זו תלויה גנים התנגדות, אשר לקודד נוקלאוטיד האתר מחייב לוקמיה עשיר לחזור המכיל קולטנים (NLRs). מסוגלים לזהות את העריקים ישירות או לזהות את פעילותם במטרה של התקפה אלימה או דמה5. לאחר מכן הם מפעילים תגובה חיסונית משנית בתהליך שנקרא אפקטור החיסון המופעל (אתי), אשר קשורה לעתים קרובות עם תגובה רגישות יתר (HR), צורה של מוות תאים מקומי באתר של זיהום6. לעומת התנגדות גנטית לגנים הקשורים אתי, הצמחים יכולים להפגין עמידות חלקית כמותית, אשר תלויה בתרומה של גנים מרובים7.
P. syringae pv. עגבניות (Pst) הוא סוכן סיבתי של גרגר חיידקי על עגבניות והוא בעיה חקלאית מתמשך. זנים השולט בשדה יש בדרך כלל מרוץ Pst 0 זנים המבטאים או שניהם מסוג III AvrPto ו AvrPtoB. DC3000 (PstDC3000) הוא גזע נציג 0 זן מודל פתוגן שיכול לגרום לגרגר חיידקי בעגבניה. כדי להילחם במחלת הגרגר החיידקי, המגדלים המאכבו את pto [P. syringae pv. עגבניה]/prf [pto התנגדות ו fenthion רגישות] שאשכול גנים מתוך מינים עגבניות פראי solanum פיפינאליןלזנים מודרניים8,9. הגן pto מקודד את החלבון סרין טראונין קינאז כי, יחד עם prf nlr, מעניקה עמידות ל PstDC3000 דרך ההכרה של העריקים AvrPto ו AvrPtoB10,11,12,13,14. עם זאת, התנגדות זו אינה יעילה נגד גזע המתעוררים 1 זנים, המאפשר התפשטות מהירה ואגרסיבית שלהם בשנים האחרונות15,16. גזע 1 זנים להתחמק הכרה על ידי האשכול pto/prf , כי AvrPto הוא איבד או מוטציה בזנים אלה, ו AvrPtoB מופיע לצבור מינימלית15,17,18.
אוכלוסיות עגבניות בר הם מאגרים חשובים של וריאציה טבעית עבור Pst התנגדות ובעבר שימשו כדי לזהות התנגדות פוטנציאל הרוח19,20,21. עם זאת, מסכי הנוכחי עבור עמידות הפתוגן לנצל 4 – 5-שבוע-צמחים למבוגרים בן20,21. לפיכך, הם מוגבלים בזמן הגדילה, בחלל חדר הצמיחה ובמידות קטנות יחסית. כדי להתמודד עם מגבלות של גישות קונבנציונליות, פיתחנו syringae בקצב גבוה של עגבניות P. שיטת התנגדות באמצעות שתילי עגבניות בן 10 ימים22. גישה זו מציעה מספר יתרונות על-ידי שימוש בצמחי מבוגרים: כלומר, זמן צמיחה קצר יותר, דרישות שטח מופחת ותפוקה גבוהה יותר. יתר על כן, הדגמנו כי גישה זו בנאמנות לכידה התנגדות המחלה פנוטיפים שנצפו בצמחים למבוגרים22.
בתיקון המבול שתיל המתואר בפרוטוקול זה, שתילי עגבניות גדלים על מנות פטרי של מדיה מורראשיג ו Skoog (MS) סטרילי במשך 10 ימים ולאחר מכן מוצפים באינת המכיל את החיידקים של הריבית ואת החומרים. בעקבות ההצפה, השתילים ניתן להעריך ככמת עבור התנגדות למחלות באמצעות assays הגידול חיידקי. בנוסף, שתיל הישרדות או מוות יכול לשמש התנגדות דיסקרטית או פנוטיפ המחלה 7 – 14 ימים לאחר ההצפה. גישה זו מציעה חלופה בתפוקה גבוהה עבור הקרנת מספר גדול של הגשת עגבניות בר עבור התנגדות pst מרוץ 1 זנים, כגון Pst להתאמץ t1 (pstt1), והוא יכול בקלות להיות מותאם לזנים חיידקיים אחרים של עניין.
Access restricted. Please log in or start a trial to view this content.
Protocol
1. הכנה ושימוש בארונות בטיחות
- נגב את ארון הביוטיחות. עם 70% אתנול
- סגרו את האבנט והדליקו את האור האולטרה-סגול בארון הביובטיחות במשך 15 דקות.
- לאחר 15 דקות, לכבות את האור האולטרה סגול בארון אבטחה טיחות. הרם את האבנט ותדליק. את המפוח למשך 15 דקות
- למחוק את כל הפריטים כדי לשמש הקבינט אבטחה טיחות עם 70% אתנול לפני לשים את הפריטים לתוך הארון מעוקר.
- כפפות נקיות או ידיים חשופות עם 70% אתנול לפני העבודה הקבינט אבטחה טיחות.
- , תעבוד במרכז הארון. הרחק מהמפוח
- השימוש בקבוקים סגורים של בלוק סטרילי 10 מ"מ mgcl2 ו-אלקטרופורזה H2O עבור ניסויים. הכניסו בקבוקים לארון הביובטיחות ורק לפתוח אותם בארון הביוטיחות מעוקר, לא על ספסל.
- השתמש בפיפטות זכוכית ייעודית ועצות פיפטה לעבודה בארון הביוטיחות המחוטא. . לעולם לא על שחקן הספסל
- לאחר השימוש של הקבינט אבטחה טיחות, החיטוי כל הפסולת (למעט פסולת אקונומיקה) ולנגב את פני השטח עם 70% אתנול.
2. הכנת מדיה צמחיים
- לשקול ולפזר 0.5 x ms בסיס מלחים בתוך אלקטרופורזה H2O. לשקול את 0.8% bacto אגר ולאחר מכן להוסיף מומס 0.5 x MS.
- אוטוקלב ומאפשרים לתקשורת להתקרר באמבט מים בגובה 50 ° c לפני שהיא מזיגת או מפיקה.
- כדי להבטיח כי הצלחות אינן מלאות יתר, מארק פוליסטירן חד פעמי סטרילי 100 x 25 מ"מ לוחות לרמת מילוי של 40 mL. שופכים מדיה לתוך 100 x 25 מ"מ לוחות סטרילי בארון מחוטא אבטחה טיחות.
3. הכנת חומרי צמח ותנאי גדילה
- מניחים זרעי עגבניות בצינור מיקרוצנטריפוגה 2.2 mL ולהוסיף 2.0 mL של 50% הפתרון אקונומיקה.
- לנדנד את הצינור על הנדנדה במשך 25 דקות.
- לאחר 25 דקות, להסיר את הזרעים מן הנדנדה ולהסיר את הפתרון אקונומיקה עם פיפטה בארון הביוטיחות סטרילי. ודא שכל האקונומיקה מוסרת.
- הוסף 2 מ ל של H באולטרסאונד סטרילי2O לשטוף את הזרעים. . היפוך הצינורית 5x
- הסירו את הנוזל מהצינור בעזרת פיפטה.
- חזור על שלבים 3.3 – 3.5 כדי לשטוף את הזרעים 4x יותר.
- הוסף 2 מ ל של H באולטרסאונד סטרילי2O ויוצקים את הזרעים לתוך צלחת פטרי ריק.
- מלקחיים הלהבה באתנול ולאפשר קריר לפני העברת ומרווח שווה הזרעים על 100 x 25 מ"מ לוחות המכילים 0.5 x MS + 0.8% אגר מדיה.
- העברה 5 – 7 זרעים בקו לאורך האמצע של צלחת אחת לאטום את קצות הצלחות עם קלטת כירורגית (1.25 ס מ x 9.1 m).
- Stratify את הזרעים מעוקר ב 4 ° c בחושך לפחות 3 ימים כדי לסנכרן נביטה. ודא שהלוחות מוערמים שטוחים והפנים כלפי מעלה, כך שהזרעים לא מחליפים את הצלחת.
- אנכית האוריינט הצלחות כך השורשים יגדל לאורך המשטח של הצלחת, עם קו של זרעים מונחה אופקית, בעת העברת אל חדר הצמיחה.
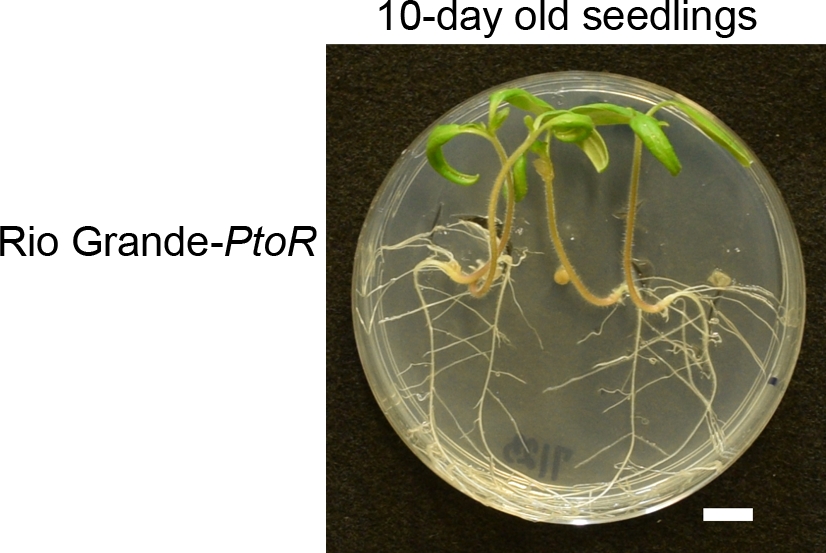
הערה: הגדר את חדר הצמיחה ל -22 ° c וספק 16 מעלות אור בעוצמת אור של ~ 200 – 220 μE מטר-2 s-1 ו- 8 h של האפלה. - לפני ההצפה, לגדל שתילים במשך 10 ימים בחדר הצמיחה שבו שתילים נקודה בדרך כלל להציג באופן מלא התפתחה פסיגי והמתעוררים עלים אמיתי הראשון (איור 1).

איור 1: השלב ההתפתחותי של שתילי העגבניות האופייניות לבני 10 ימים. ריו גראנדה-Ptor זרעי עגבניות היו מעוקר, מצופה, ומלא מרובדת לפחות 3 ימים בחשכה ב 4 ° c. השתילים גדלו ב-0.5 לוחות MS במשך 10 ימים ב -22 ° c לפני שוצף. בדרך כלל, בעשרה ימים מרחיבים את הקוטונים במלואם, והעלים האמיתיים הראשונים מתחילים לצוץ. אנא לחץ כאן כדי להציג גירסה גדולה יותר של איור זה.
4. הכנת המדיה של המלך ב-23 (KB)
- מילוי גביע עם 500 mL של H באלקטרופורזה2O ו מערבבים על צלחת מהומה.
- התמוססות לחלוטין 20 גרם של בלעד peptone, 1.5 גרם של Kהידרומטר ק 2hpo4, ו 12.5 מ ל של גליצרול בגביע עם בדיקת H2O.
- יוצקים את התערובת מומס לתוך גליל 1 l לסיים ולהעלות את הכרך 1 l הסופי עם H2באלקטרופורזה.
- יוצקים את הציר בחזרה לגביע ומערבבים עד שמעורב.
- שוקלים 7.5 g של bacto אגר לתוך 2 500 בקבוקי זכוכית mL ולהוסיף 500 mL של ציר KB משלב 4.4 לתוך כל בקבוק. אוטוקלב עבור 20 דקות.
- הסר את הבקבוקים מן החיטוי מערבולת בעדינות כדי להפיץ את אגר.
- העבירו את הבקבוקים לאמבט מים בגובה 50 ° c לשעה.
- אחרי 1 h, להעביר את הבקבוק לתוך הקבינט אבטחה טיחות בתנאים אספטי, להוסיף 1,600 μl של סטרילי 1 M mgso4, ואנטיביוטיקה המתאים למדיה.
הערה: עבור זנים גריסופלובין עמידים pstDC3000 ו pstT1, השתמש גריסופלובין מומס diמתילפרמיד בריכוז הסופי של 50 μg/mL. השתמש cycloheximide הומס באתנול בריכוז הסופי של 50 μg/mL כדי למנוע גידול פטרייתי על לוחיות. - מערבולת התקשורת בעדינות לערבב ולאחר מכן לשפוך כדי לכסות את החלק התחתון של לוחיות.
- לאפשר לפחות 1 h עבור לוחיות לגבש לפני לאחסן אותם הפוך ב 4 ° c.
5. אחזקה של זנים חיידקיים ומצבי תרבות
- לשמור על מלאי גליצרול ממושבה אחת של חיידקים כמו 1 מ ל של תרבות חיידקית רווי 333 μL של סטרילי 80% גליצרול ב-80 ° c.
- חיידקים תיקון (כלומר, PstT1) מתוך מלאי גליצרול על KB אגר עם אנטיביוטיקה המתאימה (סעיף 4).
- לאפשר לחיידקים להתאושש 2 ימים ב 28 ° צ' לפני שיורד חיידקים טריים על KB בררני אגר באמצעות קיסם שטוח, סטרילי.
- רצף חיידקים טריים מן המניה גליצרול על המתאים KB אגר מתאים באמצעות קיסם שטוח, סטרילי.
הערה: להבטיח כי מלאי הגליצרול תוקנו הוא לא יותר מ 2 שבועות. - עבור PstDC3000, מודקת את הצלחת KB ב 28 ° צ' עבור 24 שעות לפני שימוש בחיידקים בניסוי המבול.
- עבור PstT1, מודקת לוחית KB ב 28 ° c עבור 48 h לפני שימוש בחיידקים בניסוי המבול.
6. הכנת ה- PstT1 לרשת
- מחדש את החיידקים בניקוי 10 מ"מ MgCl2 כדי צפיפות אופטית ב 600 NM (OD600) של 0.1, או כ 5 x 10⁷ המושבה היוצרים יחידות (cfu)/ml).
- בצע דילול סדרתי באמצעות פתרון 10 מ"מ MgCl סטרילי2 בארון בטיחות. עבור PstT1, השתמש בספקטרוסקופיה כדי להפוך את השימוש עם ריכוז התחלתי של OD600 = 0.1.
- עבור PstT1, להפוך 1/10 דילול מחדש הבולם הראשוני ב-od600 = 0.1 כדי לקבל דילול סדרתי בריכוז של OD600 = 0.01.
- באמצעות הדילול הסדרתי ב-OD600 = 0.01 משלב 6.3, לבצע דילול 3/4 כדי להשיג OD הסופי600 = 0.0075.
- הפוך 1/10 דילול של שאינו יונית אורגנוסטנט בלתי-יוניים קופולימר C13H34O4Si3 (כלומר, חומרים פעילי שטח) ב 10 מ"מ mgcl2 ו מערבולת עבור 15 s. להוסיף את המניה 1/10 של הדילול הסדרתי האחרון (OD600 = 0.0075) לריכוז הסופי של 0.015% ו מערבולת היטב לערבב
7. הכנת הDC3000 של Pst
- השעיית חיידקים מחדש ב-10 מ"מ MgCl2 לדחיסות אופטית ב 600 ננומטר (OD600) של 0.1 (כ 5 x 10⁷ cfu/mL).
- בצע דילול סדרתי באמצעות פתרון 10 מ"מ MgCl סטרילי2 בארון בטיחות. עבור PstDC3000, השתמש בספקטרוסקופיה כדי להפוך את השימוש עם ריכוז התחלתי של OD600 = 0.1.
- עבור PstDC3000, לעשות דילול 1/10 מ ההשעיה הראשונית ב od600 = 0.1 כדי לקבל דילול סדרתי בריכוז של OD600 = 0.01.
- באמצעות הדילול הסדרתי ב-OD600 = 0.01 משלב 3, הפוך 1/2 דילול כדי לקבל OD הסופי600 = 0.005.
- הפוך 1/10 דילול של החומרים ב-10 מ"מ MgCl2 ו מערבולת עבור 15 s. להוסיף את מלאי 1/10 של החומרים הסופיים לדילול הסדרתי האחרון (OD600 = 0.005) לריכוז הסופי של 0.015% ו מערבולת היטב לערבב.
8. שתיל עגבניות שיטפון שיטה
- קחו את הצלחות עם שתילי בן 10 ימים מתוך חדר הגידול והכניסו את הקבינט הביובטילי להכנת הצלחות להצפה.
- הסר את הקלטת הכירורגית משתי צלחות.
- הגדר שעון עצר עבור 3 דקות. מידה 6 מ ל של האינווניאה הסופי (pstT1 od600 = 0.0075 [סעיף 6] או pstDC3000 OD600 = 0.005 [סעיף 7]) ולהעביר 6 מ ל של הרשת על כל צלחת עם שתילים בן 10 ימים.
- דחפו בעדינות את השתילים לתוך האינוצינה עם קצה של פיפטה סטרילי. . הפעל את שעון העצר
- החזיקו צלחת אחת בכל יד. להטות את החלק הקדמי של הצלחת להצטבר לצבור ובעיקר להטביע את פסיגי ועלים של השתילים.
- סוויש מצד לצד 5 – 7x ולאחר מכן טיפ לוחיות בחזרה כדי לכסות את השורשים ואת הצלחת כולה.
- להטות את הצלחות שוב כדי להטביע את פסיגי ועלים, ולחזור על סך של 3 דקות.
- מזוג את הלוחות על פני הצלחות, הגדר את הצלחות על משטח שטוח ולאחר מכן שופכים את כל שרידי הרשת בפעם השנייה.
- ארוז מחדש את הצלחות בסרט כירורגי וחזור על שלבים 8.2 – 8.8 עבור כל הלוחות הנותרים.
- מחדש את הצלחות בחדר הגידול (ראה שלב 3.11 הערה) לאחר כל הצלחות הוצף.
- פניטיפ לאחר 7 – 10 ימים עבור pstDC3000 או 10 – 14 ימים עבור pstT1 (סעיף 11). אם ביצוע הצמיחה בקטריאלי הגידול, לאסוף את רקמת העלה לאחר 4 ימים (סעיפים 9 ו 10) ולאחר מכן פניטיפ (סעיף 11). לחילופין, לבצע ניתוח פנוטימית וגידול חיידקי על קבוצות נפרדות של צמחים.
9. משטח עיקור של פסיגי עבור שיטת גדילה בקטריאלי
- ארבעה ימים לאחר ההצפה ומחדש את השתילים בחדר הגידול (סעיף 8), להסיר את הצלחות עם שתילי עגבניות מחדר הגידול.
- מספר שתילים בודדים בחלק התחתון החיצוני של הצלחת שבו שתיל מתחבר לצלחת עבור כל גנוטיפ.
- התווית סטרילי 1.5 mL שפופרות מיקרוצנטריפוגה עם מספרי שתיל בודדים להשתמש מלקחיים נקי לרדת אחד 3 מ"מ בורוכוב סטרילי חרוז לתוך צינור כל לשימוש עם מקצף חרוז. (ראה הערה בשלב 10.1).
- פיפטה 200 μL של 10 מ"מ MgCl2 לתוך כל צינור ולסגור צינורות.
- הכינו 70% אתנול ויוצקים 100 mL לתוך גביע נקי. יוצקים 100 מ ל של H באלקטרופורזה טהור2O לתוך גביע נפרד, נקי.
- נקי נירוסטה ישר בסדר מלקחיים עם טיפים משונן עם אתנול. פתח את הצלחת מעט כדי לאפשר הסרת ספיגה של cotyledon אחד עם מלקחיים נקיים.
- לצבוט את הפטוטרת בבסיס של cotyledon כדי להסיר עלה ולשחרר לתוך הגביע עם 70% אתנול לפני השטח-לחטא עבור 10 s. לשטוף את cotyledon ב בדיקת H2O טהור עבור 10 s.
- מניחים את הפחם על מגבת נייר וכתמי יבש עם מגבונים עדינים למדע.
- שוקלים באופן אינדיבידואלי כל cotyledon לאחר משטח עיקור וסירוס, ולהקליט את המשקל.
- מניחים את cotyledon ב הכין בעבר 1.5 mL שפופרת מיקרוצנטריפוגה (מתוך שלבים 9.3 ו 9.4) מתויג עם גנוטיפ המקביל מספר בודד.
- לחתום מחדש את הצלחות עם הקלטת סטרילי ולשחזר את השתילים בחדר הגידול (ראה שלב 3.11 הערה).
10. שיטת הגדילה החיידקית
- שימוש בדגימות משלב 9.10, הומוגון את הרקמה באמצעות מקצף חרוז ב 10 מ"מ MgCl2 עבור 1 – 2 דקות. , אם הרקמה לא הושמדה כראוי. הומוגון שוב
הערה: יצרנים רבים לייצר מקצף חרוז הומוזים. המספר והסוג של החרוזים, כמו גם את הזמן ואת המהירות של המגון (אם ניתן לתיכנות) צריך להיות מותאם עבור כל סוג של הומוגניצר. ודא כי הדגימות לא להתחמם יותר במהלך הומוגון. - הוסף 800 μL של 10 מ"מ MgCl2 לכל צינורית המכילה רקמה ממגמטת משלב 10.1 ולהפוך מספר פעמים כדי לערבב.
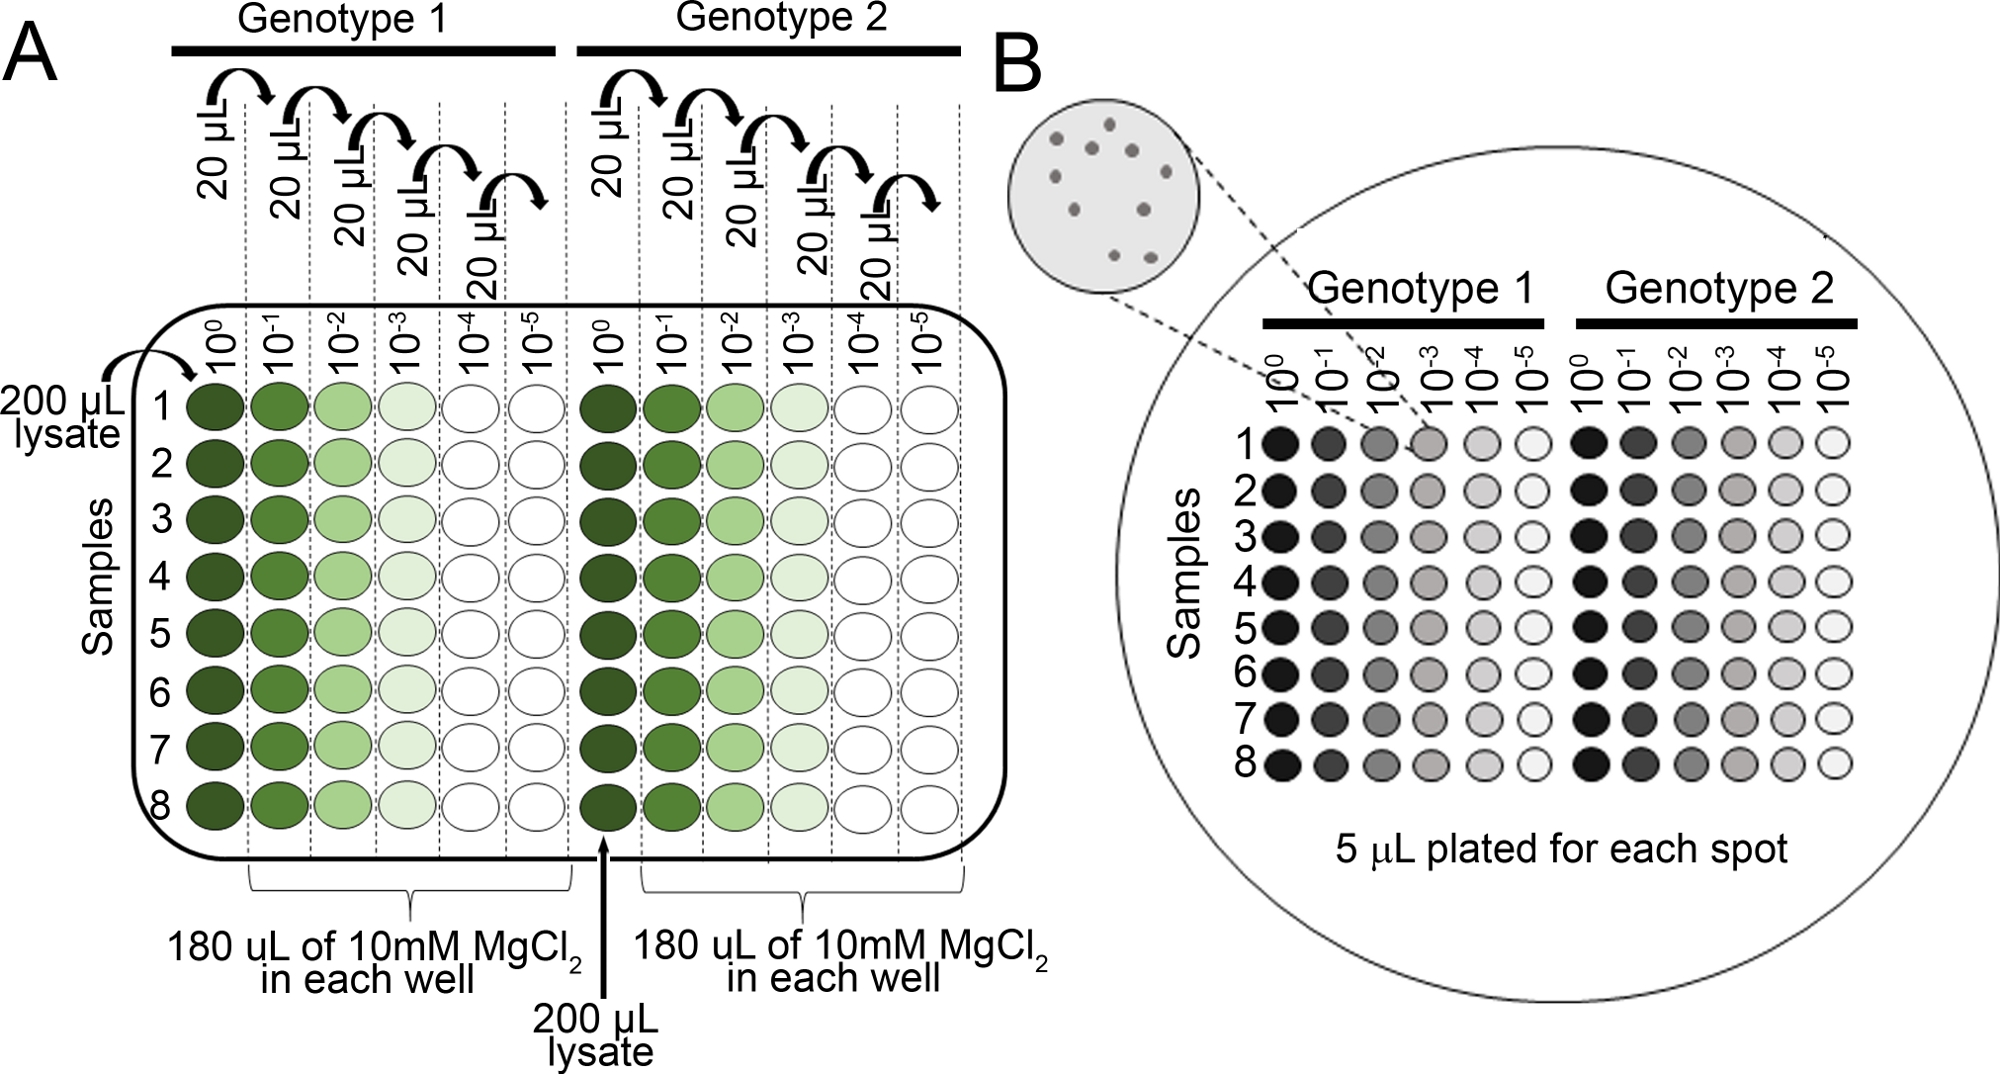
- הכנת מדלל סדרתי עבור כל מדגם ב 10 מ"מ MgCl2 ב 96 בצלחת (100, 10-1, 10-2, 10-3, 10-4, 10-5) באמצעות פיפטה רב-ערוצי (איור 2א).
- פיפטה 5 μL מכל סדרת דילול באמצעות פיפטה רב-ערוצית על צלחת אגר KB (150 מ"מ x 15 מ"מ) עם cycloheximide והבחירה המתאימה למאמץ החיידקי של הריבית (ראה שלב 4.8 הערה). . תן לצלחות להתייבש לגמרי
- מודקת את הצלחת למטה ב 28 ° צ' עבור 36 h, לאחר מכן הדמיה (איור 2ב) המושבות על הלוחות באמצעות מיקרוסקופ מבתר כדי לקבוע אם המושבות גדולות מספיק כדי לספור.
הערה: אם המושבות אינן גדולות מספיק, הפעל מחדש את הצלחות ובדוק שוב את גודל המושבות כל כמה שעות. בדרך כלל, המושבות הם קבוצה בת ~ 36 – 48 h לאחר הדגירה.

איור 2: דילול סדרתי עבור שתיל הצמיחה חיידקים assays. (א) רקמת עלה משופל מצמחים נגועים מדולל לפני ספירת המושבה. דילול מתבצעים בצלחת 96 (100 הוא ללא מדולל). בדרך כלל, הדילול מתבצע. מ -10-1 עד 10-5 (ב) מדלל ציפוי למושבה חיידקית. סך של 5 μL של כל עמודה של סדרת הדילול מצופה, מ לדלל ביותר מרוכז ביותר. לאחר המושבות התייבשו לחלוטין, הצלחת הוא מודב 28 ° c עבור 36 – 48 h. המושבות נספרות תחת מיקרוסקופ 10x מבתר. אנא לחץ כאן כדי להציג גירסה גדולה יותר של איור זה.
- לספור את המושבות תחת מיקרוסקופ מבתר לפני שהם מתמזגים (איור 2ב). לספור את המושבות מצלחות סדרת הדילול עם פחות מ 100 מושבות.
- לאחר קבלת ספירות המושבה (איור 2B), לנרמל את ספירות 0.01 g של רקמת השתילים ולהמיר את הצמיחה חיידקים (שולחן 1).
הערה: המסה הממוצעת של הmoneymaker-Ptos cotyledon היא 0.01 g והיא נחושה ביותר22.
| עמודה מסוג ' גנוטיפ1 ' | משקל רקמה (ז) עמודה ב' | . של מושבות במקום מתחת לטור C | פקטור דילול עבור מקום2 עמודה D | מותאם למושבותשלוש עמודות E | פקטור דילול עבור דילול סדרתי עמודה F | סה כ המושבות טור G (cfu/0.01 G)4 | ממוצע של המושבות (cfu/0.01 גרם) עמודה H | טור ממוצע הצמיחה (cfu/0.01 g (יומן רישום10)) עמודה I |
| לדוגמה 1 | 0.004 גרם | 10 | 200 | מחושב כ: (C2 x 0.01 g)/B2 = 25 | 1000 | מחושב כ: (D2 x E2 x F2) = 5000000 | ממוצע לדוגמה 1 עד המדגם האחרון: (כלומר ממוצע G1: G3) = 7000000 | יומן של הממוצע כלומר. log (H2) = 6.85 |
| לדוגמה 2 | 0.003 גרם | 15 | 200 | 50 | 1000 | 10000000 | ||
| לדוגמה 3 | 0.002 גרם | 6 | 200 | 30 | 1000 | 6000000 | ||
| מיכל בן נתונים המוצגים עבור 3 דגימות | ||||||||
| מיכל השני מבוסס על ציפוי 5 μL x 200 עבור 1 mL | ||||||||
| מיכל שלוש Cotyledons הם קטנים מדי כדי ליבה ספירות המושבה היו מנורמל 0.01 גרם של רקמות מבוסס על המסה הממוצעת של אחד מכונת MoneyMaker-PtoS cotyledons (הנתונים לא מוצגים) | ||||||||
| ד מותאם ל-mL מבוסס על נפח מצופה | ||||||||
טבלה 1: חישובי לדוגמה לצורך שתיל בקטריאלי הגידול. חישובי דוגמה מדגימים כיצד לנרמל ספירות חיידקי ולקבוע את הגדילה החיידקית של יומן הרישום.
- עבור לקות בר וקווים אחרים עם רקע גנטי מורכב, לתאם את רמת הצמיחה חיידקי בשתילים בודדים עם פנוטיפ שלהם כמתואר בסעיף 11.
11. פנוטיפים להתנגדות
- הסר את לוחיות מחדר הצמיחה ושתילים בודדים פנוטיפ למוות (עקב מחלה) או הישרדות (בשל התנגדות) לאחר 7 – 14 ימים.
- צמחים פנוטיפ נגועים בנבג מאוד מזוהם כגון PstDC3000 מוקדם יותר, ב -7 – 10 ימים לאחר המבול.
- צמחים פנוטיפ נגוע PstT1 בשעה 10 – 14 ימים לאחר המבול.
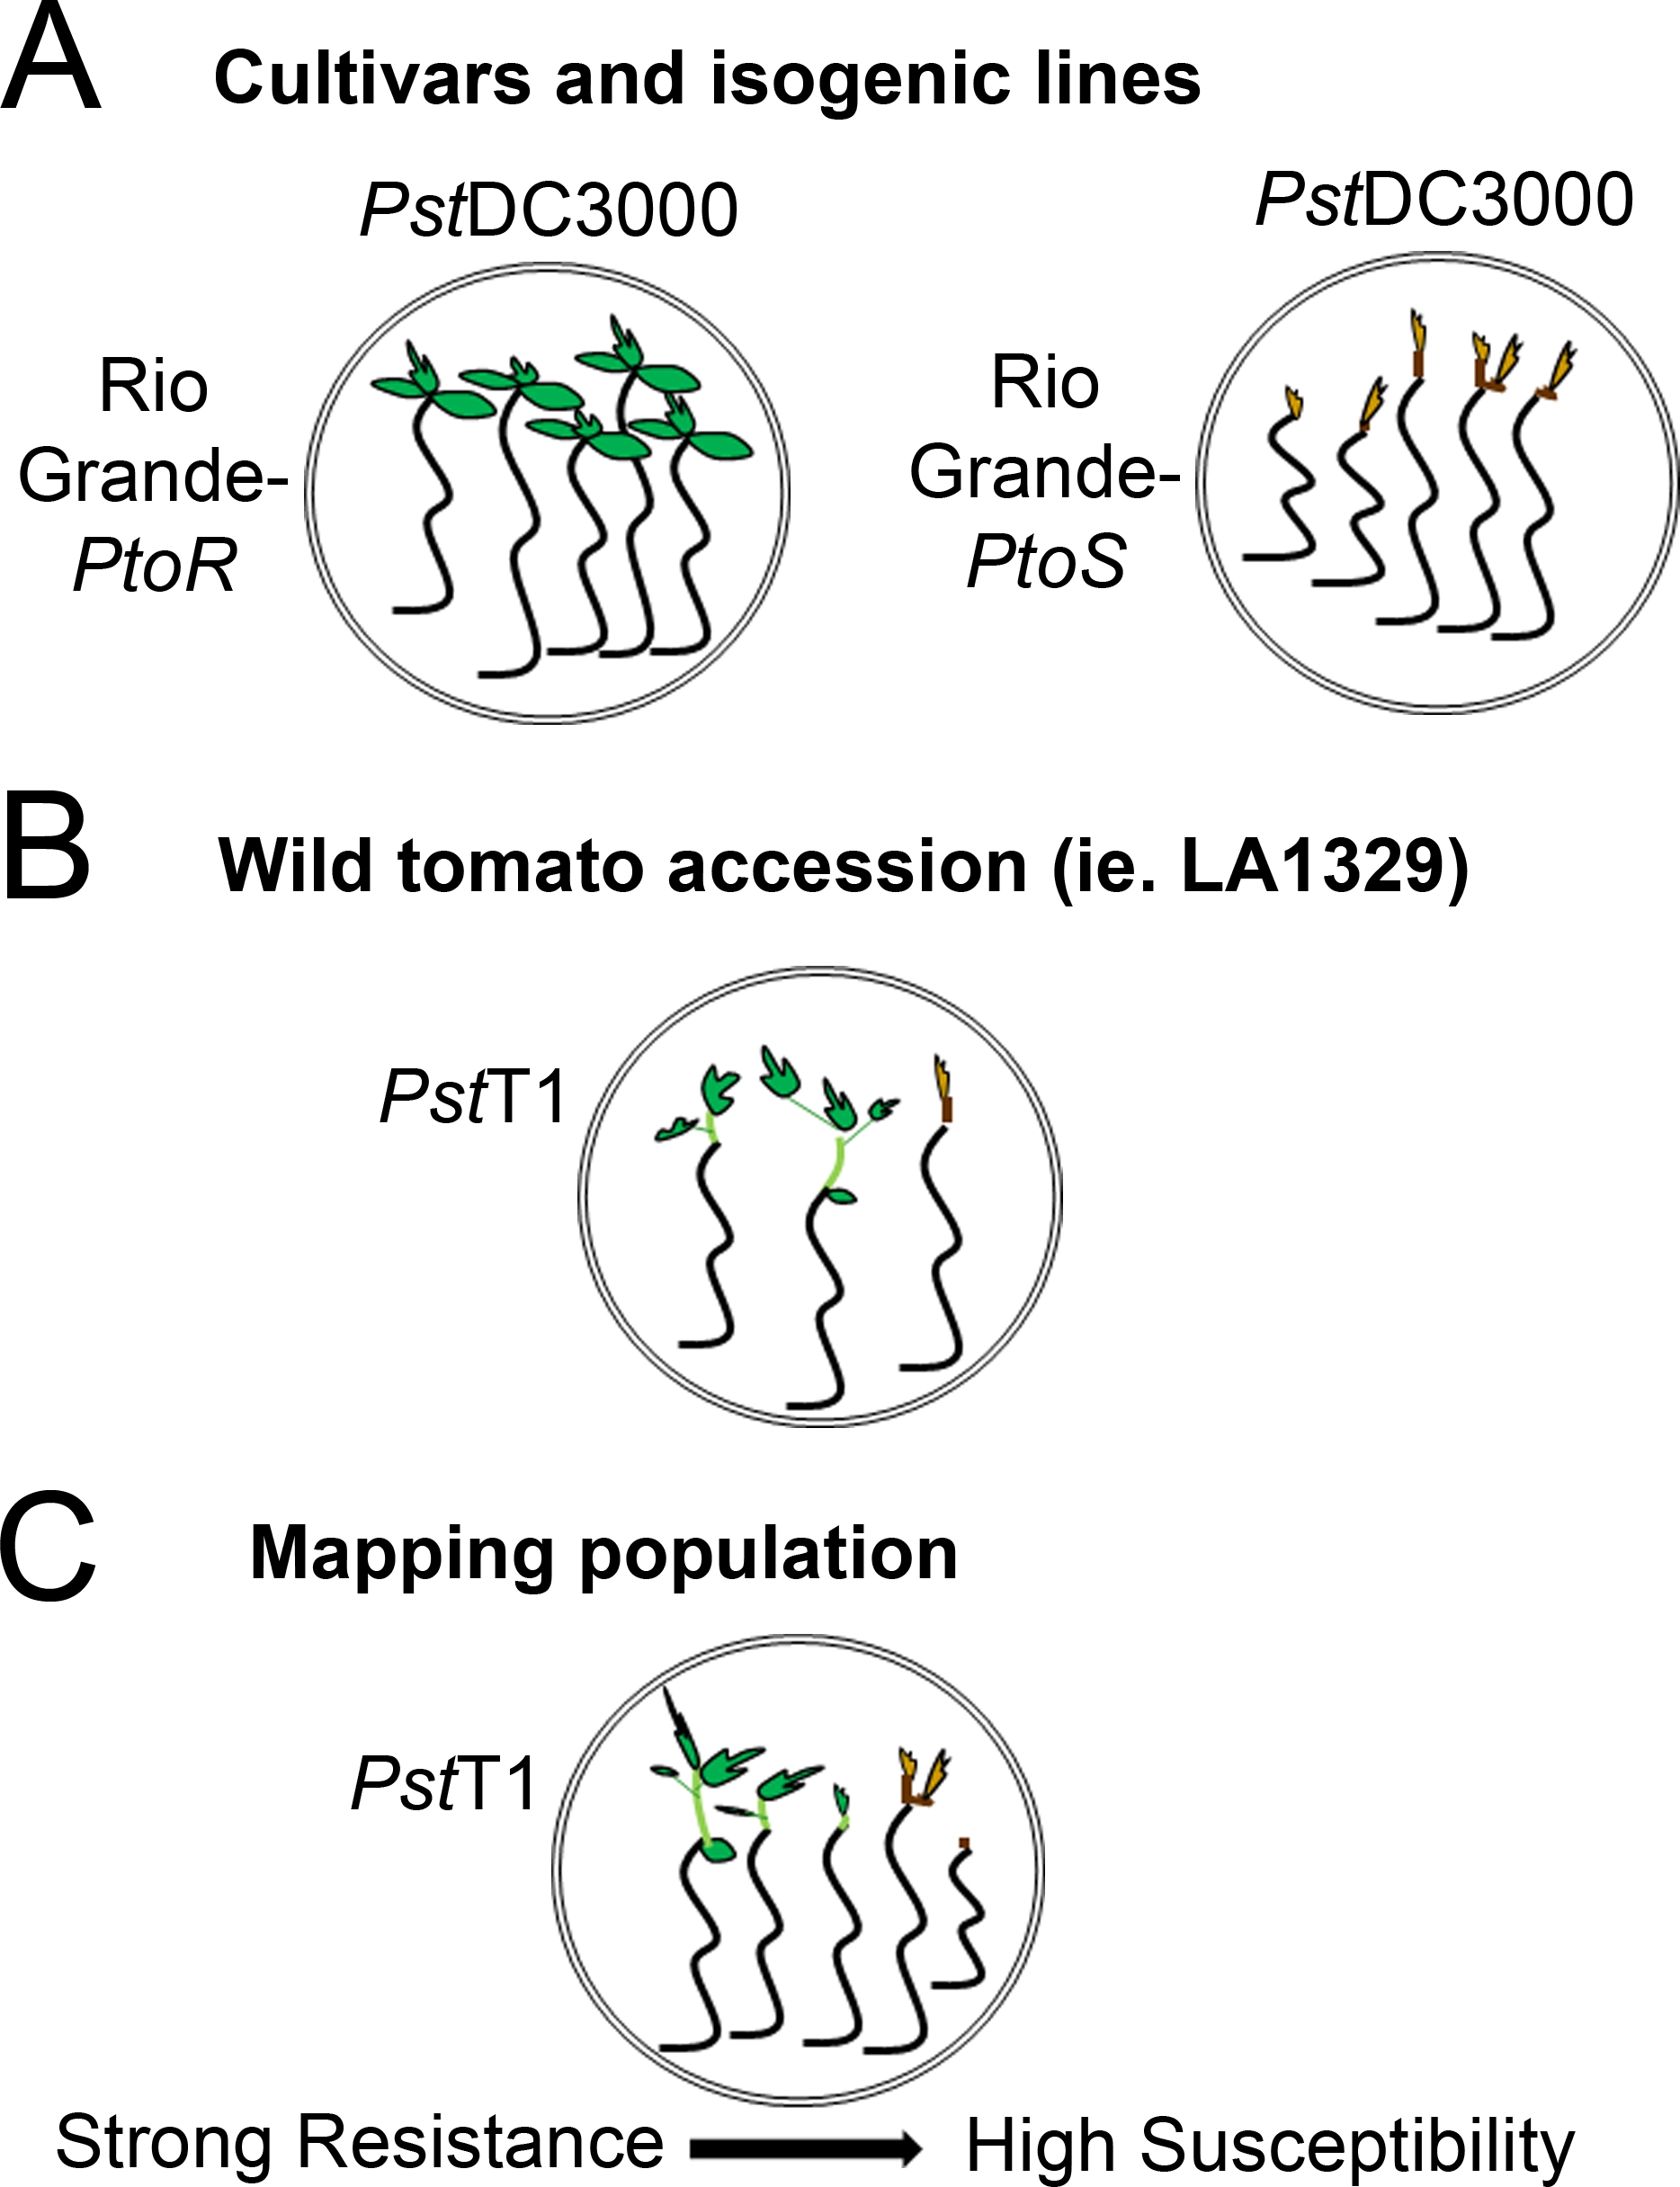
- לקבוע מערכת הבקיע מבוסס על מגוון של פנוטיפים ההתנגדות נצפתה. הקלטת פנוטיפים בינאריים לזנים, קווים איזוגניים, והתמדה בחיות עם פנוטיפים עקביים ובינוניים בעלי עמידות ביניים (איור 4א, 4b).
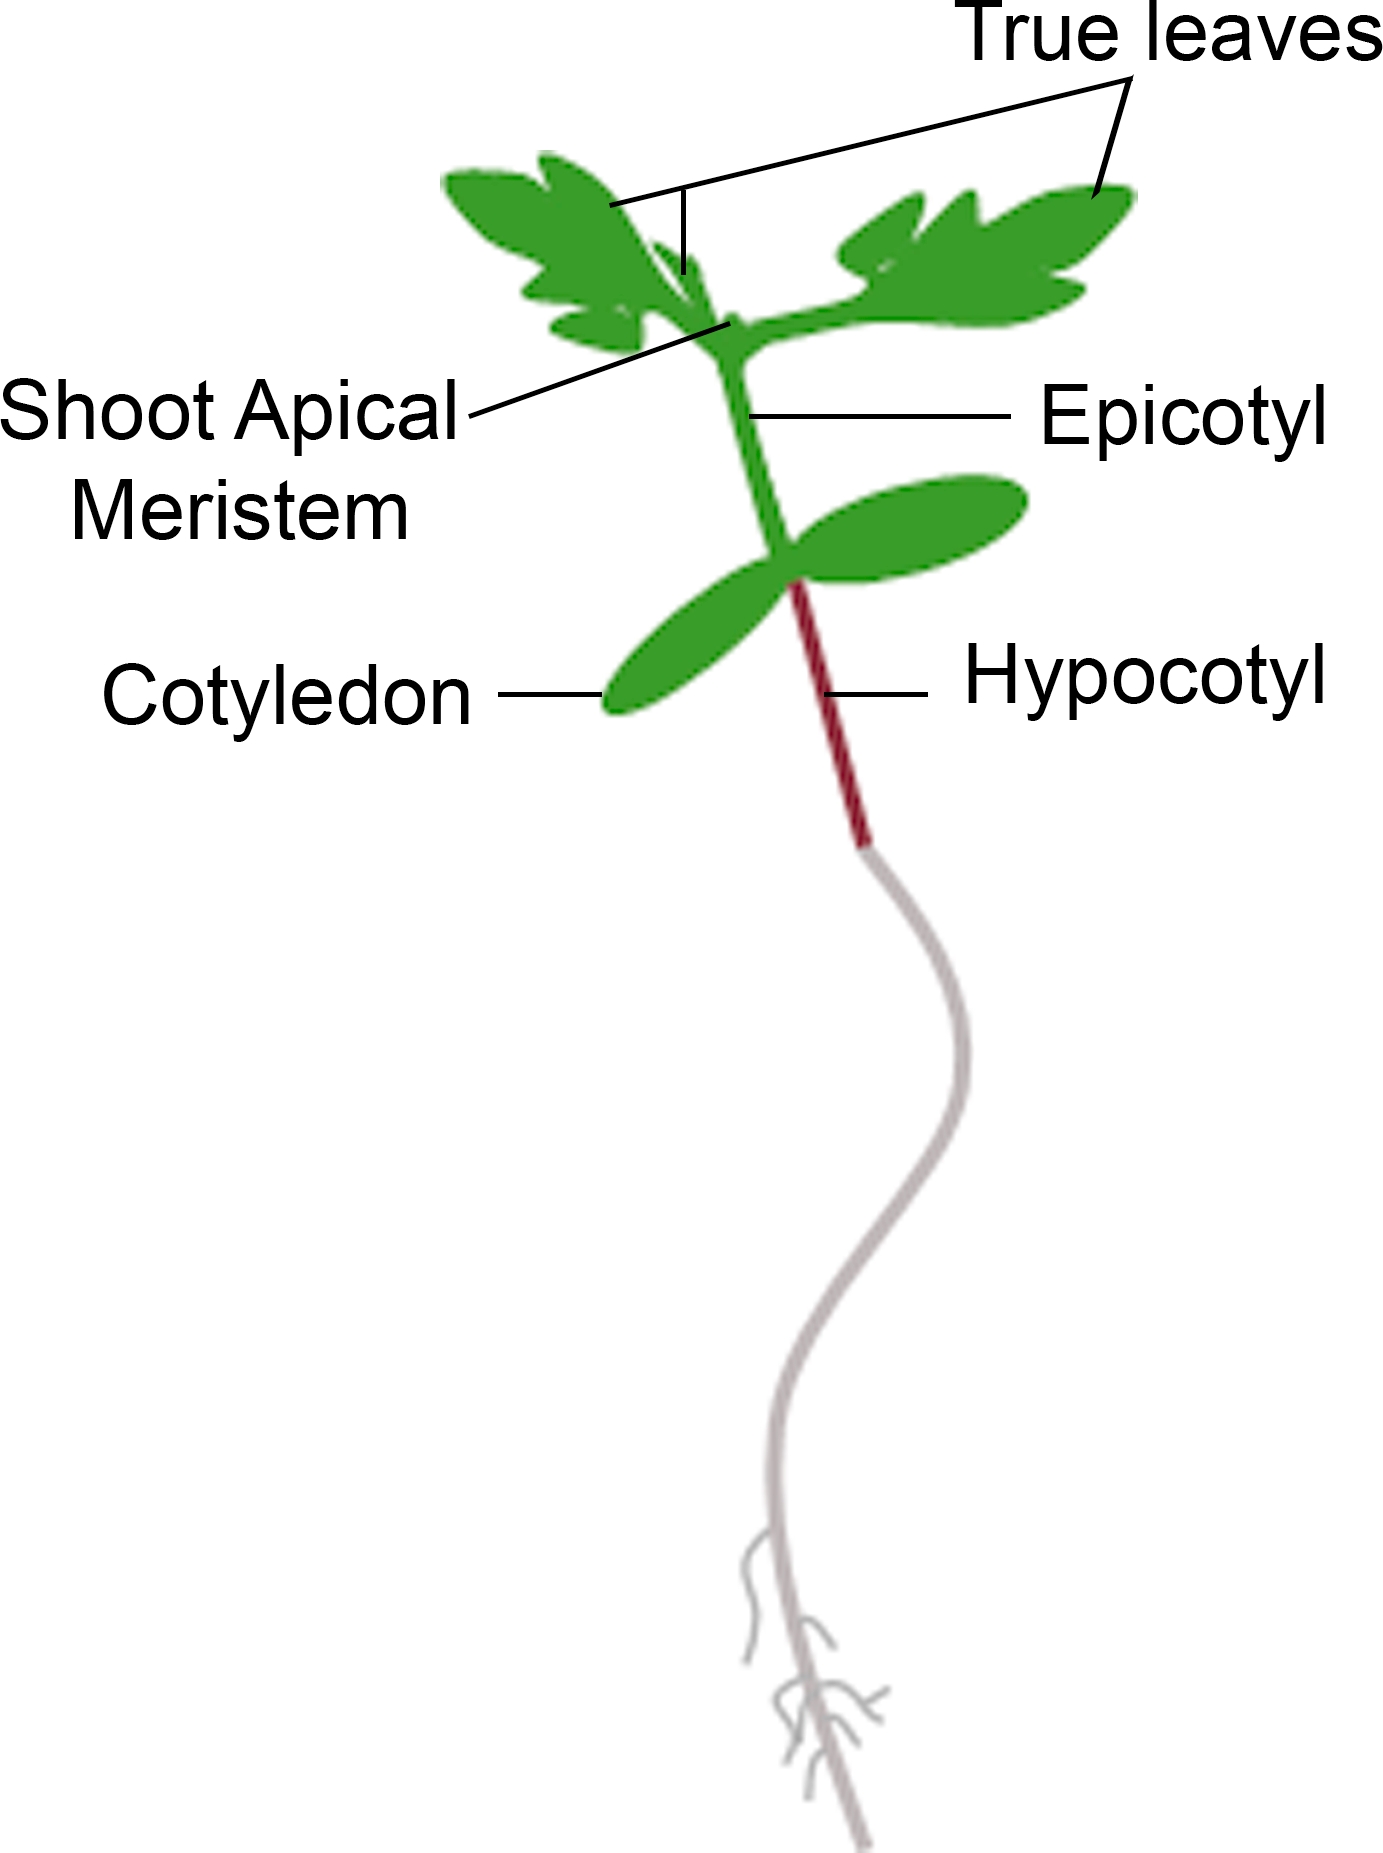
- אם שתיל מציג צמיחה חדשה של מריאיית פסגה בתוך מסגרת הזמן לפנוטיפים, לספור אותו כהישרדות. אם שתיל יש פסגה החום מריאמת ומציג לא חדש, צמיחה וגטטיבי ירוק, לספור אותו כמוות (איור 3).

איור 3: ייצוג סכמטי של שתיל עגבניות. חלקים שונים של שתיל עגבניות מתוארים, כולל היפוקטיל, cotyledons, אפיטיל, לירות מריאיונים הרשמי, ועלים אמיתיים. אנא לחץ כאן כדי להציג גירסה גדולה יותר של איור זה.
- פנוטיפים לתקליטים בספקטרום מחלות לאוכלוסיות, כגון מיפוי של האוכלוסיות F2, עם מגוון רחב של פנוטיפים להתנגדות (איור 4ג).
- בזהירות לפקח על השתילים על המראה של תסמיני המחלה ואת המוות כדי לזהות את החלון המתאים לפנוטיפים.

איור 4: ייצוג סכמטי של פנוטיפים צפויים עבור שתיל התנגדות ומוות ברקעים גנטיים שונים. (א) שתילים של ריו גראנדה-ptor ואת הזנים הכמעט-איזוגניים ריו גראנדה-ptor מוצגים 7 ימים לאחר ההצפה עם PstDC3000 (OD600 = 0.005) + 0.015% מחומרים. ריו גראנדה-Ptor מציג התנגדות עקבית, ו ריו גראנדה-ptor מציג רגישות עקבית לזיהום עם PstDC3000. קווים אלה מעניקים פנוטיפים נפרדים ובינאריים. (ב) שתילים של הצטרפות פראי, כגון solanum neorickii LA1329, מוצגים 10 ימים לאחר הצפה עם PstT1 (OD600 = 0.0075) + 0.015% הגולש. שתילים מציגים שינויים פנוטיפים אך נרשמו כפנוטיפים בינאריים. כמות ההבדלים פנוטיפים ושיטת פנוטיפים (התנגדות בינארית או ספקטרום ההתנגדות) יהיה תלוי בהצטרפות המסוימת שנבדקה. (ג) מיפוי אוכלוסיות שנוצרו על ידי מעבר הגבול פראי לזנים רגישים עשויים להציג ספקטרום רחב יותר של פנוטיפים ב-F2 פנקסי אוכלוסיות. במקרה זה, זה עשוי להיות מתאים ביותר להקליט פנוטיפים שתיל בספקטרום. שתילים רגישים מאוד מאוכלוסיית המיפוי עשוי להיות פנומן למוות מוקדם ככל היום 7 כאשר מוצף ב- PstT1, ובדרך כלל להראות מריאפית חום פסגה, לא להרחבה מעט מאוד של האפיטיל, ו לא חדש, וגטטיבי ירוק הצמיחה. מריאם פסגה של שתילים רגישים יכול להישאר ירוק או חום מאוד בהיר לזמן רב יותר, ואולי יש כמה הרחבה של האפיטיל וצמיחה וגטטיבי מעט מאוד, אשר הופך חום ומעצרים על ידי יום 10. שתילים בודדים יכולים להיות פנויקליד עבור התנגדות מבוסס על כמות צמיחה וגטטיבי חדש ומתמשך על ידי יום 14. לאחר מכן ניתן לקבץ את השתילים לפי הפנוטיפים המתוארים לעיל לקטגוריות שונות של התנגדות כגון התנגדות חלשה, בינונית או חזקה. אנא לחץ כאן כדי להציג גירסה גדולה יותר של איור זה.
Access restricted. Please log in or start a trial to view this content.
תוצאות
זיהוי של החסינות Ptor-תיווך בזנים וקווים איזוגניים באמצעות התנגדות שתיל העמידות
איור 5 מציג את התוצאות הייצוגיות עבור Moneymaker-Ptor ו Moneymaker-ptor זנים ars 7 – 10 ימים לאחר ההצפה עם PstDC3000. לפני זיהום, 10 יום-שתילים הציגו במלואו התפתחה פסיגי והמתעוררים עלים אמ...
Access restricted. Please log in or start a trial to view this content.
Discussion
פרוטוקול עבור המבול החיסון עם pstDC3000 או pstT1 אופטימיזציה כדי לזהות עמידות אלה זנים חיידקיים בשתילים עגבניות מתוארת. ישנם מספר פרמטרים קריטיים לקבלת תוצאות מיטביות של התנגדות שתיל, כולל ריכוז חיידקי וריכוז החומרים, אשר נקבעו באמצעות מדעית22. עבור PstDC3000, הצפיפות האו?...
Access restricted. Please log in or start a trial to view this content.
Disclosures
. למחברים אין מה לגלות
Acknowledgements
אנו מודים לג Calma על בדיקת ההשפעה של עוצמת המדיה על המחלה או תוצאות ההתנגדות. אנו מודים לד ר מייסר באודין וד ר קרל שייבר ממעבדת לואיס למתן הערות והצעות בונות על כתב היד. מחקר על חסינות הצמח במעבדה לואיס היה נתמך על ידי משרד החקלאות בשנת 2030-21000-046-00D ו-2030-21000-050-00D (JDL), ואת מינהל NSF למדעי הביולוגיה IOS-1557661 (JDL).
Access restricted. Please log in or start a trial to view this content.
Materials
| Name | Company | Catalog Number | Comments |
| 3M Tape Micropore 1/2" x 10 YD CS 240 (1.25 cm x 9.1 m) | VWR International | 56222-182 | |
| 3mm borosilicate glass beads | Friedrich & Dimmock | GB3000B | |
| Bacto peptone | BD | 211677 | |
| Bacto agar | BD | 214010 | |
| Biophotometer Plus | Eppendorf | E952000006 | |
| Biosafety cabinet, class II type A2 | |||
| BRAND Disposable Plastic Cuvettes, Polystyrene | VWR International | 47744-642 | |
| Chenille Kraft Flat Wood Toothpicks | VWR International | 500029-808 | |
| cycloheximide | Research Products International | C81040-5.0 | |
| Dibasic potassium phosphate anhydrous, ACS grade | Fisher Scientific | P288-500 | |
| Dimethylformamide | |||
| Dissecting microscope (Magnification of at least 10x) | |||
| Ethanol - 190 Proof | |||
| Falcon polystyrene 96 well microplates, flat-bottom | Fisher Scientific | 08-772-3 | |
| Glass Alcohol Burner Wick | Fisher Scientific | S41898A / No. W-125 | |
| Glass Alcohol Burners | Fisher Scientific | S41898 / No. BO125 | |
| Glycerol ACS reagent | VWR International | EMGX0185-5 | |
| Kimberly-Clark™ Kimtech Science™ Kimwipes™ Delicate Task Wipers | Fisher Scientific | 06-666-A | |
| Magnesium chloride, ACS grade | VWR International | 97061-356 | |
| Magnesium sulfate heptahydrate, ACS grade | VWR International | 97062-130 | |
| Microcentrifuge tubes, 1.5 mL | |||
| Microcentrifuge tubes, 2.2 mL | |||
| Mini Beadbeater-96, 115 volt | Bio Spec Products Inc. | 1001 | |
| Murashige & Skoog, Basal Salts | Caisson Laboratories, Inc. | MSP01-50LT | |
| Pipet-Lite XLS LTS 8-CH Pipet 20-200uL | Rainin | L8-200XLS | |
| Pipet-Lite XLS LTS 8-CH Pipet 2-20uL | Rainin | L8-20XLS | |
| Polystyrene 100mm x 25mm sterile petri dish | VWR International | 89107-632 | |
| Polystyrene 150mm x 15mm sterile petri dish | Fisher Scientific | FB08-757-14 | |
| Polystyrene 150x15mm sterile petri dish | Fisher Scientific | 08-757-148 | |
| Pure Bright Germicidal Ultra Bleach 5.7% Available Chlorine (defined as 100% bleach) | Staples | 1013131 | |
| Rifampicin | Gold Biotechnology | R-120-25 | |
| Silwet L-77 (non-ionic organosilicone surfactant co-polymer C13H34O4Si3 surfactant) | Fisher Scientific | NCO138454 | |
| Tips LTS 20 μL 960/10 GPS-L10 | Rainin | 17005091 | |
| Tips LTS 250 μL 960/10 GPS-L250 | Rainin | 17005093 | |
| VWR dissecting forceps fine tip, 4.5" | VWR International | 82027-386 |
References
- Underwood, W., Melotto, M., He, S. Y. Role of plant stomata in bacterial invasion. Cell Microbiology. 9 (7), 1621-1629 (2007).
- Zipfel, C. Early molecular events in PAMP-triggered immunity. Current Opinion in Plant Biology. 12 (4), 414-420 (2009).
- Galan, J. E., Wolf-Watz, H. Protein delivery into eukaryotic cells by type III secretion machines. Nature. 444 (7119), 567-573 (2006).
- Lewis, J. D., Desveaux, D., Guttman, D. S. The targeting of plant cellular systems by injected type III effector proteins. Seminars in Cell and Developmental Biology. 20 (9), 1055-1063 (2009).
- Schreiber, K. J., Baudin, M., Hassan, J. A., Lewis, J. D. Die another day: molecular mechanisms of effector-triggered immunity elicited by type III secreted effector proteins. Seminars in Cell and Developmental Biology. 56, 124-133 (2016).
- Heath, M. C. Hypersensitive response-related death. Plant Molecular Biology. 44 (3), 321-334 (2000).
- Boyd, L. A., Ridout, C., O'Sullivan, D. M., Leach, J. E., Leung, H. Plant-pathogen interactions: disease resistance in modern agriculture. Trends in Genetics. 29 (4), 233-240 (2013).
- Pitblado, R. E., MacNeill, B. H. Genetic basis of resistance to Pseudomonas syringae pv. tomato in field tomatoes. Canadian Journal of Plant Pathology. 5 (4), 251-255 (1983).
- Pedley, K. F., Martin, G. B. Molecular basis of Pto-mediated resistance to bacterial speck disease in tomato. Annual Reviews of Phytopathology. 41, 215-243 (2003).
- Ronald, P. C., Salmeron, J. M., Carland, F. M., Mehta, A. Y., Staskawicz, B. J. The cloned avirulence gene AvrPto induces disease resistance in tomato cultivars containing the Pto resistance gene. Journal of Bacteriology. 174 (5), 1604-1611 (1992).
- Martin, G. B., et al. Map-based cloning of a protein kinase gene conferring disease resistance in tomato. Science. 262 (5138), 1432-1436 (1993).
- Salmeron, J. M., Barker, S. J., Carland, F. M., Mehta, A. Y., Staskawicz, B. J. Tomato mutants altered in bacterial disease resistance provide evidence for a new locus controlling pathogen recognition. Plant Cell. 6 (4), 511-520 (1994).
- Salmeron, J. M., et al. Tomato Prf is a member of the leucine-rich repeat class of plant disease resistance genes and lies embedded within the Pto kinase gene cluster. Cell. 86 (1), 123-133 (1996).
- Scofield, S. R., et al. Molecular basis of gene-for-gene specificity in bacterial speck disease of tomato. Science. 274 (5295), 2063-2065 (1996).
- Kunkeaw, S., Tan, S., Coaker, G. Molecular and evolutionary analyses of Pseudomonas syringae pv. tomato race 1. Molecular Plant-Microbe Interactions. 23 (4), 415-424 (2010).
- Cai, R., et al. The plant pathogen Pseudomonas syringae pv. tomato is genetically monomorphic and under strong selection to evade tomato immunity. PLoS Pathogens. 7 (8), 1002130(2011).
- Almeida, N. F., et al. A draft genome sequence of Pseudomonas syringae pv. tomato T1 reveals a type III effector repertoire significantly divergent from that of Pseudomonas syringae pv. tomato DC3000. Molecular Plant-Microbe Interactions. 22 (1), 52-62 (2009).
- Lin, N. C., Abramovitch, R. B., Kim, Y. J., Martin, G. B. Diverse AvrPtoB homologs from several Pseudomonas syringae pathovars elicit Pto-dependent resistance and have similar virulence activities. Applied and Environmental Microbiology. 72 (1), 702-712 (2006).
- Rose, L. E., Langley, C. H., Bernal, A. J., Michelmore, R. W. Natural variation in the Pto pathogen resistance gene within species of wild tomato (Lycopersicon). I. Functional analysis of Pto alleles. Genetics. 171 (1), 345-357 (2005).
- Thapa, S. P., Miyao, E. M., Davis, R. M., Coaker, G. Identification of QTLs controlling resistance to Pseudomonas syringae pv. tomato race 1 strains from the wild tomato Solanum habrochaites LA1777. Theoretical and Applied Genetics. 128 (4), 681-692 (2015).
- Bao, Z. L., et al. Identification of a candidate gene in Solanum habrochaites for resistance to a race 1 strain of Pseudomonas syringae pv. tomato. Plant Genome. 8 (3), 1-15 (2015).
- Hassan, J. A., Zhou, Y. J., Lewis, J. D. A rapid seedling resistance assay identifies wild tomato lines that are resistant to Pseudomonas syringae pv. tomato race 1. Molecular Plant-Microbe Interactions. 30 (9), 701-709 (2017).
- King, E. O., Ward, M. K., Raney, D. E. Two simple media for the demonstration of pyocyanin and fluorescin. Journal of Laboratory and Clinical Medicine. 44 (2), 301-307 (1954).
- Uppalapati, S. R., et al. Pathogenicity of Pseudomonas syringae pv. tomato on tomato seedlings: phenotypic and gene expression analyses of the virulence function of coronatine. Molecular Plant-Microbe Interactions. 21 (4), 383-395 (2008).
- Bhardwaj, V., Meier, S., Petersen, L. N., Ingle, R. A., Roden, L. C. Defence responses of Arabidopsis thaliana to infection by Pseudomonas syringae are regulated by the circadian clock. PLoS One. 6 (10), 26968(2011).
- Lu, H., McClung, C. R., Zhang, C. Tick tock: circadian regulation of plant innate immunity. Annual Review of Phytopathology. 55, 287-311 (2017).
- Wang, W., et al. Timing of plant immune responses by a central circadian regulator. Nature. 470 (7332), 110-114 (2011).
Access restricted. Please log in or start a trial to view this content.
Erratum
Formal Correction: Erratum: High-Throughput Identification of Resistance to Pseudomonas syringae pv. Tomato in Tomato using Seedling Flood Assay
Posted by JoVE Editors on 10/18/2023. Citeable Link.
An erratum was issued for: High-Throughput Identification of Resistance to Pseudomonas syringae pv. Tomato in Tomato using Seedling Flood Assay. The Introduction, Protocol, Representative Results and Discussion sections were updated.
The last paragraph of the Introduction section was updated from:
In the seedling flood assay described in this protocol, tomato seedlings are grown on Petri dishes of sterile Murashige and Skoog (MS) media for 10 days and then are flooded with an inoculum containing the bacteria of interest and a surfactant. Following flooding, seedlings can be quantitatively evaluated for disease resistance via bacterial growth assays. Additionally, seedling survival or death can act as a discrete resistance or disease phenotype 7–14 days after flooding. This approach offers a high-throughput alternative for screening large numbers of wild tomato accessions for resistance to Pst race 1 strains, such as Pst strain T1 (PstT1), and can easily be adapted to other bacterial strains of interest.
to:
In the seedling flood assay described in this protocol, tomato seedlings are grown on Petri dishes of sterile Murashige and Skoog (MS) media for 10 days and then are flooded with an inoculum containing the bacteria of interest and a surfactant. Following flooding, seedlings can be quantitatively evaluated for disease resistance via bacterial growth assays. Additionally, seedling survival or death can act as a discrete resistance or disease phenotype 7–14 days after flooding. This approach offers a high-throughput alternative for screening large numbers of wild tomato accessions for resistance to Pst race 1 strains, such as Pst strain 19 (Pst19), and can easily be adapted to other bacterial strains of interest.
Step 4.8 of the Protocol section was updated from:
- After 1 h, transfer the bottle to the biosafety cabinet and under aseptic conditions, add 1,600 µL of sterile 1 M MgSO4, and appropriate antibiotics to the media.
NOTE: For rifampicin resistant strains PstDC3000 and PstT1, use rifampicin dissolved in dimethylformamide at a final concentration of 50 µg/mL. Use cycloheximide dissolved in ethanol at a final concentration of 50 µg/mL to prevent fungal growth on the plates.
to:
- After 1 h, transfer the bottle to the biosafety cabinet and under aseptic conditions, add 1,600 µL of sterile 1 M MgSO4, and appropriate antibiotics to the media.
NOTE: For rifampicin resistant strains PstDC3000 and Pst19, use rifampicin dissolved in dimethylformamide at a final concentration of 50 µg/mL. Use cycloheximide dissolved in ethanol at a final concentration of 50 µg/mL to prevent fungal growth on the plates.
Step 5.2 of the Protocol section was updated from:
- Patch bacteria (i.e., PstT1) from a glycerol stock onto KB agar with appropriate antibiotics (section 4).
to:
- Patch bacteria (i.e., Pst19) from a glycerol stock onto KB agar with appropriate antibiotics (section 4).
Step 5.6 of the Protocol section was updated from:
- For PstT1, incubate the KB plate at 28 ˚C for 48 h prior to using bacteria in the flood experiment.
to:
- For Pst19, incubate the KB plate at 28 ˚C for 48 h prior to using bacteria in the flood experiment.
Step 6 of the Protocol section was updated from:
6. Preparation of PstT1 inoculum
to
6. Preparation of Pst19 inoculum
Step 6.2 of the Protocol section was updated from:
- Perform serial dilutions using sterile 10 mM MgCl2 solution in the biosafety cabinet. For PstT1, use a spectrophotometer to make inoculum with a starting concentration of OD600 = 0.1.
to:
- Perform serial dilutions using sterile 10 mM MgCl2 solution in the biosafety cabinet. For Pst19, use a spectrophotometer to make inoculum with a starting concentration of OD600 = 0.1.
Step 6.3 of the Protocol section was updated from:
- For PstT1, make a 1/10 dilution from the initial resuspension at OD600 = 0.1 to obtain a serial dilution at a concentration of OD600 = 0.01.
to:
- For Pst19, make a 1/10 dilution from the initial resuspension at OD600 = 0.1 to obtain a serial dilution at a concentration of OD600 = 0.01.
Step 8.3 of the Protocol section was updated from:
- Set a timer for 3 min. Measure 6 mL of final inoculum (PstT1 OD600 = 0.0075 [section 6] or PstDC3000 OD600 = 0.005 [section 7]) and transfer 6 mL of inoculum to each plate with the 10-day-old seedlings.
to:
- Set a timer for 3 min. Measure 6 mL of final inoculum (Pst19 OD600 = 0.0075 [section 6] or PstDC3000 OD600 = 0.005 [section 7]) and transfer 6 mL of inoculum to each plate with the 10-day-old seedlings.
Step 8.11 of the Protocol section was updated from:
- Phenotype after 7–10 days for PstDC3000 or 10–14 days for PstT1 (section 11). If carrying out bacterial growth assays, collect leaf tissue after 4 days (sections 9 and 10) and then phenotype (section 11). Alternatively, perform phenotypic analysis and bacterial growth assays on separate sets of plants.
to:
- Phenotype after 7–10 days for PstDC3000 or 10–14 days for Pst19 (section 11). If carrying out bacterial growth assays, collect leaf tissue after 4 days (sections 9 and 10) and then phenotype (section 11). Alternatively, perform phenotypic analysis and bacterial growth assays on separate sets of plants.
Step 10.7 of the Protocol section was updated from:
- After obtaining colony counts (Figure 2B), normalize the counts to 0.01 g of tissue for seedlings and convert to log bacterial growth (Table 1).
NOTE: The average mass of one Moneymaker-PtoS cotyledon is 0.01 g and is empirically determined22.
| Genotype1 Column A | Tissue Weight (g) Column B | # of Colonies in a spot Column C | Dilution factor for spot2 Column D | Adjusted # of Colonies3 Column E | Dilution factor for serial dilution Column F | Total # of Colonies Column G (cfu/0.01 g)4 | Average # of Colonies (cfu/0.01 g) Column H | Average Log Growth (cfu/0.01 g (log10)) Column I |
| Sample 1 | 0.004 g | 10 | 200 | calculated as: (C2 x 0.01 g) / B2 = 25 | 1000 | calculated as: (D2 x E2 x F2) = 5000000 | average for sample 1 through last sample: (ie. average G1:G3) = 7000000 | log of average ie. log(H2) = 6.85 |
| Sample 2 | 0.003 g | 15 | 200 | 50 | 1000 | 10000000 | ||
| Sample 3 | 0.002 g | 6 | 200 | 30 | 1000 | 6000000 | ||
| 1Data shown for 3 samples | ||||||||
| 2Based on plating 5 µL x 200 for 1 mL | ||||||||
| 3Cotyledons are too small to core so colony counts were normalized to 0.01 g of tissue based on the average mass of one MoneyMaker-PtoS cotyledon (data not shown) | ||||||||
| 4Adjusted per mL based on volume plated | ||||||||
Table 1: Sample calculations for seedling bacterial growth assay. Sample calculations demonstrate how to normalize bacterial counts and determine log bacterial growth.
to:
- After obtaining colony counts (Figure 2B), normalize the counts to 0.1 g of tissue for seedlings and convert to log bacterial growth (Table 1).
NOTE: The average mass of one Moneymaker-PtoS cotyledon is 0.1 g and is empirically determined22.
| Genotype1 Column A | Tissue Weight (g) Column B | # of Colonies in a spot Column C | Dilution factor for spot2 Column D | Adjusted # of Colonies3 Column E | Dilution factor for serial dilution Column F | Total # of Colonies Column G (cfu/0.01 g)4 | Average # of Colonies (cfu/0.01 g) Column H | Average Log Growth (cfu/0.1 g (log10)) Column I |
| Sample 1 | 0.04 g | 10 | 200 | calculated as: (C2 x 0.1 g) / B2 = 25 | 1000 | calculated as: (D2 x E2 x F2) = 5000000 | average for sample 1 through last sample: (ie. average G1:G3) = 7000000 | log of average ie. log(H2) = 6.85 |
| Sample 2 | 0.03 g | 15 | 200 | 50 | 1000 | 10000000 | ||
| Sample 3 | 0.02 g | 6 | 200 | 30 | 1000 | 6000000 | ||
| 1Data shown for 3 samples | ||||||||
| 2Based on plating 5 µL x 200 for 1 mL | ||||||||
| 3Cotyledons are too small to core so colony counts were normalized to 0.1 g of tissue based on the average mass of one MoneyMaker-PtoS cotyledon (data not shown) | ||||||||
| 4Adjusted per mL based on volume plated | ||||||||
Table 1: Sample calculations for seedling bacterial growth assay. Sample calculations demonstrate how to normalize bacterial counts and determine log bacterial growth.
Step 11.3 of the Protocol section was updated from:
- Phenotype plants infected with PstT1 at 10–14 days after flood inoculation.
to:
- Phenotype plants infected with Pst19 at 10–14 days after flood inoculation.
Figure 4 in the Protocol section was updated from:
Figure 4: Schematic representation of expected phenotypes for seedling resistance and death in various genetic backgrounds. (A) Seedlings of Rio Grande-PtoR and the near-isogenic cultivar Rio Grande-PtoS are displayed 7 days after flooding with PstDC3000 (OD600 = 0.005) + 0.015% surfactant. Rio Grande-PtoR displays consistent resistance, and Rio Grande-PtoS displays consistent susceptibility to infection with PstDC3000. These lines give rise to discrete and binary phenotypes. (B) Seedlings of a wild accession, such as Solanum neorickii LA1329, are shown 10 days after flooding with PstT1 (OD600 = 0.0075) + 0.015% surfactant. Seedlings display phenotypic variability but were recorded as binary phenotypes. The amount of phenotypic variability and the method of phenotyping (binary resistance or resistance spectrum) will depend on the particular accession tested. (C) Mapping populations generated by outcrossing wild accessions to susceptible cultivars may display a wider spectrum of phenotypes in F2 segregating populations. In this case, it may be most appropriate to record seedling phenotypes on a spectrum. Highly susceptible seedlings from a mapping population may be phenotyped for death as early as day 7 when flooded with PstT1, and typically show a brown apical meristem, no to very little extension of the epicotyl, and no new, green vegetative growth. The apical meristem of susceptible seedlings may stay green or very light brown for more time, and there may be some extension of the epicotyl and very little vegetative growth, which turns brown and arrests by day 10. Individual seedlings can be phenotyped for resistance based on the amount of new and ongoing vegetative growth by day 14. Seedlings can then be grouped based on the phenotypes described above into different categories of resistance such as weak, medium, or strong resistance. Please click here to view a larger version of this figure.
to:
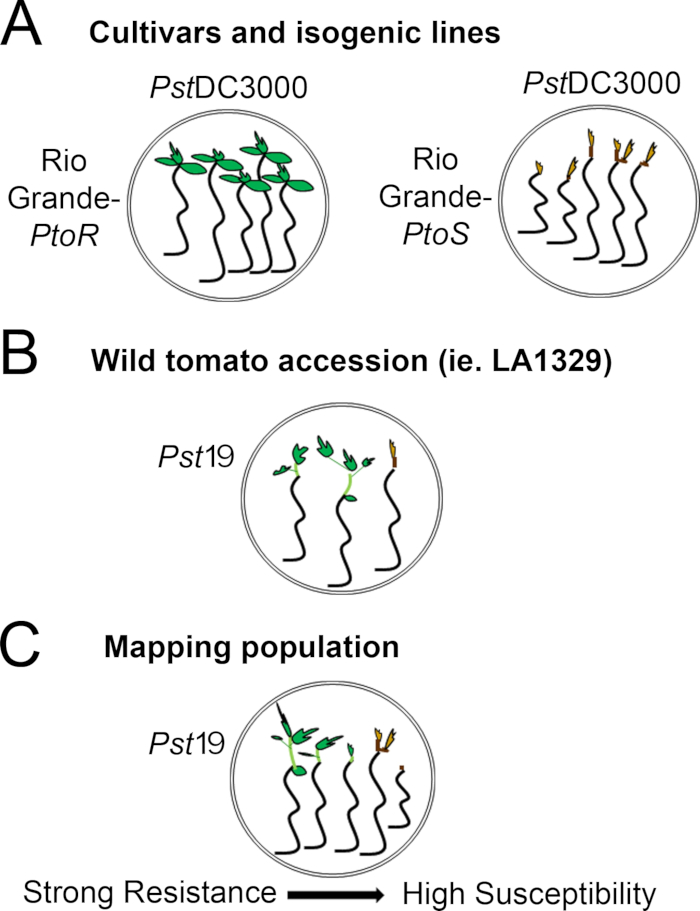
Figure 4: Schematic representation of expected phenotypes for seedling resistance and death in various genetic backgrounds. (A) Seedlings of Rio Grande-PtoR and the near-isogenic cultivar Rio Grande-PtoS are displayed 7 days after flooding with PstDC3000 (OD600 = 0.005) + 0.015% surfactant. Rio Grande-PtoR displays consistent resistance, and Rio Grande-PtoS displays consistent susceptibility to infection with PstDC3000. These lines give rise to discrete and binary phenotypes. (B) Seedlings of a wild accession, such as Solanum neorickii LA1329, are shown 10 days after flooding with Pst19 (OD600 = 0.0075) + 0.015% surfactant. Seedlings display phenotypic variability but were recorded as binary phenotypes. The amount of phenotypic variability and the method of phenotyping (binary resistance or resistance spectrum) will depend on the particular accession tested. (C) Mapping populations generated by outcrossing wild accessions to susceptible cultivars may display a wider spectrum of phenotypes in F2 segregating populations. In this case, it may be most appropriate to record seedling phenotypes on a spectrum. Highly susceptible seedlings from a mapping population may be phenotyped for death as early as day 7 when flooded with Pst19, and typically show a brown apical meristem, no to very little extension of the epicotyl, and no new, green vegetative growth. The apical meristem of susceptible seedlings may stay green or very light brown for more time, and there may be some extension of the epicotyl and very little vegetative growth, which turns brown and arrests by day 10. Individual seedlings can be phenotyped for resistance based on the amount of new and ongoing vegetative growth by day 14. Seedlings can then be grouped based on the phenotypes described above into different categories of resistance such as weak, medium, or strong resistance. Please click here to view a larger version of this figure.
The second paragraph of the Representative Results section was updated from:
Phenotypic screening of wild accessions using the seedling resistance assay
Figure 6 shows representative results for seedlings of susceptible and resistant accessions 10–14 days after flooding with PstT1. Susceptible accessions include RG-PtoR, S. pimpinellifolium LA1375, and S. pimpinellifolium LA1606, and resistant accessions include S. neorickii LA1329. Ten-day-old seedlings were flooded with 10 mM MgCl2 + 0.015% surfactant as a negative control, and PstT1 at an optical density of 0.0075 + 0.015% surfactant. The seedlings were phenotyped at least 10 days after flooding, as PstT1-infected seedlings died more slowly than PstDC3000-infected seedlings. Mock-inoculated seedlings were green, healthy, and actively growing. This control is important to ensure that the accessions are not sensitive to the concentration of surfactant, and to ensure there is no bacterial contamination. Susceptible accessions (Rio Grande-PtoR [n = 7], S. pimpinellifolium LA1375 [n = 7], and S. pimpinellifolium LA1606 [n = 5]) were dead, had brown apical meristems, and lacked new growth 10–14 days after inoculation with PstT1. In contrast, two S. neorickii LA1329 (n = 3) seedlings displayed a high level of new, green growth and survived infection with PstT1 (Figure 6). Three LA1329 seedlings did not germinate. Typically, 5–7 individuals were screened for each accession in a primary screen to determine the prevalence of resistance in the population. When a more genetically complex wild accession, such as LA1329, is flooded with PstT1, the resistance phenotypes display slightly more variability among individual seedlings, compared to Moneymaker-PtoR treated with PstDC3000. However, the resistance phenotypes were usually less variable than those seen in F2 mapping populations. Thus, binary phenotyping criteria was used for LA1329.
to:
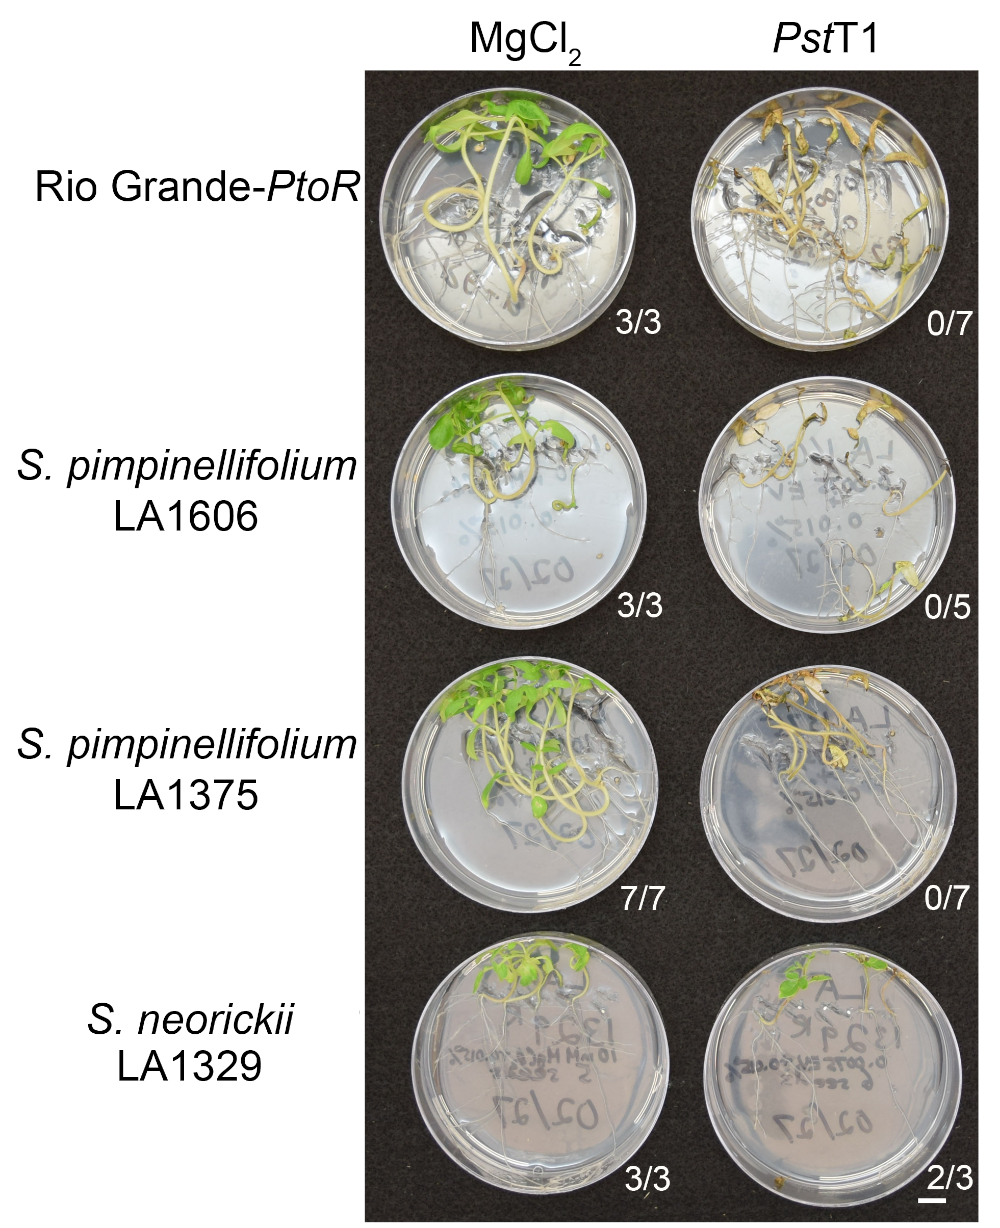
Phenotypic screening of wild accessions using the seedling resistance assay
Figure 6 shows representative results for seedlings of susceptible and resistant accessions 10–14 days after flooding with Pst19. Susceptible accessions include RG-PtoR, S. pimpinellifolium LA1375, and S. pimpinellifolium LA1606, and resistant accessions include S. neorickii LA1329. Ten-day-old seedlings were flooded with 10 mM MgCl2 + 0.015% surfactant as a negative control, and Pst19 at an optical density of 0.0075 + 0.015% surfactant. The seedlings were phenotyped at least 10 days after flooding, as Pst19-infected seedlings died more slowly than PstDC3000-infected seedlings. Mock-inoculated seedlings were green, healthy, and actively growing. This control is important to ensure that the accessions are not sensitive to the concentration of surfactant, and to ensure there is no bacterial contamination. Susceptible accessions (Rio Grande-PtoR [n = 7], S. pimpinellifolium LA1375 [n = 7], and S. pimpinellifolium LA1606 [n = 5]) were dead, had brown apical meristems, and lacked new growth 10–14 days after inoculation with Pst19. In contrast, two S. neorickii LA1329 (n = 3) seedlings displayed a high level of new, green growth and survived infection with Pst19 (Figure 6). Three LA1329 seedlings did not germinate. Typically, 5–7 individuals were screened for each accession in a primary screen to determine the prevalence of resistance in the population. When a more genetically complex wild accession, such as LA1329, is flooded with Pst19, the resistance phenotypes display slightly more variability among individual seedlings, compared to Moneymaker-PtoR treated with PstDC3000. However, the resistance phenotypes were usually less variable than those seen in F2 mapping populations. Thus, binary phenotyping criteria was used for LA1329.
Figure 6 in the Representative Results section was updated from:
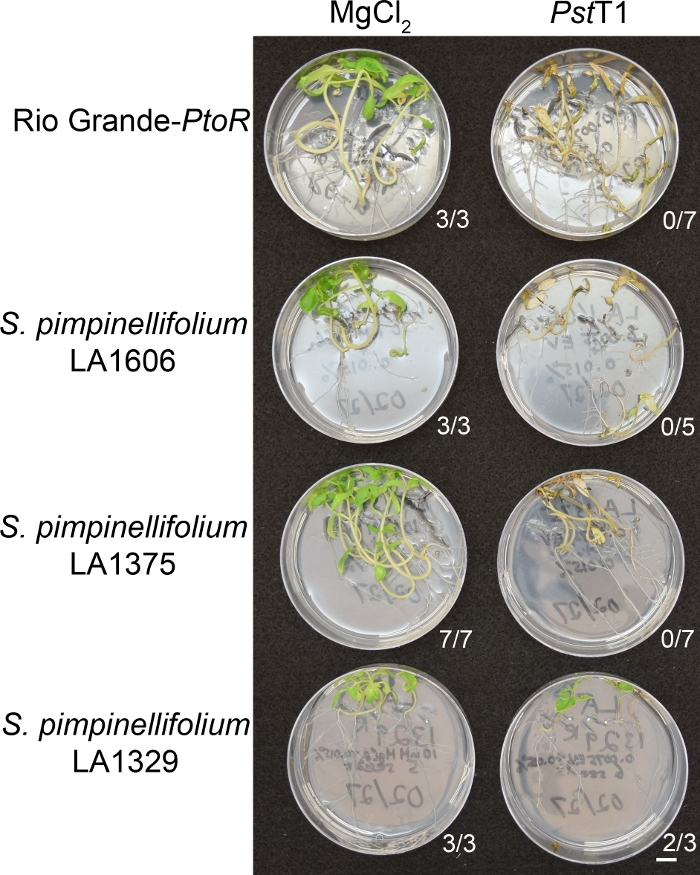
Figure 6: Phenotypic characterization of resistance or disease symptoms 10–14 days post-infection in wild accessions. Rio Grande-PtoR, S. pimpinellifolium LA1606, S. pimpinellifolium LA1375 and S. neorickii LA1329 tomato seedlings were grown on 0.5x MS plates for 10 days, and then flooded with PstT1 (OD600 = 0.0075) + 0.015% surfactant. The number of surviving seedlings for each wild accession out of the total number tested is shown. Scale bar = 1 cm. Please click here to view a larger version of this figure.
to:
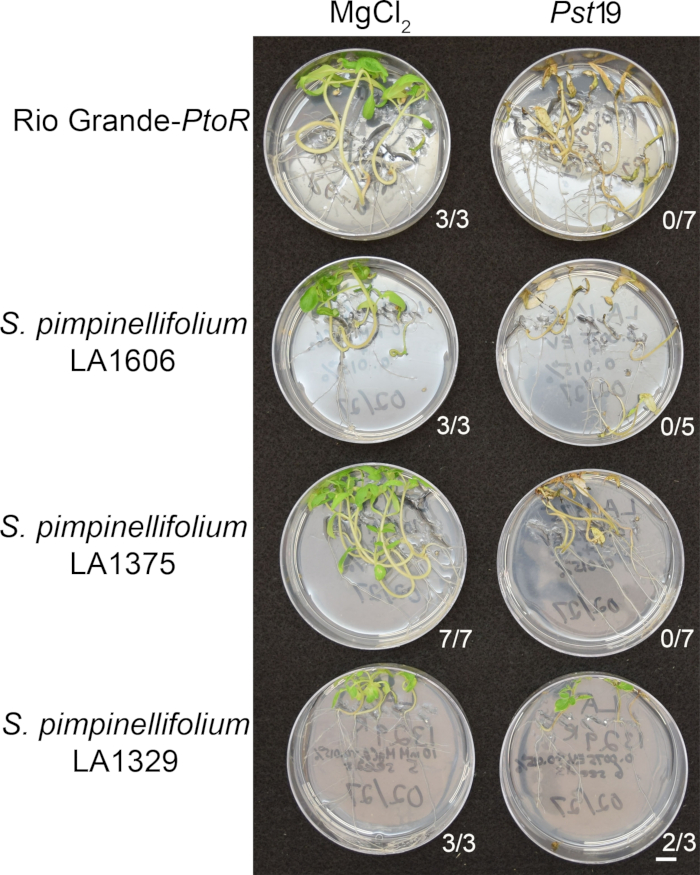
Figure 6: Phenotypic characterization of resistance or disease symptoms 10–14 days post-infection in wild accessions. Rio Grande-PtoR, S. pimpinellifolium LA1606, S. pimpinellifolium LA1375 and S. neorickii LA1329 tomato seedlings were grown on 0.5x MS plates for 10 days, and then flooded with Pst19 (OD600 = 0.0075) + 0.015% surfactant. The number of surviving seedlings for each wild accession out of the total number tested is shown. Scale bar = 1 cm. Please click here to view a larger version of this figure.
The third paragraph of the Representative Results section was updated from:
Quantitative assessment of bacterial growth using the seedling flood assay
To confirm that the observed resistance in LA1329 to PstT1 resulted in lower bacterial growth, bacterial growth assays were carried out in tomato seedlings. The level of PstT1 growth in Moneymaker-PtoS and S. neorickii LA1329 was determined 4 days post-infection. Moneymaker-PtoS is a near-isogenic line with consistent susceptibility among individual seedlings. Wild accessions such as S. neorickii LA1329 are often more genetically complex. LA1329 displays approximately 60% resistance to PstT1 across the population22. Because seedlings may drop their cotyledons after infection, one seedling was grown on each plate to correlate bacterial growth in the harvested cotyledon with overall seedling survival or death as determined phenotypically at least 10 days after flooding. The bacterial counts on day 4 for each seedling were normalized to 0.01 g of tissue and converted to log growth (CFU/0.01 g(log10)). Log growth for phenotypically resistant LA1329 seedlings (LA1329RES) or phenotypically susceptible seedlings (LA1329SUS) were separately pooled and compared to each other and the susceptible cultivar Moneymaker-PtoS. For example, there was a 1.7 log difference in bacterial growth between LA1329RES (log 6.3) and LA1329SUS (log 8.0), and a 1.6 log difference between LA1329RES (log 6.3) and Moneymaker-PtoS (log 7.9) (Figure 7). Therefore, phenotypic resistance correlated with quantitative resistance in the seedling assays.
to:
Quantitative assessment of bacterial growth using the seedling flood assay
To confirm that the observed resistance in LA1329 to Pst19 resulted in lower bacterial growth, bacterial growth assays were carried out in tomato seedlings. The level of Pst19 growth in Moneymaker-PtoS and S. neorickii LA1329 was determined 4 days post-infection. Moneymaker-PtoS is a near-isogenic line with consistent susceptibility among individual seedlings. Wild accessions such as S. neorickii LA1329 are often more genetically complex. LA1329 displays approximately 60% resistance to Pst19 across the population22. Because seedlings may drop their cotyledons after infection, one seedling was grown on each plate to correlate bacterial growth in the harvested cotyledon with overall seedling survival or death as determined phenotypically at least 10 days after flooding. The bacterial counts on day 4 for each seedling were normalized to 0.01 g of tissue and converted to log growth (CFU/0.01 g(log10)). Log growth for phenotypically resistant LA1329 seedlings (LA1329RES) or phenotypically susceptible seedlings (LA1329SUS) were separately pooled and compared to each other and the susceptible cultivar Moneymaker-PtoS. For example, there was a 1.7 log difference in bacterial growth between LA1329RES (log 6.3) and LA1329SUS (log 8.0), and a 1.6 log difference between LA1329RES (log 6.3) and Moneymaker-PtoS (log 7.9) (Figure 7). Therefore, phenotypic resistance correlated with quantitative resistance in the seedling assays.
Figure 7 in the Representative Results section was updated from:
x
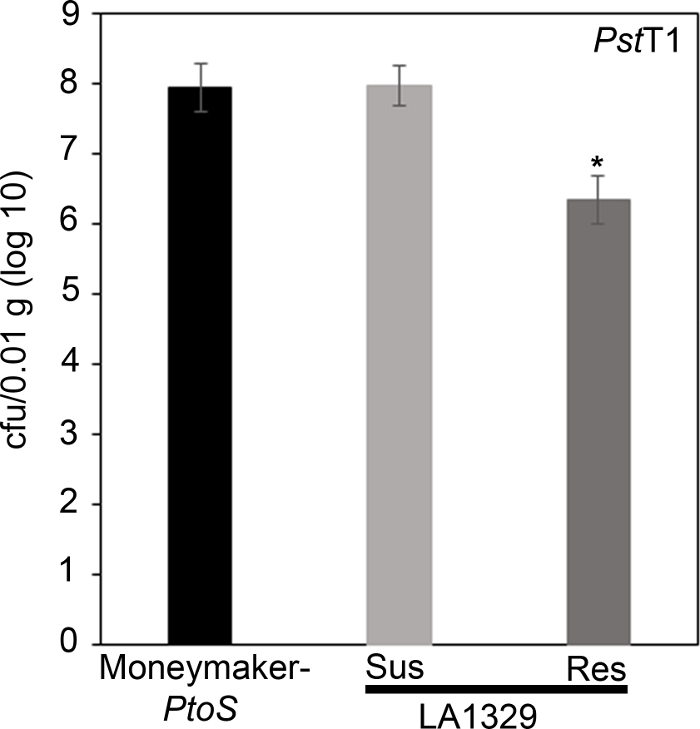
Figure 7: Resistant Solanum neorickii LA1329 seedlings support lower bacterial growth than Moneymaker-PtoS or susceptible S. neorickii LA1329. Bacterial counts were determined 4 days post-inoculation from S. neorickii LA1329 (n = 14) and Moneymaker-PtoS (n = 10) seedlings infected with PstT1 and normalization was performed to 0.01 g of tissue. For LA1329, the two phenotypic groups, susceptible (SUS) or resistant (RES), were observed and counted separately. Above the bar * = statistically significant difference determined by a one-factor analysis of variance. A general linear model procedure (p < 0.001) followed by a multiple comparison of means using Tukey's post hoc test was used. Error bars = standard error. The figure indicates one representative experiment. Please click here to view a larger version of this figure.
x
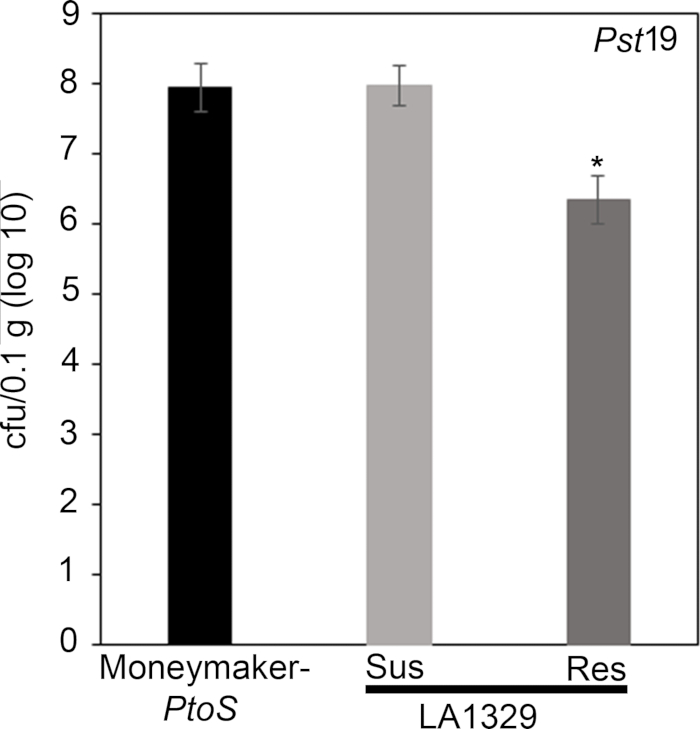
Figure 7: Resistant Solanum neorickii LA1329 seedlings support lower bacterial growth than Moneymaker-PtoS or susceptible S. neorickii LA1329. Bacterial counts were determined 4 days post-inoculation from S. neorickii LA1329 (n = 14) and Moneymaker-PtoS (n = 10) seedlings infected with Pst19 and normalization was performed to 0.1 g of tissue. For LA1329, the two phenotypic groups, susceptible (SUS) or resistant (RES), were observed and counted separately. Above the bar * = statistically significant difference determined by a one-factor analysis of variance. A general linear model procedure (p < 0.001) followed by a multiple comparison of means using Tukey's post hoc test was used. Error bars = standard error. The figure indicates one representative experiment. Please click here to view a larger version of this figure.
The first paragraph of the Discussion section was updated from:
A protocol for flood inoculation with PstDC3000 or PstT1 optimized to detect resistance to these bacterial strains in tomato seedlings is described. There are several critical parameters for optimal results in the seedling resistance assay, including bacterial concentration and surfactant concentration, which were empirically determined22. For PstDC3000, the optical density was optimized to achieve complete survival on a resistant cultivar containing the Pto/Prf cluster and complete death on a susceptible cultivar lacking the Pto/Prf cluster22. For a strain such as PstT1, where there are no known resistant varieties, the optical density was optimized to be the lowest possible for consistent and complete plant death22. Uppalapati et al.24 designed a tomato seedling assay to investigate the pathogenesis of PstDC3000 and the virulence function of coronatine. In this virulence assay, infections were performed using bacteria concentrated to an OD600 of 0.124, 20x higher than the optical density of strains used in our resistance assay. Recognition of PstDC3000 effectors AvrPto and AvrPtoB in tomato seedlings carrying the Pto/Prf gene cluster results in ETI and a macroscopic HR22. In the context of a strong immune response such as ETI, a lower bacterial titer was used for PstDC3000 to avoid overwhelming genetic resistance from the Pto/Prf gene cluster22. In addition, these results suggest that a high bacterial concentration could overwhelm weaker immune responses such as PTI or quantitative partial resistance, where multiple genes contribute to the overall phenotype. Surfactant is necessary for the bacteria to adhere to the leaf surface; however, high concentrations can cause chlorosis of the leaf22. We previously tested a range of surfactant concentrations to empirically determine the ideal concentration in 10-day-old tomato seedlings22. When testing new species that may differ in their sensitivity to surfactant, the surfactant concentration should be optimized to identify a concentration that does not cause damage or chlorosis in the absence of bacteria. Appropriate assay conditions will require optimization of a surfactant concentration that does not cause damage, and a bacterial concentration that causes disease in all susceptible controls.
to:
A protocol for flood inoculation with PstDC3000 or Pst19 optimized to detect resistance to these bacterial strains in tomato seedlings is described. There are several critical parameters for optimal results in the seedling resistance assay, including bacterial concentration and surfactant concentration, which were empirically determined22. For PstDC3000, the optical density was optimized to achieve complete survival on a resistant cultivar containing the Pto/Prf cluster and complete death on a susceptible cultivar lacking the Pto/Prf cluster22. For a strain such as Pst19, where there are no known resistant varieties, the optical density was optimized to be the lowest possible for consistent and complete plant death22. Uppalapati et al.24 designed a tomato seedling assay to investigate the pathogenesis of PstDC3000 and the virulence function of coronatine. In this virulence assay, infections were performed using bacteria concentrated to an OD600 of 0.124, 20x higher than the optical density of strains used in our resistance assay. Recognition of PstDC3000 effectors AvrPto and AvrPtoB in tomato seedlings carrying the Pto/Prf gene cluster results in ETI and a macroscopic HR22. In the context of a strong immune response such as ETI, a lower bacterial titer was used for PstDC3000 to avoid overwhelming genetic resistance from the Pto/Prf gene cluster22. In addition, these results suggest that a high bacterial concentration could overwhelm weaker immune responses such as PTI or quantitative partial resistance, where multiple genes contribute to the overall phenotype. Surfactant is necessary for the bacteria to adhere to the leaf surface; however, high concentrations can cause chlorosis of the leaf22. We previously tested a range of surfactant concentrations to empirically determine the ideal concentration in 10-day-old tomato seedlings22. When testing new species that may differ in their sensitivity to surfactant, the surfactant concentration should be optimized to identify a concentration that does not cause damage or chlorosis in the absence of bacteria. Appropriate assay conditions will require optimization of a surfactant concentration that does not cause damage, and a bacterial concentration that causes disease in all susceptible controls.
The third paragraph of the Discussion section was updated from:
Pst is a foliar pathogen that preferentially colonizes the aerial parts of tomato seedlings, including the cotyledons24 (Figure 3). Therefore, qualitative phenotyping in the seedling flood assay focuses on growth and disease symptoms in aerial portions of the seedling, and tissue for the bacterial growth assay is sampled from the cotyledons for quantitative analysis. After flood inoculation, seedlings may die within 7–10 days after inoculation with PstDC3000 or 10–14 days after inoculation with PstT1, as discussed in section 11. Seedling death is visualized by a brown apical meristem, arrested epicotyl elongation, and/or arrested vegetative growth. If different bacterial strains are used, the timing will have to be empirically determined. In addition, the progression of disease on control plants should be monitored daily after flooding until a consistent time frame from the onset of disease symptoms to seedling death can be identified. Depending on the genotypes and treatments used in the flood assay, seedling phenotypes can be recorded as binary phenotypes or on a disease spectrum (Figure 4). A broader spectrum of phenotypes may be observed when flood inoculating F2 mapping populations from wild tomato accessions crossed to susceptible cultivars (Figure 4C). It may be best to phenotype segregating populations on a disease spectrum depending on how quickly the seedling dies and the degree of new vegetative growth and branching (Figure 4C). The seedling flood assay can also be used in conjunction with the seedling bacterial growth assay to quantitatively assess levels of bacterial growth associated with qualitative phenotypes in individual seedlings (Figure 7). Very large reductions (i.e., ~log 3) in bacterial growth or strong resistance in resistant seedlings of a wild accession compared to a susceptible cultivar suggest that the underlying genetic basis of resistance may be due to ETI22. Smaller reductions in bacterial growth (i.e., ~log 1.7), as observed in LA1329 seedlings, may be due to the contribution of weaker resistance from quantitative trait loci and/or PTI. Thus, the seedling growth assay can be an important tool in further characterizing resistance in wild tomato lines.
to:
Pst is a foliar pathogen that preferentially colonizes the aerial parts of tomato seedlings, including the cotyledons24 (Figure 3). Therefore, qualitative phenotyping in the seedling flood assay focuses on growth and disease symptoms in aerial portions of the seedling, and tissue for the bacterial growth assay is sampled from the cotyledons for quantitative analysis. After flood inoculation, seedlings may die within 7–10 days after inoculation with PstDC3000 or 10–14 days after inoculation with Pst19, as discussed in section 11. Seedling death is visualized by a brown apical meristem, arrested epicotyl elongation, and/or arrested vegetative growth. If different bacterial strains are used, the timing will have to be empirically determined. In addition, the progression of disease on control plants should be monitored daily after flooding until a consistent time frame from the onset of disease symptoms to seedling death can be identified. Depending on the genotypes and treatments used in the flood assay, seedling phenotypes can be recorded as binary phenotypes or on a disease spectrum (Figure 4). A broader spectrum of phenotypes may be observed when flood inoculating F2 mapping populations from wild tomato accessions crossed to susceptible cultivars (Figure 4C). It may be best to phenotype segregating populations on a disease spectrum depending on how quickly the seedling dies and the degree of new vegetative growth and branching (Figure 4C). The seedling flood assay can also be used in conjunction with the seedling bacterial growth assay to quantitatively assess levels of bacterial growth associated with qualitative phenotypes in individual seedlings (Figure 7). Very large reductions (i.e., ~log 3) in bacterial growth or strong resistance in resistant seedlings of a wild accession compared to a susceptible cultivar suggest that the underlying genetic basis of resistance may be due to ETI22. Smaller reductions in bacterial growth (i.e., ~log 1.7), as observed in LA1329 seedlings, may be due to the contribution of weaker resistance from quantitative trait loci and/or PTI. Thus, the seedling growth assay can be an important tool in further characterizing resistance in wild tomato lines.
The fourth paragraph of the Discussion section was updated from:
Typically, genetic screens have been performed on four- to five-week-old adult tomato plants to identify the genetic basis of P. syringae resistance in wild accessions20,21. Adult tomato plants require much longer growth times, require more space in the growth chamber, and are much larger plants, which means that usually few individuals are screened for each line. The seedling flood assay provides a powerful, alternative approach in the identification of P. syringae resistance in wild tomato accessions. Screening at the seedling stage permits a large sample size to be tested which can be particularly advantageous in detecting resistance in genetically complex populations. Reduced growth chamber space requirements and growth time facilitate a high-throughput approach and rapid detection of natural resistance in wild accessions to emerging pathogens. Furthermore, P. syringae resistance that was identified at the seedling stage in this assay is not restricted to the developmental stage. S. neorickii LA1329 and S. habrochaites LA1253 were initially identified at the seedling stage and also display resistance to PstT1 in adult plants as previously described22.
to:
Typically, genetic screens have been performed on four- to five-week-old adult tomato plants to identify the genetic basis of P. syringae resistance in wild accessions20,21. Adult tomato plants require much longer growth times, require more space in the growth chamber, and are much larger plants, which means that usually few individuals are screened for each line. The seedling flood assay provides a powerful, alternative approach in the identification of P. syringae resistance in wild tomato accessions. Screening at the seedling stage permits a large sample size to be tested which can be particularly advantageous in detecting resistance in genetically complex populations. Reduced growth chamber space requirements and growth time facilitate a high-throughput approach and rapid detection of natural resistance in wild accessions to emerging pathogens. Furthermore, P. syringae resistance that was identified at the seedling stage in this assay is not restricted to the developmental stage. S. neorickii LA1329 and S. habrochaites LA1253 were initially identified at the seedling stage and also display resistance to Pst19 in adult plants as previously described22.
Reprints and Permissions
Request permission to reuse the text or figures of this JoVE article
Request PermissionThis article has been published
Video Coming Soon
Copyright © 2025 MyJoVE Corporation. All rights reserved