
Bu içeriği görüntülemek için JoVE aboneliği gereklidir. Oturum açın veya ücretsiz deneme sürümünü başlatın.
Method Article
Pseudomonas syringae pv Direnci yüksek-Throughput Tanımlama. Fide Sel Asası Kullanarak Domates
Bu Makalede
Erratum Notice
Özet
Fide sel testi Pseudomonas syringae bakteridirenç için yabani domates katılımları hızlı tarama kolaylaştırır. Bu tetki, fide bakteri büyüme testi ile birlikte kullanılan, daha fazla bakteriye altta yatan direnç karakterize yardımcı olabilir, ve direnç genetik temelini belirlemek için popülasyonları tarama için kullanılabilir.
Özet
Domates Pseudomonas syringaetarafından enfekte edilebilir bir tarımsal olarak önemli bir üründür , Bir Gram-negatif bakteri, bakteriyel benek hastalığı ile sonuçlanan. Domates-P. syringae pv. domates patosistemi yaygın bitki doğuştan gelen tepkiler ve hastalık direnci genetik temelini incelemek için kullanılır. Hastalık, Solanum pimpinellifolium'dan Ekili domatese Pto/Prf gen kümesinin getirilmesiyle uzun yıllar boyunca başarılı bir şekilde yönetilirken, P. syringae'nin 1.
Yabani domates türleri patojen tanımada doğal çeşitliliğin önemli rezervuarlarıdır, çünkü farklı patojen basınçları ile farklı ortamlarda evrimleşmişlerdir. Yabani domates hastalık direnci için tipik ekranlarda, yetişkin bitkiler, onların uzun büyüme süresi ve daha fazla büyüme alanı gereksinimleri nedeniyle taranabilir bitki sayısını sınırlayabilir kullanılır. 10 günlük domates fidelerini direnç açısından taramak için bir yöntem geliştirdik, bu yöntem bitki büyüme süresini ve büyüme odası alanını en aza indirir, bitkilerin hızlı bir şekilde devrilmesini sağlar ve büyük numune boyutlarının test edilmesine olanak sağlar. Hayatta kalma veya ölüm fide sonuçları ayrık fenotipler olarak veya sel sonrası kalan fidelerde yeni büyüme miktarı ile tanımlanan bir direnç ölçeğinde tedavi edilebilir. Bu yöntem, 10 günlük domates fidelerini iki P. syringae suşlarına karşı direnç açısından taramak için optimize edilmiştir ve diğer P. syringae suşlarına kolayca adapte edilebilir.
Giriş
Pseudomonas syringae, çok çeşitli bitki konaklarını enfekte eden gram-negatif patojenik bir bakteridir. Bakteriler stomata veya fiziksel yaralar yoluyla konak bitki girin ve apoplast1çoğalır. Bitkiler bakteriyel patojenler tarafından enfeksiyona karşı korumak için iki katmanlı bir bağışıklık yanıtı gelişti. Birinci seviye bitki hücre yüzeyinde oluşur, burada bitki hücre zarında desen tanıma reseptörleri son derece korunmuş patojen ilişkili moleküler desenler algılar (PAMPs) PAMP tetikli bağışıklık denilen bir süreç (PTI)2. Bu işlem sırasında, konak bitki hücre duvarına kalkoz birikimi, stomata kapatılması, reaktif oksijen türlerinin üretimi ve patogenez ile ilgili genlerin indüksiyon dahil olmak üzere savunma tepki yollarını düzenler.
Bakteriler, proteinler olarak adlandırılan proteinleri doğrudan bitki hücresi3'eulaştırmak için tip III salgı sistemini kullanarak PTI'nin üstesinden gelebilirler. Efektör proteinler genellikle PTI bileşenleri hedef ve patojen virülans teşvik4. Bitki bağışıklığının ikinci kademesi, etki alanı proteinlerin tanınması üzerine bitki hücresi içinde oluşur. Bu tanıma direnç genleri bağlıdır, hangi nükleotit bağlayıcı site lösin açısından zengin tekrar içeren reseptörleri (NLR). NLR'ler ya doğrudan efektörleri tanıyabilme ya da bir virülans hedefi ndeki aktivitelerini tanıma ya da5. Daha sonra etkili tetikli bağışıklık denilen bir süreçte ikincil bir bağışıklık yanıtı tetikler (ETI), genellikle aşırı duyarlı bir yanıt ile ilişkili (İK), enfeksiyon yerinde lokalize hücre ölümü bir formu6. ETI ile ilişkili gen-gen direncinin aksine, bitkiler birden fazla genin katkısına bağlı olan kantitatif kısmi dirençgösterebilirler 7.
P. syringae pv. domates (Pst)domates bakteriyel benek nedensel ajan dır ve kalıcı bir tarımsorunudur. Alanında baskın suşları genellikle Pst yarış 0 suşları ya da tip III efektörleri AvrPto ve AvrPtoB her ikisini ifade edilmiştir. DC3000(PstDC3000) temsili bir ırk 0 suşu ve domates bakteriyel leke neden olabilir bir model patojen. Bakteriyel benek hastalığı ile mücadele etmek için, yetiştiriciler Pto introgressed [P. syringae pv. domates]/ Prf [Pto direnci ve fenthion duyarlılık] yabani domates türlerinden gen kümesi Solanum pimpinellifolium içine modern çeşitleri8,9. Pto geni, Prf NLR ile birlikte AvrPto ve AvrPtoB10,11,12,13,14efektörleri tanınması yoluyla PstDC3000 direnç vermek bir serin-threonine protein kimyaz kodlar . Ancak, bu direnç son yıllarda onların hızlı ve agresif yayılması için izin, ortaya çıkan Yarış 1 suşları karşıetkisizdir15,16. AvrPto ya kayıp ya da bu suşları mutasyona uğramış çünkü Yarış 1 suşları, Pto / Prf küme tarafından tanıma kaçınmak, ve AvrPtoB minimal15birikir görünür,17,18.
Yabani domates popülasyonları Pst direnci için doğal varyasyon önemli rezervuarları ve daha önce potansiyel direnç loci belirlemek için kullanılmıştır19,20,21. Ancak, patojen direnci için mevcut ekranlar 4-5 haftalık yetişkin bitkiler20,21kullanır. Bu nedenle, büyüme süresi, büyüme odası alanı ve nispeten küçük örneklem boyutları ile sınırlıdır. Konvansiyonel yaklaşımların sınırlamalarını gidermek için, 10 günlük domates fideleri22kullanarak yüksek iş itimat lı domates P. syringae direnç tayini geliştirdik. Bu yaklaşım yetişkin bitkileri kullanma üzerinde çeşitli avantajlar sunar: yani, daha kısa büyüme süresi, azaltılmış alan gereksinimleri, ve daha yüksek iş artışı. Ayrıca, bu yaklaşımın erişkin bitkilerde gözlenen hastalık direnci fenotipleri sadakatle recapitulates göstermiştir22.
Bu protokolde açıklanan fide sel idamı, steril Murashige ve Skoog (MS) medyasının Petri kaplarında 10 gün boyunca yetiştirilir ve daha sonra ilgi ve yüzey aktif bakterisini içeren bir inokülle dolup taşmaktadır. Sel inden sonra, fideler bakteriyel büyüme tahlilleri ile hastalık direnci açısından nicel olarak değerlendirilebilir. Ayrıca, fide sağkalım veya ölüm sel sonra ayrı bir direnç veya hastalık fenotip 7-14 gün olarak hareket edebilir. Bu yaklaşım, Pst ırkı na karşı direnç için çok sayıda yabani domates katılımlarını tatmak için yüksek iş yapma alternatifi sunar, örneğin Pst suşu T1(PstT1) gibi, ve diğer bakteriyel suşlara kolayca adapte edilebilir.
Protokol
1. Biyogüvenlik kabininin hazırlanması ve kullanımı
- Biyogüvenlik kabinini %70 etanolle silin.
- Kuşağı kapatın ve biyogüvenlik kabinindeki ultraviyole ışığı 15 dakika süreyle açın.
- 15 dakika sonra, biyogüvenlik kabinindeki ultraviyole ışığı kapatın. Kuşağı kaldırın ve üfleyiciyi 15 dk açın.
- Sterilize kabine öğeleri koymadan önce% 70 etanol ile biyogüvenlik kabininde kullanılacak tüm öğeleri silin.
- Biyogüvenlik kabininde çalışmadan önce eldivenleri veya çıplak elleri %70 etanolile temizleyin.
- Biyogüvenlik dolabının merkezinde, üfleyiciden uzakta çalışın.
- Deneyler için açılmamış otoklavlı steril 10 mM MgCl2 ve ultra saf H2O şişeler kullanın. Şişeleri biyogüvenlik dolabına koyun ve sadece sterilleştirilmiş biyogüvenlik kabininde açın, tezgahın üstüne değil.
- Sterilize biyogüvenlik kabininde çalışmak için özel cam pipetler ve pipet uçları kullanın. Bunların sadece biyogüvenlik kabininde açıldığından emin olun, asla tezgahın üstünde değil.
- Biyogüvenlik kabininin kullanımından sonra, tüm atıkları (çamaşır suyu atıkları hariç) otoklavla ve yüzeyi %70 etanol ile silin.
2. Bitki ortamının hazırlanması
- Tartmak ve ultrasaf H 0.5x MS bazal tuzları eritin2O. Tartmak 0.8% bacto agar ve sonra çözünmüş 0.5x MS ekleyin.
- Otoklav ve medya dökme veya borulama önce 1 saat için 50 °C su banyosunda soğumasını bekleyin.
- Plakaların aşırı doldurulmaması için, polistiren tek kullanımlık steril 100 x 25 mm plakaları 40 mL dolgu seviyesine işaretleyin. Sterilleştirilmiş biyogüvenlik kabininde 100 x 25 mm steril plakalara ortam dökün.
3. Bitki malzemelerinin hazırlanması ve büyüme koşulları
- Domates tohumlarını 2,2 mL mikrosentrifuge tüpüne yerleştirin ve 2,0 mL%50 çamaşır suyu çözeltisi ekleyin.
- 25 dakika boyunca bir rocker üzerinde tüp Rock.
- 25 dakika sonra, kayadan tohumları çıkarın ve steril biyogüvenlik kabininde bir pipet ile çamaşır suyu çözeltisi kaldırın. Tüm çamaşır suyunun çıkarıldığından emin olun.
- Tohumları yıkamak için 2 mL steril ultrasaf H2O ekleyin. Tüpü 5x ters çevir.
- Bir pipet ile tüp sıvı çıkarın.
- Tohumları 4kat daha fazla yıkamak için adımları 3.3-3.5 tekrarlayın.
- Steril ultrasafH2 O 2 mL ekleyin ve boş bir steril Petri kabına tohumları dökün.
- Etanoldeki alev büşremler ve 0,5x MS + %0,8 agar ortam içeren 100 x 25 mm plakalar üzerinde tohum aktarma ve eşit aralıklı tohumlar aktarmadan önce soğumasını sağlar.
- Bir plakanın ortasındabir çizgi de 5-7 tohum aktarın ve cerrahi bant (1,25 cm x 9,1 m) ile plakaların kenarlarını mühürleyin.
- Sterilize edilmiş tohumları en az 3 gün karanlıkta 4 °C'de senkronize edin ve çimlenmeyi senkronize edin. Tohumların tabakta kaymaması için plakaların düz ve yüz yukarı yığılmış olduğundan emin olun.
- Dikey olarak kökleri plaka yüzeyi boyunca aşağı büyüyecek şekilde plakaları yönlendirmek, tohum hattı yatay odaklı, büyüme odasına aktarırken.
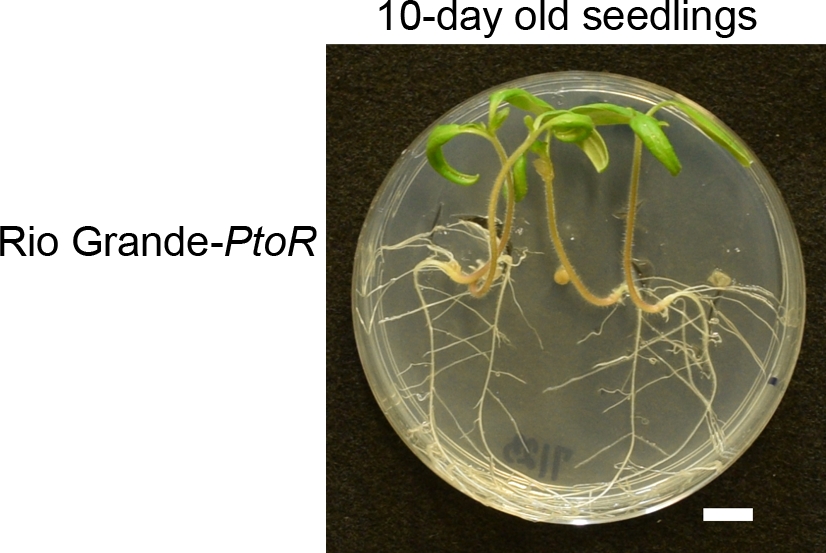
NOT: Büyüme odasını 22 °C'ye ayarlayın ve ~200-220 μE metre-2 s-1 ve 8 saat karanlık ışık yoğunluğunda 16 saat ışık sağlayın. - Sel den önce, fidelerin genellikle tam olarak ortaya çıktığı ve genişletilmiş cotyledonları ve ortaya çıkan ilk gerçek yaprakları gösterdiği büyüme odasında 10 gün boyunca fideler yetiştirilir(Şekil 1).

Şekil 1: Tipik 10 günlük domates fidelerinin gelişim evresi. Rio Grande-PtoR domates tohumları sterilize edildi, kaplandı ve 4 °C'de karanlıkta en az 3 gün boyunca tabakalaştırıldı. Fideler, 0.5x MS plakalar üzerinde 22 °C'de 10 gün boyunca su altında kalmadan önce yetiştirildi. Tipik olarak, 10 gün cotyledons tamamen genişletilmiş ve ilk gerçek yaprakları ortaya çıkmaya başlıyor. Bu rakamın daha büyük bir sürümünü görüntülemek için lütfen buraya tıklayın.
4. King's B23 (KB) ortamının hazırlanması
- 500 mL ultrapure H2O ile kabı doldurun ve bir karıştırma plakası üzerinde karıştırın.
- Tamamen çözünür 20 g bacto peptone, 1.5 g susuz K2HPO4, ve gliserol 12.5 mL ultrapure H2O ile bir kabın içinde.
- Çözünmüş karışımı 1 L'lik bir silindire dökün ve ultra saf H2O ile 1 L son hacmine kadar getirin.
- Suyu tekrar kabın içine dökün ve karıştırana kadar karıştırın.
- İki 500 mL cam şişe içine bacto agar 7,5 g tartın ve adım 4.4 her şişe içine KB suyu 500 mL ekleyin. 20 dk için otoklav.
- Otoklav dan şişe çıkarın ve yavaşça agar dağıtmak için girdap.
- Şişeleri 1 saat boyunca 50 °C'lik bir su banyosuna aktarın.
- 1 saat sonra, biyogüvenlik kabine ve aseptik koşullar altında şişe transferi, steril 1 M MgSO41.600 μL ekleyin , ve ortama uygun antibiyotikler.
NOT: PstDC3000 ve PstT1 rifampisin dirençli suşları için, 50 μg/mL son konsantrasyonda dimetilformamid çözünmüş rifampisin kullanın. Plakalarda mantar büyümesini önlemek için 50 g/mL'lik son konsantrasyonda etanoliçinde çözünmüş siklohekamid kullanın. - Karıştırmak için ortamı hafifçe döndürün ve tabakların altını kaplayacak şekilde dökün.
- Plakaların 4 °C'de baş aşağı saklamadan önce katılaşmaları için en az 1 saat bekleyin.
5. Bakteriyel suşların ve kültür koşullarının bakımı
- 1 mL doymuş bakteri kültürü ve -80 °C'de 333 μL steril %80 gliserol olarak tek bakteri kolonisinden gliserol stoğunu koruyun.
- Yama bakterileri (yani, PstT1) uygun antibiyotikler ile KB agar üzerine bir gliserol stok (bölüm 4).
- Düz, steril kürdan kullanarak taze bakterileri seçici KB agar'a sürmeden önce bakterilerin 28 °C'de 2 gün boyunca iyileşmesini bekleyin.
- Düz, steril kürdan kullanarak uygun seçici KB agar üzerine gliserol stok itibaren taze bakteri Streak.
NOT: Yamalı gliserol stokunun en fazla 2 haftalık olmadığından emin olun. - PstDC3000 için, kb plakasını sel deneyinde bakteri kullanmadan önce 28 °C'de 24 saat kuluçkaya yatırın.
- PstT1 için, kb plakasını sel deneyinde bakteri kullanmadan önce 28 °C'de 48 saat kuluçkaya yatırın.
6. PstT1 inokülünün hazırlanması
- 10 mM MgCl2'deki bakterileri 0,1'in 600 nm (OD600)veya yaklaşık 5 x 10⁷ koloni şekillendirme ünitesinde (CFU)/mL) optik yoğunluğa geri uzaklaştırın.
- Biyogüvenlik kabininde steril 10 mM MgCl2 çözeltisi kullanarak seri seyreltmeler yapın. PstT1 için, OD600 = 0.1 başlangıç konsantrasyonu ile inokül yapmak için bir spektrofotometre kullanın.
- PstT1 için, OD 600 = 0.1 konsantrasyonunda seri seyreltme elde etmek için OD600 = 0.1'deki ilk süspansiyondan 1/10 seyreltme yapın.
- 6.3 adımından OD600 = 0.01'deki seri seyreltme kullanarak, son bir OD600 = 0.0075 elde etmek için 3/4 seyreltme yapın.
- Non-iyonik organosilikon süraktif kopolimer C13H34O4Si3 (yani, bir 1/10 seyreltme olun sürfaktan) içinde 10 mM MgCl2 ve girdap 15 s. Son seri seyreltme (OD600 = 0,0075) için 1/10 stok sürfaktan ekleyin nihai konsantrasyona 0.015% ve girdap iyi karıştırmak için.
7. PstDC3000 inoculum hazırlanması
- Steril 10 mM MgCl2'deki bakterileri 0,1 (yaklaşık 5 x 10⁷ CFU/mL) 600 nm (OD600)optik yoğunluğa kadar aseptik olarak yeniden askıya alın.
- Biyogüvenlik kabininde steril 10 mM MgCl2 çözeltisi kullanarak seri seyreltmeler yapın. PstDC3000 için, OD600 = 0.1 başlangıç konsantrasyonu ile inoculum yapmak için bir spektrofotometre kullanın.
- PstDC3000 için, OD600 = 0.1 konsantrasyonunda seri seyreltme elde etmek için OD600 = 0.1'deki ilk süspansiyondan 1/10 seyreltme yapın.
- 3. adımdan OD600 = 0.01'deki seri seyreltme kullanarak, son bir OD600 = 0.005 elde etmek için 1/2 seyreltme yapın.
- 10 mM MgCl2'de 1/10 yüzey aktif madde seyreltme ve 15 s. 1/10 yüzey aktif madde stoğunu son seri seyreltmeye (OD600 = 0,005) ilave edin ve %0.015'lik son konsantrasyona ekleyin ve karıştırmak için girdap iyi.
8. Domates fidesi sel yöntemi
- 10 günlük fidelerin olduğu plakaları büyüme odasından alın ve su baskınına karşı plakaları hazırlamak için biyogüvenlik kabinesini koyun.
- Cerrahi bandı iki tabaktan çıkarın.
- 3 dk. Son inoculum6 mL ölçün (PstT1 OD600 = 0.0075 [bölüm 6] veya PstDC3000 OD600 = 0.005 [bölüm 7]) ve 10 günlük fideler ile her plaka ya 6 mL inokül aktarın.
- Fideleri steril bir pipet ucuyla inoküle hafifçe bastırın. Zamanlayıcıyı çalıştırın.
- Her elde bir tabak tutun. İnokül biriktirmek ve esas olarak fidelerin cotyledons ve yaprakları batırmak için aşağı plaka ön eğim.
- Swish yan 5-7x ve sonra kökleri ve tüm plaka kapsayacak şekilde geri plakaları ucu.
- Cotyledons ve yaprakları batırmak için plakaları tekrar aşağı yatırın ve toplam 3 dakika boyunca tekrarlayın.
- Plakalardan inoculum dökün, düz bir yüzeye plakaları aşağı ayarlayın ve sonra ikinci kez herhangi bir kalıntı inoculum dökün.
- Plakaları cerrahi bantla yeniden sarın ve kalan plakalar için 8.2-8.8 adımlarını tekrarlayın.
- Tüm plakalar sular altında kaldıktan sonra, büyüme odasındaki plakaları yeniden kuluçkaya yatırın (bkz. adım 3.11 NOT).
- PstDC3000 için 7-10 gün veya PstT1 için 10-14 gün sonra fenotip (bölüm 11). Bakteriyel büyüme tahlilleri gerçekleştiriyorsanız, 4 gün sonra yaprak dokusu toplamak (bölüm 9 ve 10) ve daha sonra fenotip (bölüm 11). Alternatif olarak, bitkilerin ayrı setleri üzerinde henotik analiz ve bakteri büyüme tahlilleri gerçekleştirin.
9. Bakteriyel büyüme tsay için cotyledons yüzey sterilizasyonu
- Dört gün sel ve büyüme odasında (bölüm 8) fideler yeniden kuluçka sonra, büyüme odasından domates fideleri ile plakaları çıkarın.
- Her genotip için fidelenin tabağa bağlandığı plakanın alt dış kısmındaki tek tek fidelekleri numaralandırma.
- Tek tek fide numaraları ile etiket steril 1.5 mL mikrosantrifüj tüpler ve bir boncuk çırpıcı ile kullanmak için her tüp içine bir 3 mm steril borosilicate boncuk damla temiz forseps kullanın. (Bkz. adım 10.1'deki NOT.)
- Pipet 200 μL 10 mM MgCl2 her tüp ve yakın tüpler içine.
- %70 etanol hazırlayın ve temiz bir kabın içine 100 mL dökün. Ayrı, temiz bir kabın içine 100 mL steril ultrasaf H2O dökün.
- Temiz paslanmaz çelik düz ince nokta forceps ile tırtıklı ipuçları ile etanol ile. Temiz forceps ile bir cotyledon aseptik kaldırılmasına izin vermek için biraz plaka açın.
- Bir yaprağı çıkarmak için karyolanın tabanındaki petiole'yi çimdikleyin ve %70 etanolle kabın içine damlatarak 10 s. Ultrasaf H 2 O'ndaki cotyledon'u 10 s'lik ultrasaf H2O'da durulayın.
- Bir kağıt havlu üzerine cotyledon yerleştirin ve hassas bilim mendilleri ile kuru leke.
- Yüzey sterilizasyonu ve lekelenmeden sonra her karyolayı ayrı ayrı tartın ve ağırlığı kaydedin.
- Daha önce hazırlanmış 1,5 mL mikrosantrifüj tüpü (adım 9.3 ve 9.4) ilgili genotip ve bireysel numarası ile etiketlenmiş cotyledon yerleştirin.
- Plakaları steril bantla yeniden kapatın ve büyüme odasındaki fideleri yeniden kuluçkaya yatırın (bkz. adım 3.11 NOT).
10. Bakteriyel büyüme tetkik
- 9.10.adımdan alınan numuneleri kullanarak 10 mM MgCl 2'deki boncuk çırpıcıyı kullanarak1-2 dk boyunca dokuyu homojenize edin. Doku yeterince serpilmiş değilse, tekrar homojenize.
NOT: Birçok üretici boncuk çırpıcı homogenizers üretmek. Boncuk sayısı ve türü, homojenizasyon süresi ve hızı (programlanabilirse) her homogenizer türü için optimize edilmelidir. Homojenizasyon sırasında numunelerin aşırı ısınmadığından emin olun. - Adım 10.1'den itibaren serpiştirilen doku içeren her tüpe 10 mM MgCl2'nin 800 μL'sini ekleyin ve karıştırmak için birkaç kez ters çevirin.
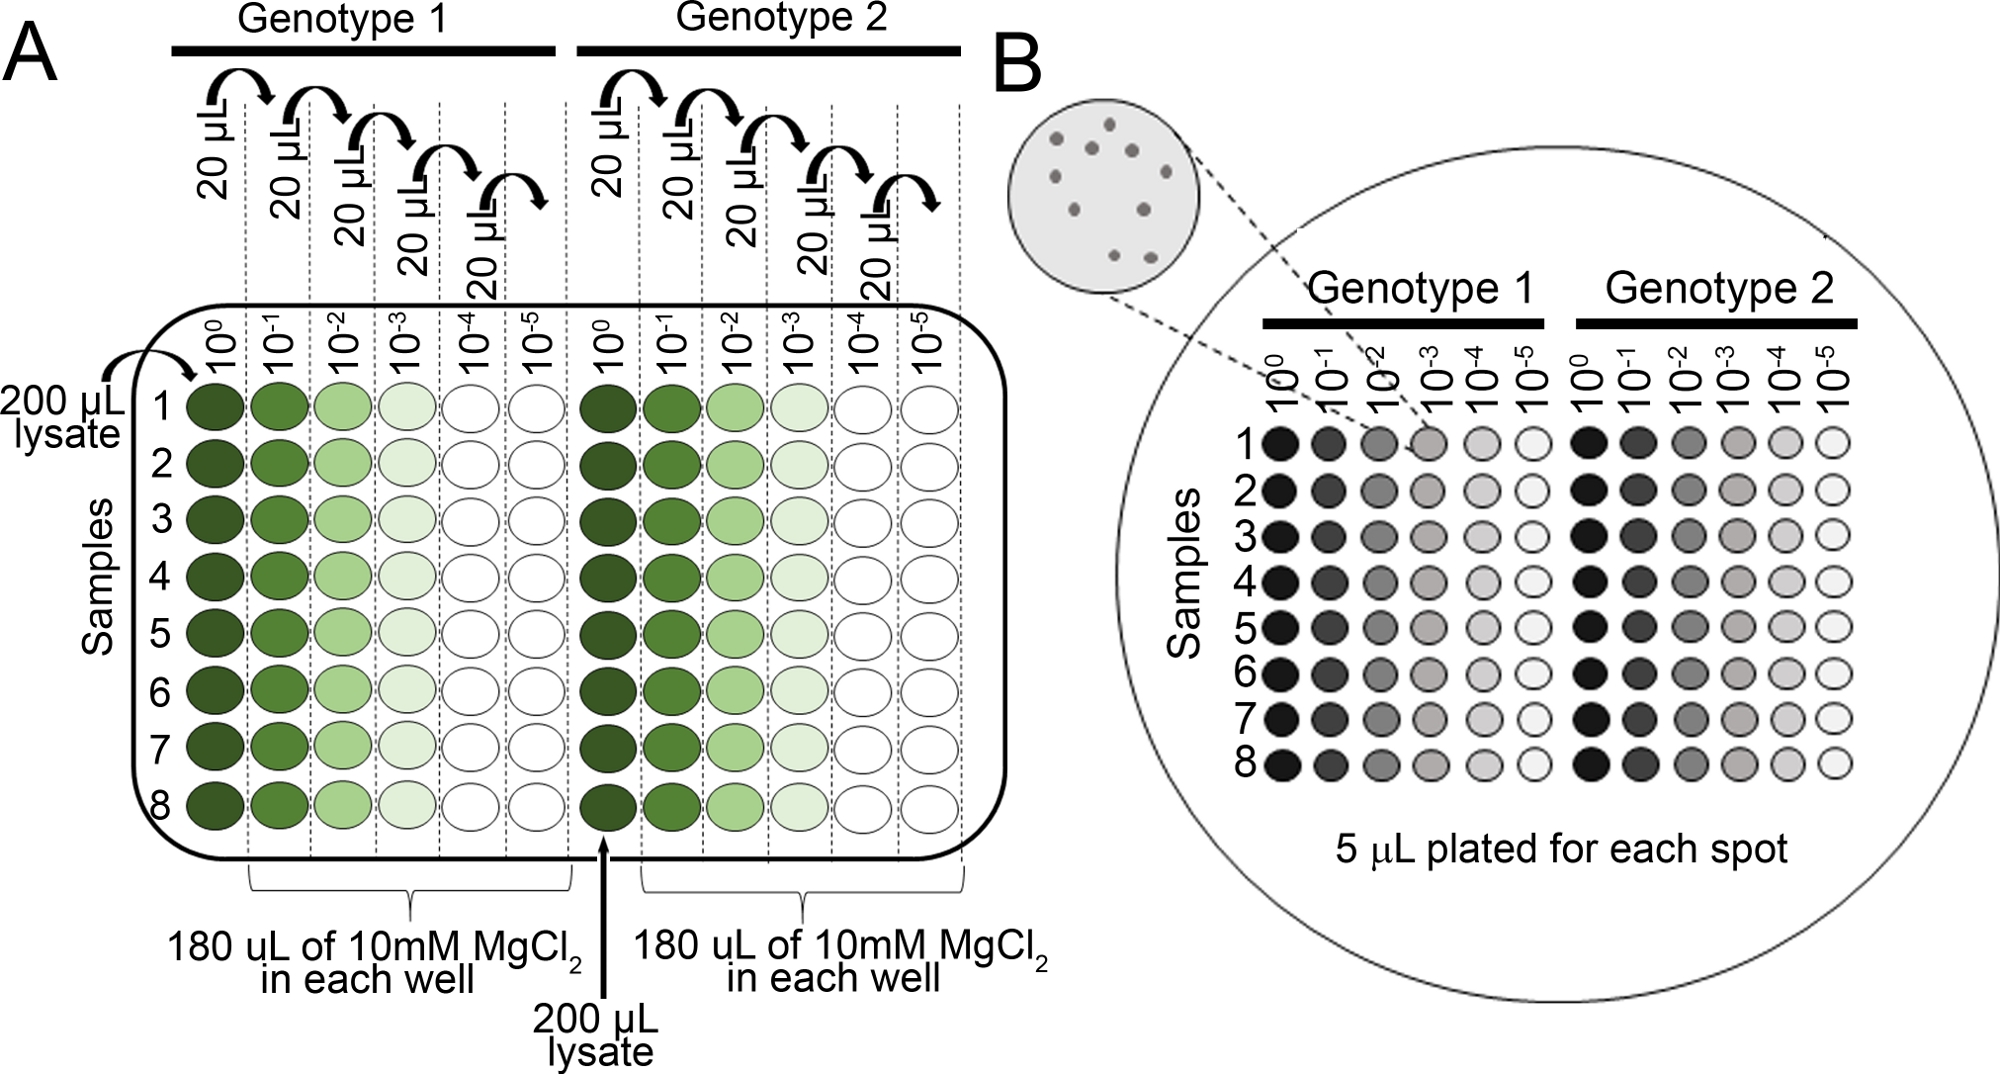
- 10 mM MgCl2'de her numune için seri seyreltmeler hazırlayın 96 plakalı (100, 10- 10, 10-2, 10-3, 10-4, 10-5) çok kanallı bir pipet kullanarak(Şekil 2A).
- Pipet 5 μL her seyreltme serisinden bir KB agar plaka (150 mm x 15 mm) üzerine bir sikloheximid ve ilgi bakteriyel suşu için uygun seçim üzerine çok kanallı pipet kullanarak (adım 4.8 NOT bakınız). Plakalar tamamen kurusun.
- Plakayı 28 °C'de baş aşağı 36 saat kuluçkaya yatırın, sonra(Şekil 2B)plakalar üzerindeki kolonileri, kolonilerin saymak için yeterince büyük olup olmadığını belirlemek için bir diseksiyon mikroskobu kullanarak görüntüleyin.
NOT: Koloniler yeterince büyük değilse, plakaları yeniden kuluçkaya yatırın ve kolonilerin boyutunu birkaç saatte bir yeniden kontrol edin. Tipik olarak, koloniler kuluçka sonrası ~ 36-48 h sayılabilir.

Şekil 2: Fide bakteri büyüme tahlilleri için seri seyreltmeler. (A) Enfekte bitkilerden elde edilen yaprak dokusu koloni sayımından önce seyreltilir. Seyreltmeler 96 kuyu plakası (100 seyreltilmemiş) yapılır. Tipik olarak seyreltmeler 10-1'den 10-5'ekadar yapılır. (B) Bakteri kolonisi için kaplama seyreltmeleri sayar. Seyreltme serisinin her bir sütununun toplam 5 μL'si, en seyreltikten en yoğun konsantreye kadar kaplanır. Koloniler tamamen kuruduktan sonra plaka 28 °C'de 36-48 h. Koloniler 10x diseksiyon mikroskobu altında sayılmaktadır. Bu rakamın daha büyük bir sürümünü görüntülemek için lütfen buraya tıklayın.
- Kolonileri birleşmeden önce bir kesişme mikroskobu altında sayın (Şekil 2B). 100'den az kolonisi olan seyreltme serisi plakalardan kolonileri sayın.
- Koloni sayılarını aldıktan sonra(Şekil 2B),fideler için 0.01 g doku sayısını normalleştirin ve bakteri üremesini günlük hale dönüştürün(Tablo 1).
NOT: BirMoneymaker-PtoS cotyledon ortalama kütlesi 0.01 g ve ampirik olarak belirlenir22.
| Genotip1 Sütun A | Doku Ağırlığı (g) Sütun B | # Bir noktada Koloniler Sütun C | Spot2 Sütun D için seyreltme faktörü | Kolonilerin Düzeltilmiş #3 Sütun E | Seri seyreltme Sütunu F için seyreltme faktörü | Kolonilerin Toplam # Sütun G (cfu/0.01 g)4 | Kolonilerin Ortalama # (cfu/0.01 g) Sütun H | Ortalama Günlük Büyümesi (cfu/0.01 g (günlük10)) Sütun I |
| Örnek 1 | 0,004 g | 10 | 200 | olarak hesaplanır: (C2 x 0.01 g) / B2 = 25 | 1000 | olarak hesaplanır: (D2 x E2 x F2) = 5000000 | örnek lem 1 ile son numune ortalaması: (yani ortalama G1:G3) = 7000000 | ortalama yani günlük. log(H2) = 6,85 |
| Örnek 2 | 0,003 g | 15 | 200 | 50 | 1000 | 10000000 | ||
| Örnek 3 | 0,002 g | 6 | 200 | 30 | 1000 | 6000000 | ||
| 1.1.2 3 örnek için gösterilen veriler | ||||||||
| 2.000 1 mL için kaplama 5 μL x 200'e dayalı | ||||||||
| 3.2.2 Cotyledons çekirdek için çok küçük bu yüzden koloni sayıları birMoneyMaker-PtoS cotyledon ortalama kütlesine göre doku 0.01 g normalleştirilmiş (veri gösterilmez) | ||||||||
| 4.2.2 Kaplamalı hacime göre mL başına ayarlanır | ||||||||
Tablo 1: Fide bakteri büyüme tetkik için örnek hesaplamalar. Örnek hesaplamalar bakteri sayılarını nasıl normalleştireceklerini ve günlük bakteri büyümesini nasıl belirleyeceklerini gösterir.
- Yabani katılımlar ve karmaşık genetik geçmişe sahip diğer çizgiler için, bölüm 11'de açıklandığı gibi, bireysel fidelerde bakteri üreme düzeyini fenotipleriyle ilişkilendirin.
11. Direnç için fenotipleme
- 7-14 gün sonra büyüme odası ve fenotip bireysel fide ölüm (hastalık nedeniyle) veya sağkalım (direnç nedeniyle) plakaları çıkarın.
- Fenotip bitkiler pstDC3000 gibi son derece öldürücü bir suşu ile enfekte daha önce, 7-10 gün sel aşısı sonra.
- Sel aşısından 10-14 gün sonra PstT1 ile enfekte olan fenotip bitkiler.
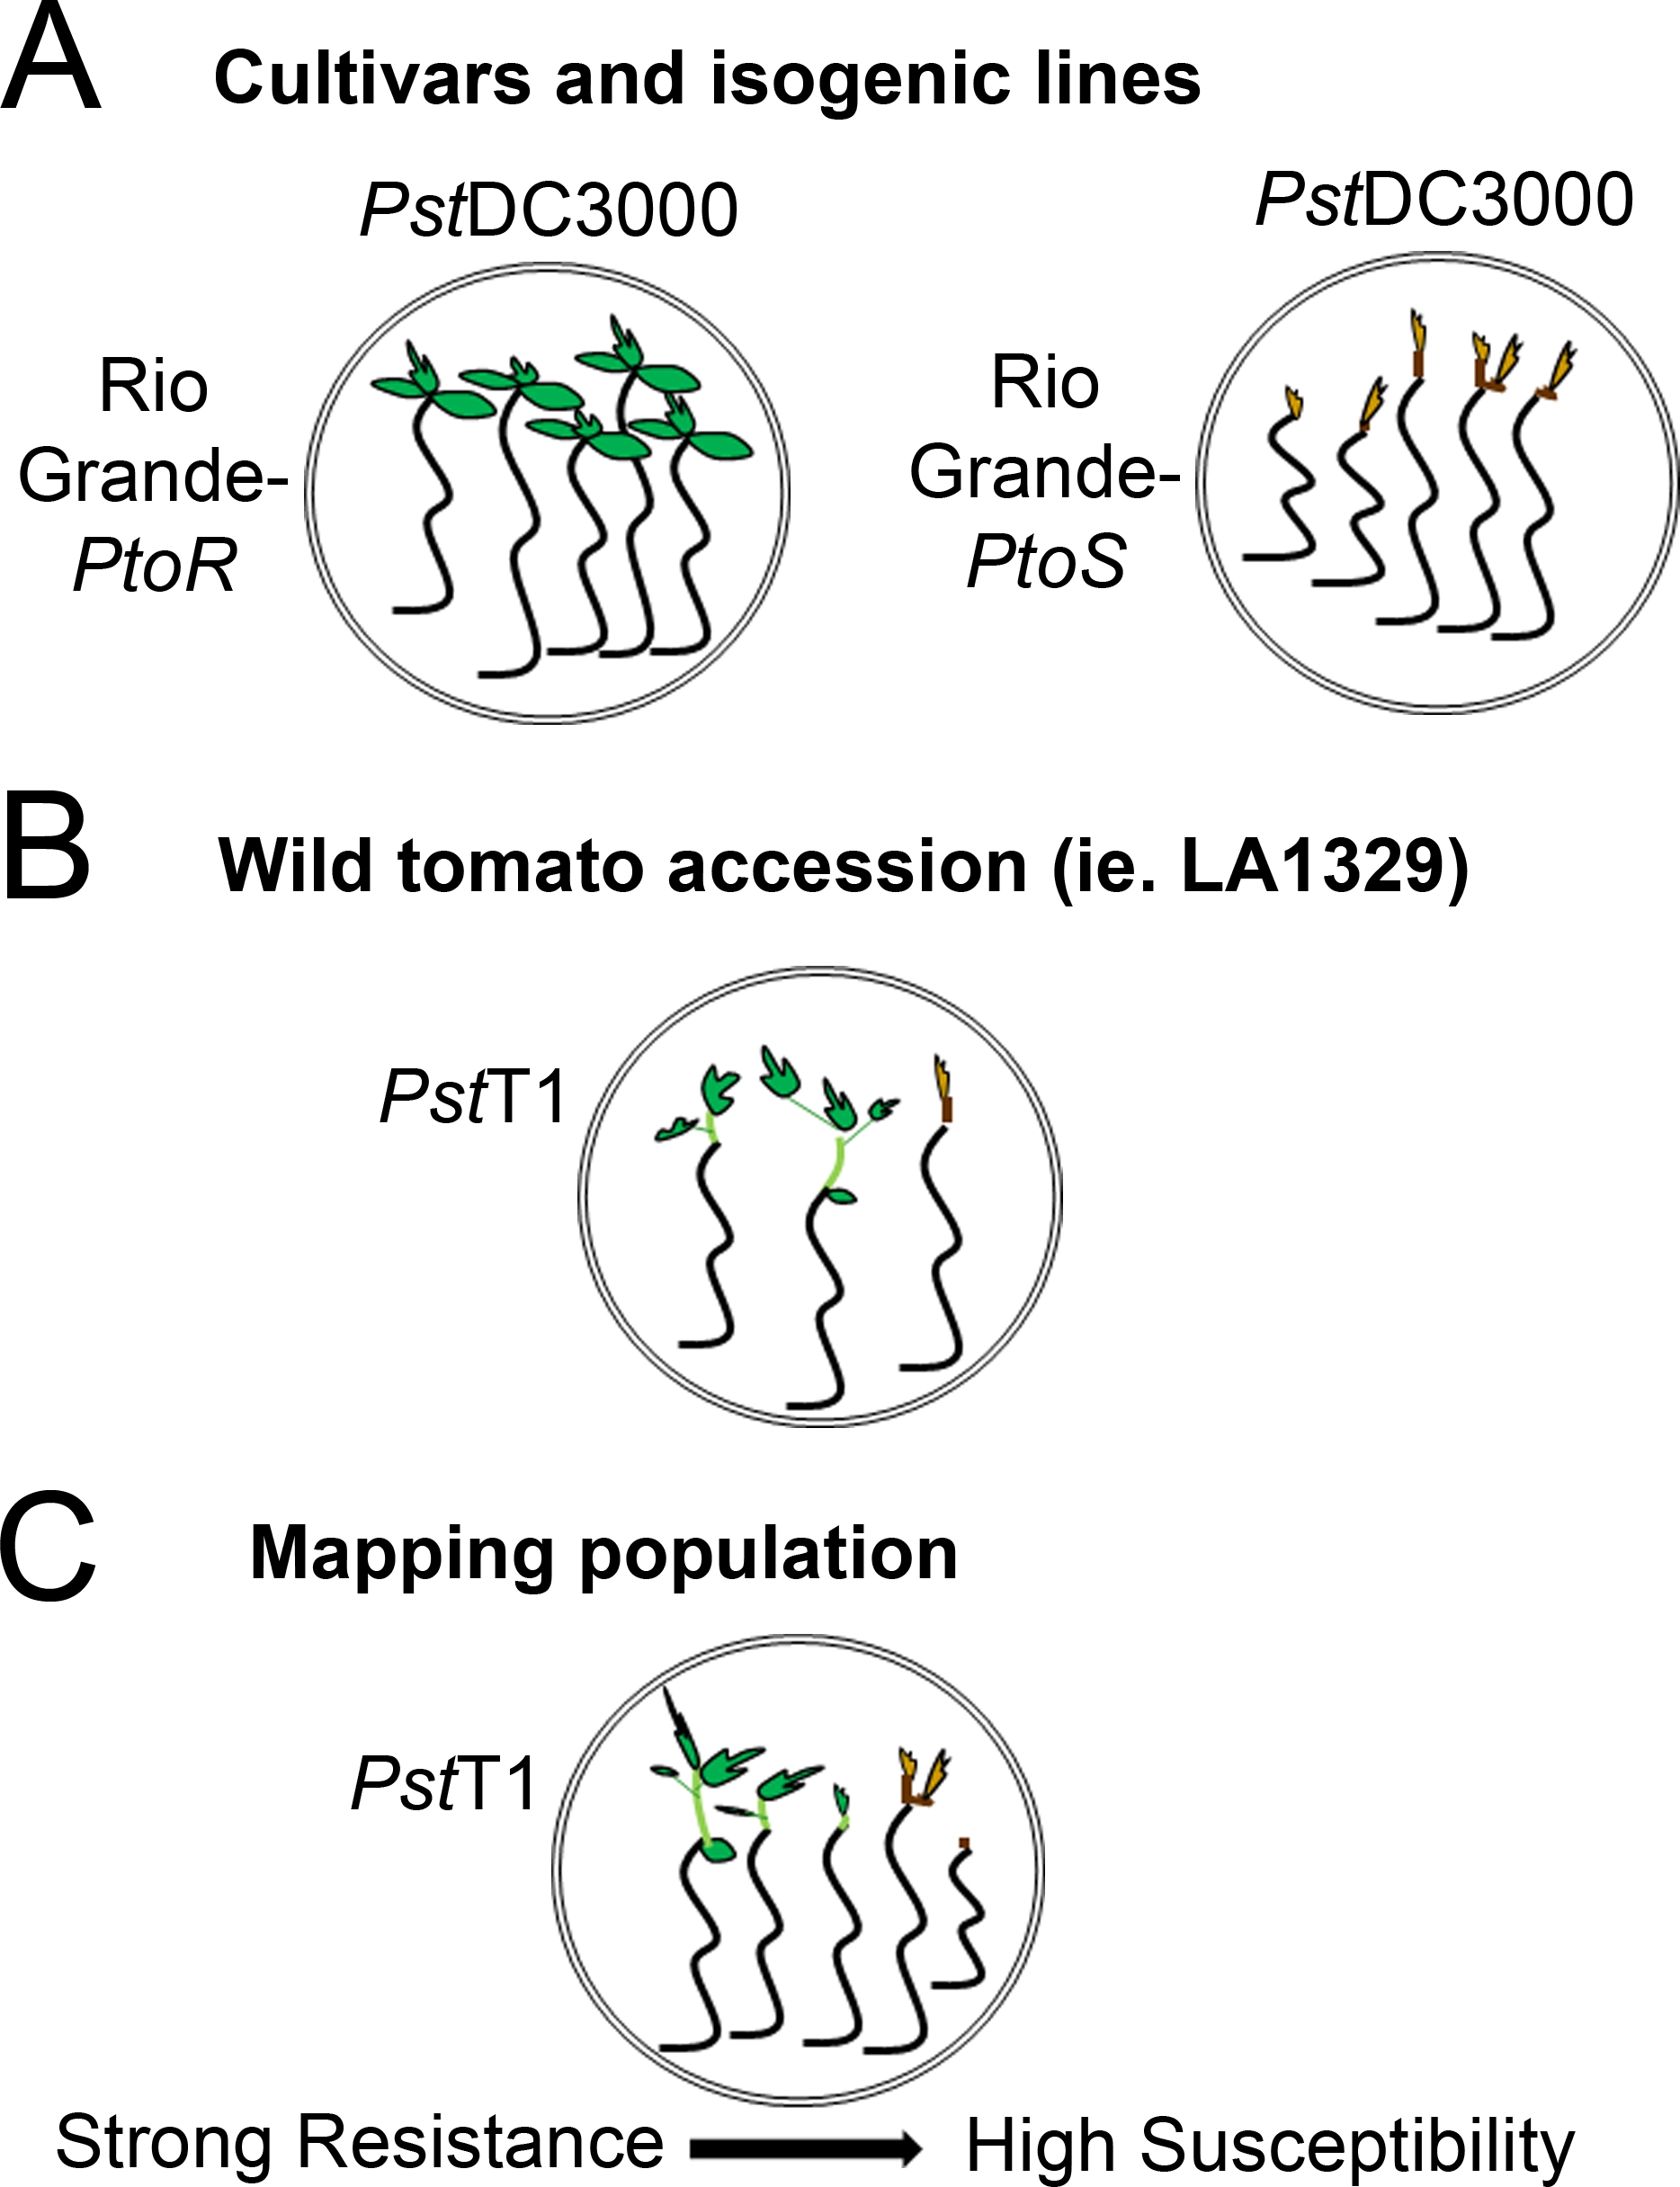
- Gözlenen direnç fenotipleri aralığına göre bir puanlama sistemi belirleyin. Çeşitleri, İzojenik çizgiler ve tutarlı, güçlü ve orta direnç fenotipleri ile yabani katılımlar için kayıt ikili fenotipler(Şekil 4A, 4B).
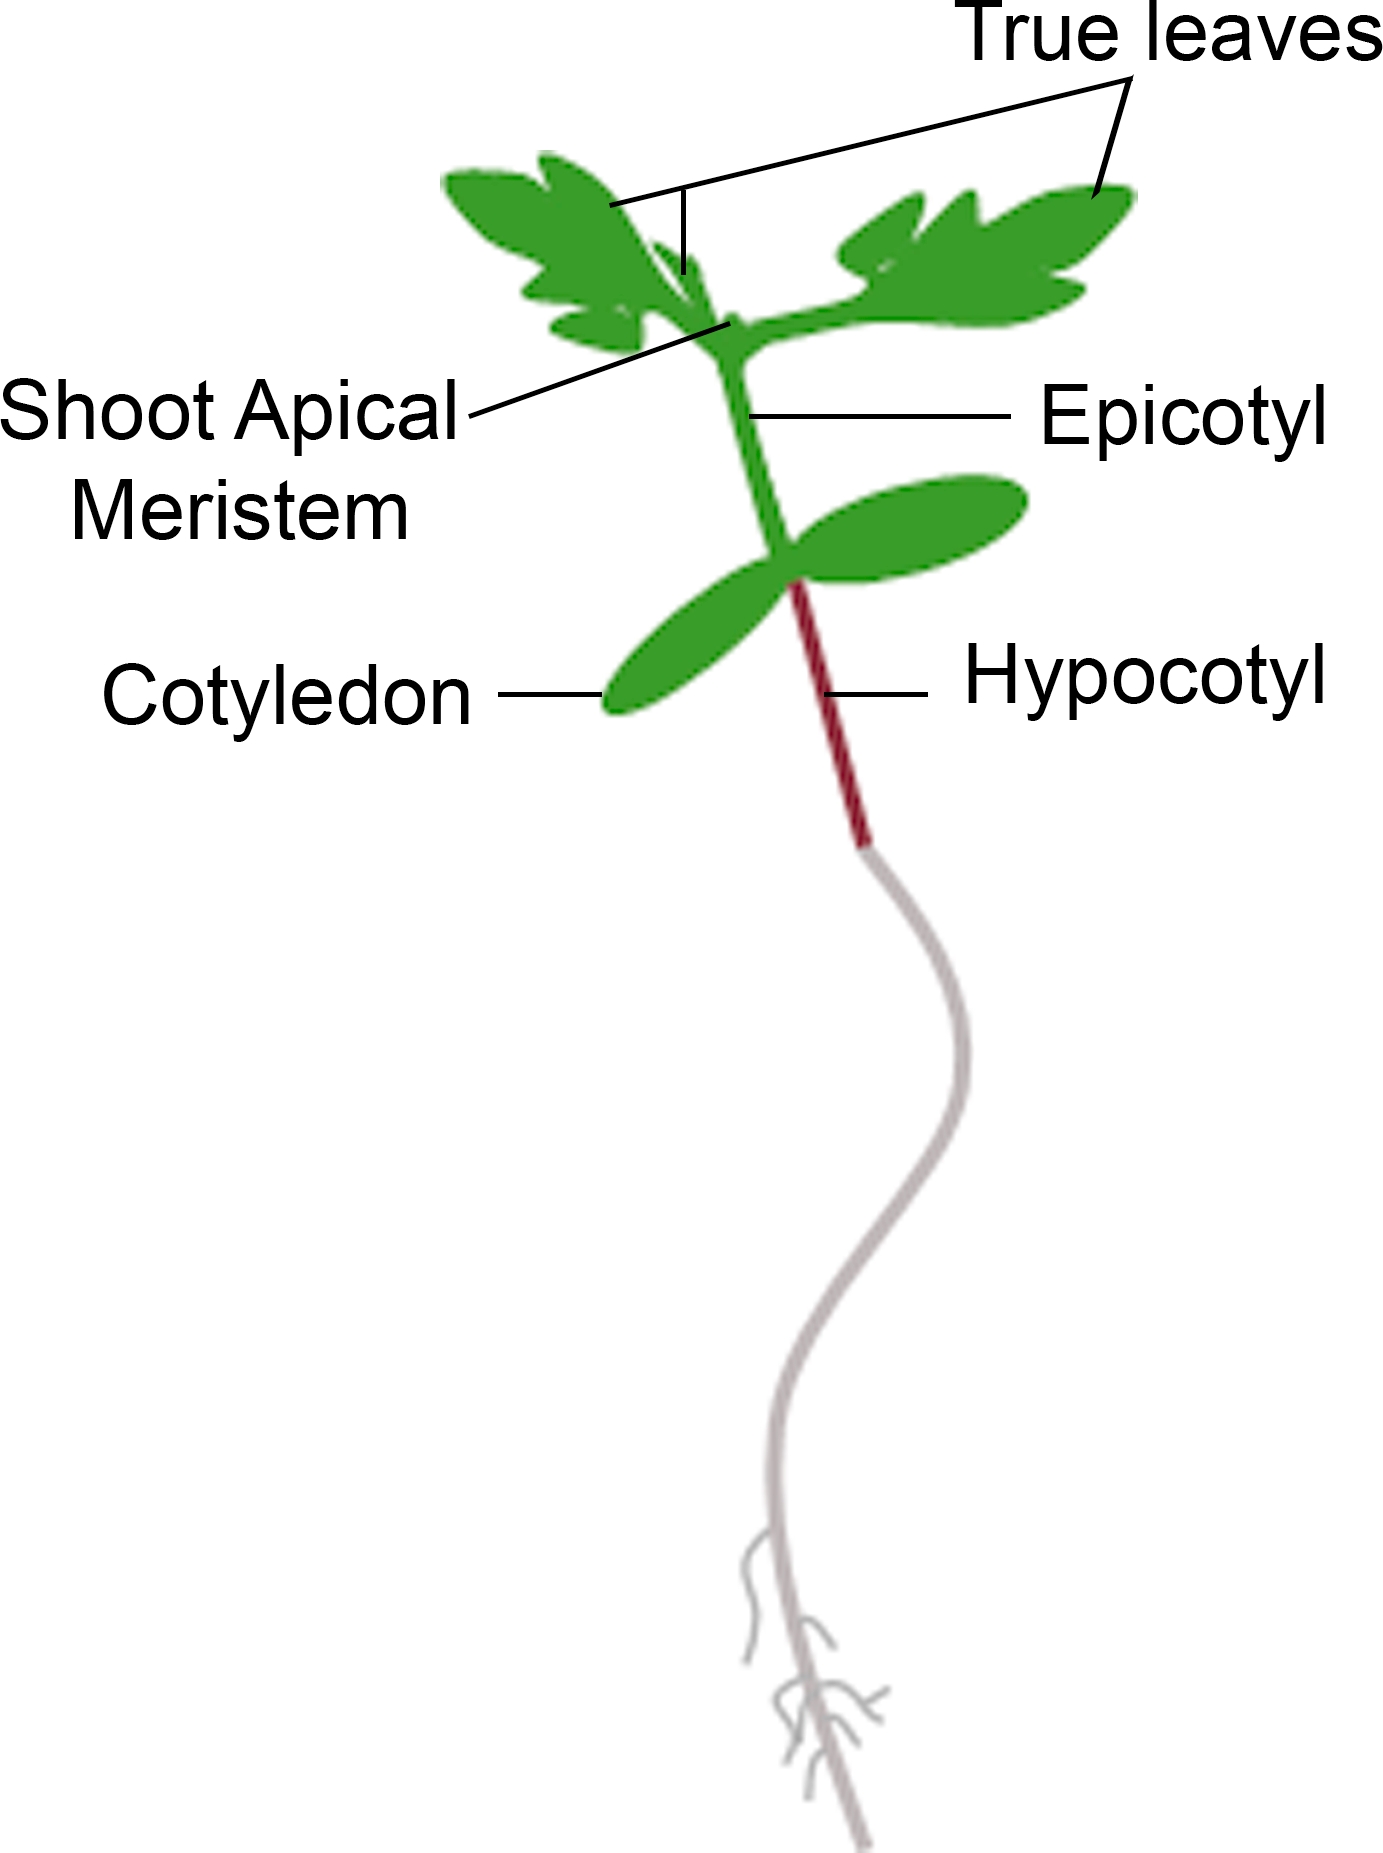
- Fide, fenotipleme için zaman dilimi içinde apikal meristem yeni büyüme görüntüler, bir hayatta kalma olarak saymak. Fide kahverengi apikal meristem varsa ve yeni, yeşil bitkisel büyüme görüntülemezse, bunu ölüm olarak sayar (Şekil 3).

Şekil 3: Domates fidesinin şematik gösterimi. Bir domates fidesi farklı parçaları, hipokotil, cotyledons, epikoyl, apikal meristem ateş ve gerçek yaprakları da dahil olmak üzere tasvir edilmiştir. Bu rakamın daha büyük bir sürümünü görüntülemek için lütfen buraya tıklayın.
- F2 haritalama popülasyonları gibi popülasyonlar için çok çeşitli direnç fenotipleri ile bir hastalık spektrumundaki kayıt fenotipleri(Şekil 4C).
- Fenotipleme için uygun pencereyi belirlemek için hastalık belirtileri ve ölüm görünümü için fidedikkatle dikkatle izleyin.

Şekil 4: Çeşitli genetik arka planlarda fide direnci ve ölüm için beklenen fenotiplerin şematik gösterimi. (A) RioGrande-PtoR fideleri ve yakın-isojenik çeşitleri RioGrande-PtoS PstDC3000 (OD600 = 0.005) + 0.015% sürfaktan ile sel 7 gün sonra görüntülenir. RioGrande-PtoR tutarlı direnç gösterir ve RioGrande-PtoS PstDC3000 ile enfeksiyona karşı tutarlı bir duyarlılık gösterir. Bu çizgiler ayrık ve ikili fenotiplere yol açar. (B) Solanum neorickii LA1329 gibi vahşi bir katılımın fideleri, PstT1 (OD600 = 0,0075) + %0,015 yüzey aktif madde ile su bastıktan 10 gün sonra gösterilir. Fideler fenotipik değişkenlik gösterirler ancak ikili fenotipler olarak kaydedilirler. Fenotipik değişkenlik miktarı ve fenotileme yöntemi (ikili direnç veya direnç spektrumu) test edilen katılıma bağlıdır. (C) Duyarlı çeşitlerin yabani katılımları geçerek oluşturulan haritalama popülasyonları F2 ayrıyaşayan popülasyonlarda daha geniş bir fenotip spektrumu gösterebilir. Bu durumda, bir spektrumüzerinde fide fenotipleri kaydetmek için en uygun olabilir. Bir haritalama popülasyonundan son derece duyarlı fideler PstT1 ile sular altında gün 7 gibi erken ölüm için fenotip olabilir, ve genellikle kahverengi apikal meristem göstermek, epiotil çok az uzantısı hayır, ve yeni, yeşil bitkisel büyüme. Duyarlı fidelerin apikal meristem daha fazla süre yeşil veya çok açık kahverengi kalabilir, ve epiotyl ve çok az bitkisel büyüme bazı uzantısı olabilir, hangi kahverengi döner ve tutuklamalar gün 10. Bireysel fideler, 14. Fideler daha sonra, yukarıda açıklanan fenotiplere göre zayıf, orta veya güçlü direnç gibi farklı direnç kategorilerine göre gruplandırılabilir. Bu rakamın daha büyük bir sürümünü görüntülemek için lütfen buraya tıklayın.
Sonuçlar
Fide direnci tayini kullanılarak çeşitlerive isojenik hatlarda PtoRaracılı bağışıklığın saptanması
Şekil 5, PstDC3000 ile sel bastıktan 7-10 gün sonra Moneymaker-PtoR ve Moneymaker-PtoS çeşitleri için temsili sonuçlar gösterir. Enfeksiyondan önce, 10 günlük fideler tam olarak ortaya çıktı ve genişletilmiş cotyledons ve ortaya çıkan ilk gerçek yaprakları gösterdi. Fideler 10 mM MgCl2 + %0.015...
Tartışmalar
Domates fidelerinde bu bakteriyel suşlara karşı direnci tespit etmek için optimize edilen PstDC3000 veya PstT1 ile sel aşısı için bir protokol tanımlanmıştır. Fide direnci tahtında optimum sonuçlar için, ampirik olarak belirlenen bakteri konsantrasyonu ve yüzey aktif konsantrasyonu da dahil olmak üzere çeşitli kritik parametreler vardır22. PstDC3000 için optik yoğunluk, Pto/Prf kümesini içeren dirençli bir çeşitte tam hayatta kalma ve ...
Açıklamalar
Yazarların açıklayacak bir şeyi yok.
Teşekkürler
Biz hastalık veya direnç sonuçları üzerinde medya hacminin etkisini test için Jamie Calma teşekkür ederiz. Lewis Lab'dan Dr. Maël Baudin ve Dr. Karl J. Scheiber'a el yazması hakkında yapıcı yorum ve önerilerde bulunduklarından dolayı teşekkür ederiz. Lewis laboratuvarında bitki bağışıklığı üzerine yapılan araştırmalar USDA ARS 2030-21000-046-00D ve 2030-21000-050-00D (JDL) ve NSF Biyolojik Bilimler Müdürlüğü IOS-1557661 (JDL) tarafından desteklendi.
Malzemeler
| Name | Company | Catalog Number | Comments |
| 3M Tape Micropore 1/2" x 10 YD CS 240 (1.25 cm x 9.1 m) | VWR International | 56222-182 | |
| 3mm borosilicate glass beads | Friedrich & Dimmock | GB3000B | |
| Bacto peptone | BD | 211677 | |
| Bacto agar | BD | 214010 | |
| Biophotometer Plus | Eppendorf | E952000006 | |
| Biosafety cabinet, class II type A2 | |||
| BRAND Disposable Plastic Cuvettes, Polystyrene | VWR International | 47744-642 | |
| Chenille Kraft Flat Wood Toothpicks | VWR International | 500029-808 | |
| cycloheximide | Research Products International | C81040-5.0 | |
| Dibasic potassium phosphate anhydrous, ACS grade | Fisher Scientific | P288-500 | |
| Dimethylformamide | |||
| Dissecting microscope (Magnification of at least 10x) | |||
| Ethanol - 190 Proof | |||
| Falcon polystyrene 96 well microplates, flat-bottom | Fisher Scientific | 08-772-3 | |
| Glass Alcohol Burner Wick | Fisher Scientific | S41898A / No. W-125 | |
| Glass Alcohol Burners | Fisher Scientific | S41898 / No. BO125 | |
| Glycerol ACS reagent | VWR International | EMGX0185-5 | |
| Kimberly-Clark™ Kimtech Science™ Kimwipes™ Delicate Task Wipers | Fisher Scientific | 06-666-A | |
| Magnesium chloride, ACS grade | VWR International | 97061-356 | |
| Magnesium sulfate heptahydrate, ACS grade | VWR International | 97062-130 | |
| Microcentrifuge tubes, 1.5 mL | |||
| Microcentrifuge tubes, 2.2 mL | |||
| Mini Beadbeater-96, 115 volt | Bio Spec Products Inc. | 1001 | |
| Murashige & Skoog, Basal Salts | Caisson Laboratories, Inc. | MSP01-50LT | |
| Pipet-Lite XLS LTS 8-CH Pipet 20-200uL | Rainin | L8-200XLS | |
| Pipet-Lite XLS LTS 8-CH Pipet 2-20uL | Rainin | L8-20XLS | |
| Polystyrene 100mm x 25mm sterile petri dish | VWR International | 89107-632 | |
| Polystyrene 150mm x 15mm sterile petri dish | Fisher Scientific | FB08-757-14 | |
| Polystyrene 150x15mm sterile petri dish | Fisher Scientific | 08-757-148 | |
| Pure Bright Germicidal Ultra Bleach 5.7% Available Chlorine (defined as 100% bleach) | Staples | 1013131 | |
| Rifampicin | Gold Biotechnology | R-120-25 | |
| Silwet L-77 (non-ionic organosilicone surfactant co-polymer C13H34O4Si3 surfactant) | Fisher Scientific | NCO138454 | |
| Tips LTS 20 μL 960/10 GPS-L10 | Rainin | 17005091 | |
| Tips LTS 250 μL 960/10 GPS-L250 | Rainin | 17005093 | |
| VWR dissecting forceps fine tip, 4.5" | VWR International | 82027-386 |
Referanslar
- Underwood, W., Melotto, M., He, S. Y. Role of plant stomata in bacterial invasion. Cell Microbiology. 9 (7), 1621-1629 (2007).
- Zipfel, C. Early molecular events in PAMP-triggered immunity. Current Opinion in Plant Biology. 12 (4), 414-420 (2009).
- Galan, J. E., Wolf-Watz, H. Protein delivery into eukaryotic cells by type III secretion machines. Nature. 444 (7119), 567-573 (2006).
- Lewis, J. D., Desveaux, D., Guttman, D. S. The targeting of plant cellular systems by injected type III effector proteins. Seminars in Cell and Developmental Biology. 20 (9), 1055-1063 (2009).
- Schreiber, K. J., Baudin, M., Hassan, J. A., Lewis, J. D. Die another day: molecular mechanisms of effector-triggered immunity elicited by type III secreted effector proteins. Seminars in Cell and Developmental Biology. 56, 124-133 (2016).
- Heath, M. C. Hypersensitive response-related death. Plant Molecular Biology. 44 (3), 321-334 (2000).
- Boyd, L. A., Ridout, C., O'Sullivan, D. M., Leach, J. E., Leung, H. Plant-pathogen interactions: disease resistance in modern agriculture. Trends in Genetics. 29 (4), 233-240 (2013).
- Pitblado, R. E., MacNeill, B. H. Genetic basis of resistance to Pseudomonas syringae pv. tomato in field tomatoes. Canadian Journal of Plant Pathology. 5 (4), 251-255 (1983).
- Pedley, K. F., Martin, G. B. Molecular basis of Pto-mediated resistance to bacterial speck disease in tomato. Annual Reviews of Phytopathology. 41, 215-243 (2003).
- Ronald, P. C., Salmeron, J. M., Carland, F. M., Mehta, A. Y., Staskawicz, B. J. The cloned avirulence gene AvrPto induces disease resistance in tomato cultivars containing the Pto resistance gene. Journal of Bacteriology. 174 (5), 1604-1611 (1992).
- Martin, G. B., et al. Map-based cloning of a protein kinase gene conferring disease resistance in tomato. Science. 262 (5138), 1432-1436 (1993).
- Salmeron, J. M., Barker, S. J., Carland, F. M., Mehta, A. Y., Staskawicz, B. J. Tomato mutants altered in bacterial disease resistance provide evidence for a new locus controlling pathogen recognition. Plant Cell. 6 (4), 511-520 (1994).
- Salmeron, J. M., et al. Tomato Prf is a member of the leucine-rich repeat class of plant disease resistance genes and lies embedded within the Pto kinase gene cluster. Cell. 86 (1), 123-133 (1996).
- Scofield, S. R., et al. Molecular basis of gene-for-gene specificity in bacterial speck disease of tomato. Science. 274 (5295), 2063-2065 (1996).
- Kunkeaw, S., Tan, S., Coaker, G. Molecular and evolutionary analyses of Pseudomonas syringae pv. tomato race 1. Molecular Plant-Microbe Interactions. 23 (4), 415-424 (2010).
- Cai, R., et al. The plant pathogen Pseudomonas syringae pv. tomato is genetically monomorphic and under strong selection to evade tomato immunity. PLoS Pathogens. 7 (8), 1002130 (2011).
- Almeida, N. F., et al. A draft genome sequence of Pseudomonas syringae pv. tomato T1 reveals a type III effector repertoire significantly divergent from that of Pseudomonas syringae pv. tomato DC3000. Molecular Plant-Microbe Interactions. 22 (1), 52-62 (2009).
- Lin, N. C., Abramovitch, R. B., Kim, Y. J., Martin, G. B. Diverse AvrPtoB homologs from several Pseudomonas syringae pathovars elicit Pto-dependent resistance and have similar virulence activities. Applied and Environmental Microbiology. 72 (1), 702-712 (2006).
- Rose, L. E., Langley, C. H., Bernal, A. J., Michelmore, R. W. Natural variation in the Pto pathogen resistance gene within species of wild tomato (Lycopersicon). I. Functional analysis of Pto alleles. Genetics. 171 (1), 345-357 (2005).
- Thapa, S. P., Miyao, E. M., Davis, R. M., Coaker, G. Identification of QTLs controlling resistance to Pseudomonas syringae pv. tomato race 1 strains from the wild tomato Solanum habrochaites LA1777. Theoretical and Applied Genetics. 128 (4), 681-692 (2015).
- Bao, Z. L., et al. Identification of a candidate gene in Solanum habrochaites for resistance to a race 1 strain of Pseudomonas syringae pv. tomato. Plant Genome. 8 (3), 1-15 (2015).
- Hassan, J. A., Zhou, Y. J., Lewis, J. D. A rapid seedling resistance assay identifies wild tomato lines that are resistant to Pseudomonas syringae pv. tomato race 1. Molecular Plant-Microbe Interactions. 30 (9), 701-709 (2017).
- King, E. O., Ward, M. K., Raney, D. E. Two simple media for the demonstration of pyocyanin and fluorescin. Journal of Laboratory and Clinical Medicine. 44 (2), 301-307 (1954).
- Uppalapati, S. R., et al. Pathogenicity of Pseudomonas syringae pv. tomato on tomato seedlings: phenotypic and gene expression analyses of the virulence function of coronatine. Molecular Plant-Microbe Interactions. 21 (4), 383-395 (2008).
- Bhardwaj, V., Meier, S., Petersen, L. N., Ingle, R. A., Roden, L. C. Defence responses of Arabidopsis thaliana to infection by Pseudomonas syringae are regulated by the circadian clock. PLoS One. 6 (10), 26968 (2011).
- Lu, H., McClung, C. R., Zhang, C. Tick tock: circadian regulation of plant innate immunity. Annual Review of Phytopathology. 55, 287-311 (2017).
- Wang, W., et al. Timing of plant immune responses by a central circadian regulator. Nature. 470 (7332), 110-114 (2011).
Erratum
Formal Correction: Erratum: High-Throughput Identification of Resistance to Pseudomonas syringae pv. Tomato in Tomato using Seedling Flood Assay
Posted by JoVE Editors on 10/18/2023. Citeable Link.
An erratum was issued for: High-Throughput Identification of Resistance to Pseudomonas syringae pv. Tomato in Tomato using Seedling Flood Assay. The Introduction, Protocol, Representative Results and Discussion sections were updated.
The last paragraph of the Introduction section was updated from:
In the seedling flood assay described in this protocol, tomato seedlings are grown on Petri dishes of sterile Murashige and Skoog (MS) media for 10 days and then are flooded with an inoculum containing the bacteria of interest and a surfactant. Following flooding, seedlings can be quantitatively evaluated for disease resistance via bacterial growth assays. Additionally, seedling survival or death can act as a discrete resistance or disease phenotype 7–14 days after flooding. This approach offers a high-throughput alternative for screening large numbers of wild tomato accessions for resistance to Pst race 1 strains, such as Pst strain T1 (PstT1), and can easily be adapted to other bacterial strains of interest.
to:
In the seedling flood assay described in this protocol, tomato seedlings are grown on Petri dishes of sterile Murashige and Skoog (MS) media for 10 days and then are flooded with an inoculum containing the bacteria of interest and a surfactant. Following flooding, seedlings can be quantitatively evaluated for disease resistance via bacterial growth assays. Additionally, seedling survival or death can act as a discrete resistance or disease phenotype 7–14 days after flooding. This approach offers a high-throughput alternative for screening large numbers of wild tomato accessions for resistance to Pst race 1 strains, such as Pst strain 19 (Pst19), and can easily be adapted to other bacterial strains of interest.
Step 4.8 of the Protocol section was updated from:
- After 1 h, transfer the bottle to the biosafety cabinet and under aseptic conditions, add 1,600 µL of sterile 1 M MgSO4, and appropriate antibiotics to the media.
NOTE: For rifampicin resistant strains PstDC3000 and PstT1, use rifampicin dissolved in dimethylformamide at a final concentration of 50 µg/mL. Use cycloheximide dissolved in ethanol at a final concentration of 50 µg/mL to prevent fungal growth on the plates.
to:
- After 1 h, transfer the bottle to the biosafety cabinet and under aseptic conditions, add 1,600 µL of sterile 1 M MgSO4, and appropriate antibiotics to the media.
NOTE: For rifampicin resistant strains PstDC3000 and Pst19, use rifampicin dissolved in dimethylformamide at a final concentration of 50 µg/mL. Use cycloheximide dissolved in ethanol at a final concentration of 50 µg/mL to prevent fungal growth on the plates.
Step 5.2 of the Protocol section was updated from:
- Patch bacteria (i.e., PstT1) from a glycerol stock onto KB agar with appropriate antibiotics (section 4).
to:
- Patch bacteria (i.e., Pst19) from a glycerol stock onto KB agar with appropriate antibiotics (section 4).
Step 5.6 of the Protocol section was updated from:
- For PstT1, incubate the KB plate at 28 ˚C for 48 h prior to using bacteria in the flood experiment.
to:
- For Pst19, incubate the KB plate at 28 ˚C for 48 h prior to using bacteria in the flood experiment.
Step 6 of the Protocol section was updated from:
6. Preparation of PstT1 inoculum
to
6. Preparation of Pst19 inoculum
Step 6.2 of the Protocol section was updated from:
- Perform serial dilutions using sterile 10 mM MgCl2 solution in the biosafety cabinet. For PstT1, use a spectrophotometer to make inoculum with a starting concentration of OD600 = 0.1.
to:
- Perform serial dilutions using sterile 10 mM MgCl2 solution in the biosafety cabinet. For Pst19, use a spectrophotometer to make inoculum with a starting concentration of OD600 = 0.1.
Step 6.3 of the Protocol section was updated from:
- For PstT1, make a 1/10 dilution from the initial resuspension at OD600 = 0.1 to obtain a serial dilution at a concentration of OD600 = 0.01.
to:
- For Pst19, make a 1/10 dilution from the initial resuspension at OD600 = 0.1 to obtain a serial dilution at a concentration of OD600 = 0.01.
Step 8.3 of the Protocol section was updated from:
- Set a timer for 3 min. Measure 6 mL of final inoculum (PstT1 OD600 = 0.0075 [section 6] or PstDC3000 OD600 = 0.005 [section 7]) and transfer 6 mL of inoculum to each plate with the 10-day-old seedlings.
to:
- Set a timer for 3 min. Measure 6 mL of final inoculum (Pst19 OD600 = 0.0075 [section 6] or PstDC3000 OD600 = 0.005 [section 7]) and transfer 6 mL of inoculum to each plate with the 10-day-old seedlings.
Step 8.11 of the Protocol section was updated from:
- Phenotype after 7–10 days for PstDC3000 or 10–14 days for PstT1 (section 11). If carrying out bacterial growth assays, collect leaf tissue after 4 days (sections 9 and 10) and then phenotype (section 11). Alternatively, perform phenotypic analysis and bacterial growth assays on separate sets of plants.
to:
- Phenotype after 7–10 days for PstDC3000 or 10–14 days for Pst19 (section 11). If carrying out bacterial growth assays, collect leaf tissue after 4 days (sections 9 and 10) and then phenotype (section 11). Alternatively, perform phenotypic analysis and bacterial growth assays on separate sets of plants.
Step 10.7 of the Protocol section was updated from:
- After obtaining colony counts (Figure 2B), normalize the counts to 0.01 g of tissue for seedlings and convert to log bacterial growth (Table 1).
NOTE: The average mass of one Moneymaker-PtoS cotyledon is 0.01 g and is empirically determined22.
| Genotype1 Column A | Tissue Weight (g) Column B | # of Colonies in a spot Column C | Dilution factor for spot2 Column D | Adjusted # of Colonies3 Column E | Dilution factor for serial dilution Column F | Total # of Colonies Column G (cfu/0.01 g)4 | Average # of Colonies (cfu/0.01 g) Column H | Average Log Growth (cfu/0.01 g (log10)) Column I |
| Sample 1 | 0.004 g | 10 | 200 | calculated as: (C2 x 0.01 g) / B2 = 25 | 1000 | calculated as: (D2 x E2 x F2) = 5000000 | average for sample 1 through last sample: (ie. average G1:G3) = 7000000 | log of average ie. log(H2) = 6.85 |
| Sample 2 | 0.003 g | 15 | 200 | 50 | 1000 | 10000000 | ||
| Sample 3 | 0.002 g | 6 | 200 | 30 | 1000 | 6000000 | ||
| 1Data shown for 3 samples | ||||||||
| 2Based on plating 5 µL x 200 for 1 mL | ||||||||
| 3Cotyledons are too small to core so colony counts were normalized to 0.01 g of tissue based on the average mass of one MoneyMaker-PtoS cotyledon (data not shown) | ||||||||
| 4Adjusted per mL based on volume plated | ||||||||
Table 1: Sample calculations for seedling bacterial growth assay. Sample calculations demonstrate how to normalize bacterial counts and determine log bacterial growth.
to:
- After obtaining colony counts (Figure 2B), normalize the counts to 0.1 g of tissue for seedlings and convert to log bacterial growth (Table 1).
NOTE: The average mass of one Moneymaker-PtoS cotyledon is 0.1 g and is empirically determined22.
| Genotype1 Column A | Tissue Weight (g) Column B | # of Colonies in a spot Column C | Dilution factor for spot2 Column D | Adjusted # of Colonies3 Column E | Dilution factor for serial dilution Column F | Total # of Colonies Column G (cfu/0.01 g)4 | Average # of Colonies (cfu/0.01 g) Column H | Average Log Growth (cfu/0.1 g (log10)) Column I |
| Sample 1 | 0.04 g | 10 | 200 | calculated as: (C2 x 0.1 g) / B2 = 25 | 1000 | calculated as: (D2 x E2 x F2) = 5000000 | average for sample 1 through last sample: (ie. average G1:G3) = 7000000 | log of average ie. log(H2) = 6.85 |
| Sample 2 | 0.03 g | 15 | 200 | 50 | 1000 | 10000000 | ||
| Sample 3 | 0.02 g | 6 | 200 | 30 | 1000 | 6000000 | ||
| 1Data shown for 3 samples | ||||||||
| 2Based on plating 5 µL x 200 for 1 mL | ||||||||
| 3Cotyledons are too small to core so colony counts were normalized to 0.1 g of tissue based on the average mass of one MoneyMaker-PtoS cotyledon (data not shown) | ||||||||
| 4Adjusted per mL based on volume plated | ||||||||
Table 1: Sample calculations for seedling bacterial growth assay. Sample calculations demonstrate how to normalize bacterial counts and determine log bacterial growth.
Step 11.3 of the Protocol section was updated from:
- Phenotype plants infected with PstT1 at 10–14 days after flood inoculation.
to:
- Phenotype plants infected with Pst19 at 10–14 days after flood inoculation.
Figure 4 in the Protocol section was updated from:
Figure 4: Schematic representation of expected phenotypes for seedling resistance and death in various genetic backgrounds. (A) Seedlings of Rio Grande-PtoR and the near-isogenic cultivar Rio Grande-PtoS are displayed 7 days after flooding with PstDC3000 (OD600 = 0.005) + 0.015% surfactant. Rio Grande-PtoR displays consistent resistance, and Rio Grande-PtoS displays consistent susceptibility to infection with PstDC3000. These lines give rise to discrete and binary phenotypes. (B) Seedlings of a wild accession, such as Solanum neorickii LA1329, are shown 10 days after flooding with PstT1 (OD600 = 0.0075) + 0.015% surfactant. Seedlings display phenotypic variability but were recorded as binary phenotypes. The amount of phenotypic variability and the method of phenotyping (binary resistance or resistance spectrum) will depend on the particular accession tested. (C) Mapping populations generated by outcrossing wild accessions to susceptible cultivars may display a wider spectrum of phenotypes in F2 segregating populations. In this case, it may be most appropriate to record seedling phenotypes on a spectrum. Highly susceptible seedlings from a mapping population may be phenotyped for death as early as day 7 when flooded with PstT1, and typically show a brown apical meristem, no to very little extension of the epicotyl, and no new, green vegetative growth. The apical meristem of susceptible seedlings may stay green or very light brown for more time, and there may be some extension of the epicotyl and very little vegetative growth, which turns brown and arrests by day 10. Individual seedlings can be phenotyped for resistance based on the amount of new and ongoing vegetative growth by day 14. Seedlings can then be grouped based on the phenotypes described above into different categories of resistance such as weak, medium, or strong resistance. Please click here to view a larger version of this figure.
to:
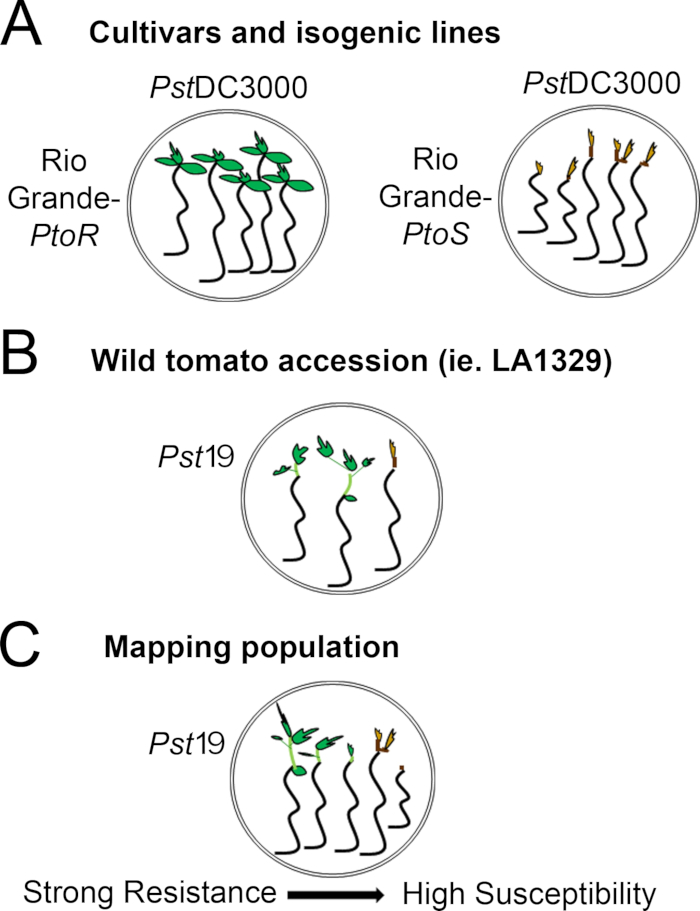
Figure 4: Schematic representation of expected phenotypes for seedling resistance and death in various genetic backgrounds. (A) Seedlings of Rio Grande-PtoR and the near-isogenic cultivar Rio Grande-PtoS are displayed 7 days after flooding with PstDC3000 (OD600 = 0.005) + 0.015% surfactant. Rio Grande-PtoR displays consistent resistance, and Rio Grande-PtoS displays consistent susceptibility to infection with PstDC3000. These lines give rise to discrete and binary phenotypes. (B) Seedlings of a wild accession, such as Solanum neorickii LA1329, are shown 10 days after flooding with Pst19 (OD600 = 0.0075) + 0.015% surfactant. Seedlings display phenotypic variability but were recorded as binary phenotypes. The amount of phenotypic variability and the method of phenotyping (binary resistance or resistance spectrum) will depend on the particular accession tested. (C) Mapping populations generated by outcrossing wild accessions to susceptible cultivars may display a wider spectrum of phenotypes in F2 segregating populations. In this case, it may be most appropriate to record seedling phenotypes on a spectrum. Highly susceptible seedlings from a mapping population may be phenotyped for death as early as day 7 when flooded with Pst19, and typically show a brown apical meristem, no to very little extension of the epicotyl, and no new, green vegetative growth. The apical meristem of susceptible seedlings may stay green or very light brown for more time, and there may be some extension of the epicotyl and very little vegetative growth, which turns brown and arrests by day 10. Individual seedlings can be phenotyped for resistance based on the amount of new and ongoing vegetative growth by day 14. Seedlings can then be grouped based on the phenotypes described above into different categories of resistance such as weak, medium, or strong resistance. Please click here to view a larger version of this figure.
The second paragraph of the Representative Results section was updated from:
Phenotypic screening of wild accessions using the seedling resistance assay
Figure 6 shows representative results for seedlings of susceptible and resistant accessions 10–14 days after flooding with PstT1. Susceptible accessions include RG-PtoR, S. pimpinellifolium LA1375, and S. pimpinellifolium LA1606, and resistant accessions include S. neorickii LA1329. Ten-day-old seedlings were flooded with 10 mM MgCl2 + 0.015% surfactant as a negative control, and PstT1 at an optical density of 0.0075 + 0.015% surfactant. The seedlings were phenotyped at least 10 days after flooding, as PstT1-infected seedlings died more slowly than PstDC3000-infected seedlings. Mock-inoculated seedlings were green, healthy, and actively growing. This control is important to ensure that the accessions are not sensitive to the concentration of surfactant, and to ensure there is no bacterial contamination. Susceptible accessions (Rio Grande-PtoR [n = 7], S. pimpinellifolium LA1375 [n = 7], and S. pimpinellifolium LA1606 [n = 5]) were dead, had brown apical meristems, and lacked new growth 10–14 days after inoculation with PstT1. In contrast, two S. neorickii LA1329 (n = 3) seedlings displayed a high level of new, green growth and survived infection with PstT1 (Figure 6). Three LA1329 seedlings did not germinate. Typically, 5–7 individuals were screened for each accession in a primary screen to determine the prevalence of resistance in the population. When a more genetically complex wild accession, such as LA1329, is flooded with PstT1, the resistance phenotypes display slightly more variability among individual seedlings, compared to Moneymaker-PtoR treated with PstDC3000. However, the resistance phenotypes were usually less variable than those seen in F2 mapping populations. Thus, binary phenotyping criteria was used for LA1329.
to:
Phenotypic screening of wild accessions using the seedling resistance assay
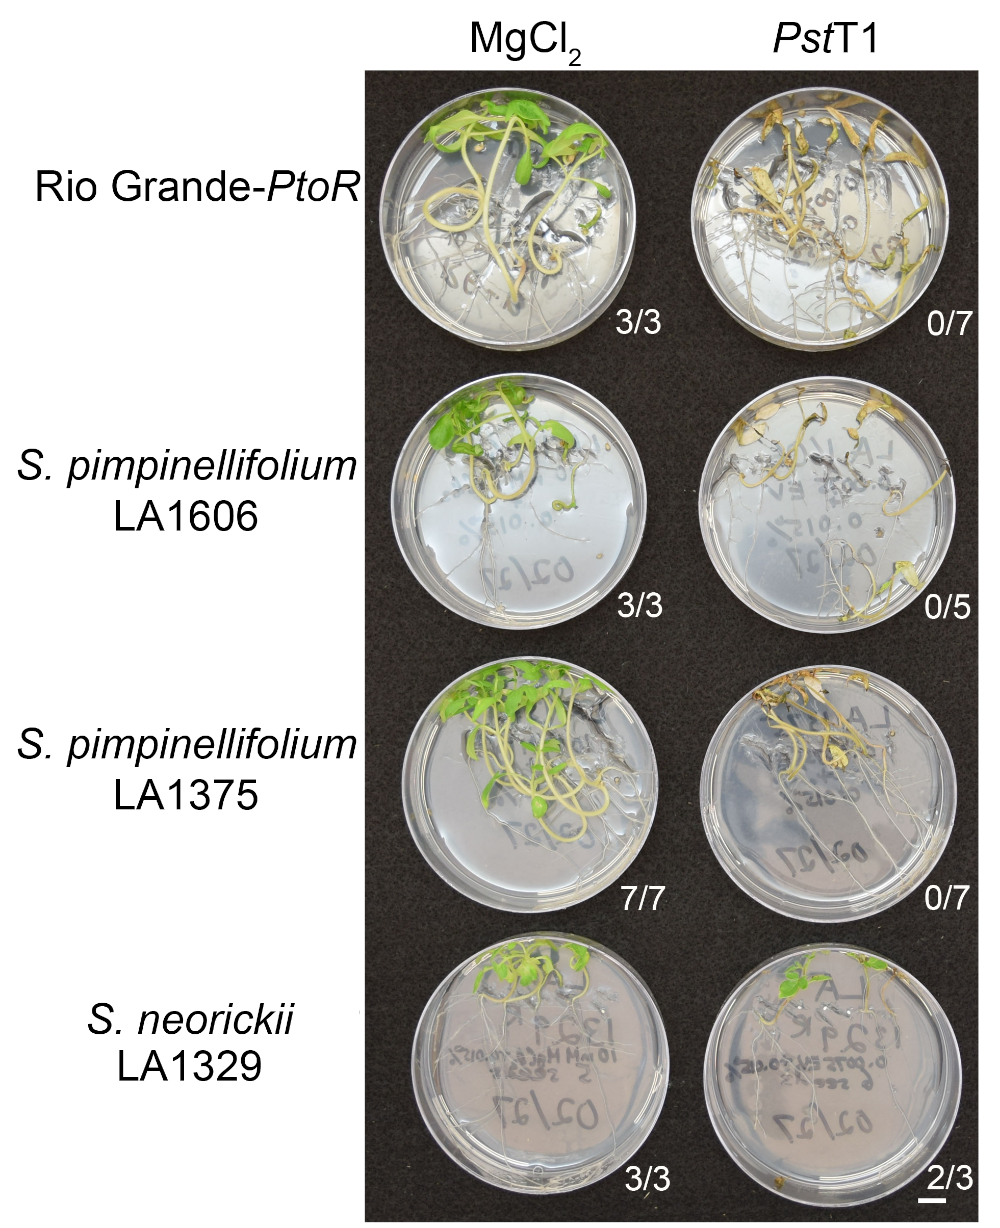
Figure 6 shows representative results for seedlings of susceptible and resistant accessions 10–14 days after flooding with Pst19. Susceptible accessions include RG-PtoR, S. pimpinellifolium LA1375, and S. pimpinellifolium LA1606, and resistant accessions include S. neorickii LA1329. Ten-day-old seedlings were flooded with 10 mM MgCl2 + 0.015% surfactant as a negative control, and Pst19 at an optical density of 0.0075 + 0.015% surfactant. The seedlings were phenotyped at least 10 days after flooding, as Pst19-infected seedlings died more slowly than PstDC3000-infected seedlings. Mock-inoculated seedlings were green, healthy, and actively growing. This control is important to ensure that the accessions are not sensitive to the concentration of surfactant, and to ensure there is no bacterial contamination. Susceptible accessions (Rio Grande-PtoR [n = 7], S. pimpinellifolium LA1375 [n = 7], and S. pimpinellifolium LA1606 [n = 5]) were dead, had brown apical meristems, and lacked new growth 10–14 days after inoculation with Pst19. In contrast, two S. neorickii LA1329 (n = 3) seedlings displayed a high level of new, green growth and survived infection with Pst19 (Figure 6). Three LA1329 seedlings did not germinate. Typically, 5–7 individuals were screened for each accession in a primary screen to determine the prevalence of resistance in the population. When a more genetically complex wild accession, such as LA1329, is flooded with Pst19, the resistance phenotypes display slightly more variability among individual seedlings, compared to Moneymaker-PtoR treated with PstDC3000. However, the resistance phenotypes were usually less variable than those seen in F2 mapping populations. Thus, binary phenotyping criteria was used for LA1329.
Figure 6 in the Representative Results section was updated from:
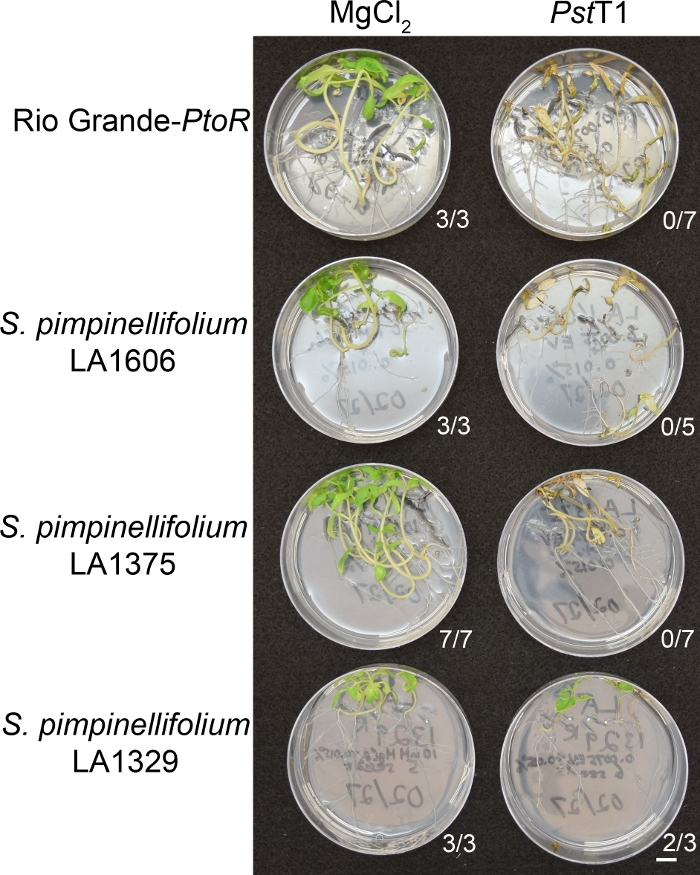
Figure 6: Phenotypic characterization of resistance or disease symptoms 10–14 days post-infection in wild accessions. Rio Grande-PtoR, S. pimpinellifolium LA1606, S. pimpinellifolium LA1375 and S. neorickii LA1329 tomato seedlings were grown on 0.5x MS plates for 10 days, and then flooded with PstT1 (OD600 = 0.0075) + 0.015% surfactant. The number of surviving seedlings for each wild accession out of the total number tested is shown. Scale bar = 1 cm. Please click here to view a larger version of this figure.
to:
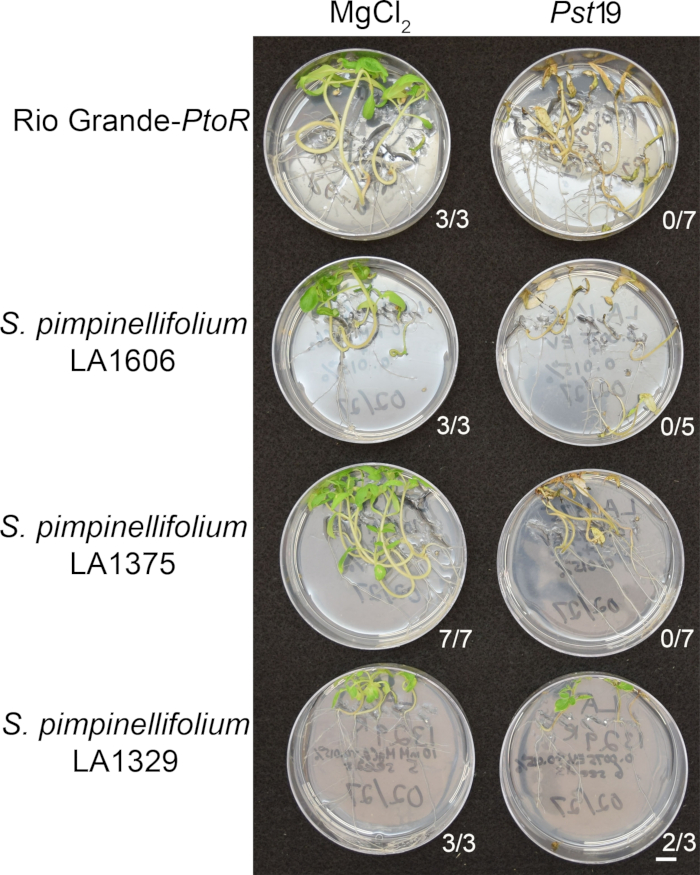
Figure 6: Phenotypic characterization of resistance or disease symptoms 10–14 days post-infection in wild accessions. Rio Grande-PtoR, S. pimpinellifolium LA1606, S. pimpinellifolium LA1375 and S. neorickii LA1329 tomato seedlings were grown on 0.5x MS plates for 10 days, and then flooded with Pst19 (OD600 = 0.0075) + 0.015% surfactant. The number of surviving seedlings for each wild accession out of the total number tested is shown. Scale bar = 1 cm. Please click here to view a larger version of this figure.
The third paragraph of the Representative Results section was updated from:
Quantitative assessment of bacterial growth using the seedling flood assay
To confirm that the observed resistance in LA1329 to PstT1 resulted in lower bacterial growth, bacterial growth assays were carried out in tomato seedlings. The level of PstT1 growth in Moneymaker-PtoS and S. neorickii LA1329 was determined 4 days post-infection. Moneymaker-PtoS is a near-isogenic line with consistent susceptibility among individual seedlings. Wild accessions such as S. neorickii LA1329 are often more genetically complex. LA1329 displays approximately 60% resistance to PstT1 across the population22. Because seedlings may drop their cotyledons after infection, one seedling was grown on each plate to correlate bacterial growth in the harvested cotyledon with overall seedling survival or death as determined phenotypically at least 10 days after flooding. The bacterial counts on day 4 for each seedling were normalized to 0.01 g of tissue and converted to log growth (CFU/0.01 g(log10)). Log growth for phenotypically resistant LA1329 seedlings (LA1329RES) or phenotypically susceptible seedlings (LA1329SUS) were separately pooled and compared to each other and the susceptible cultivar Moneymaker-PtoS. For example, there was a 1.7 log difference in bacterial growth between LA1329RES (log 6.3) and LA1329SUS (log 8.0), and a 1.6 log difference between LA1329RES (log 6.3) and Moneymaker-PtoS (log 7.9) (Figure 7). Therefore, phenotypic resistance correlated with quantitative resistance in the seedling assays.
to:
Quantitative assessment of bacterial growth using the seedling flood assay
To confirm that the observed resistance in LA1329 to Pst19 resulted in lower bacterial growth, bacterial growth assays were carried out in tomato seedlings. The level of Pst19 growth in Moneymaker-PtoS and S. neorickii LA1329 was determined 4 days post-infection. Moneymaker-PtoS is a near-isogenic line with consistent susceptibility among individual seedlings. Wild accessions such as S. neorickii LA1329 are often more genetically complex. LA1329 displays approximately 60% resistance to Pst19 across the population22. Because seedlings may drop their cotyledons after infection, one seedling was grown on each plate to correlate bacterial growth in the harvested cotyledon with overall seedling survival or death as determined phenotypically at least 10 days after flooding. The bacterial counts on day 4 for each seedling were normalized to 0.01 g of tissue and converted to log growth (CFU/0.01 g(log10)). Log growth for phenotypically resistant LA1329 seedlings (LA1329RES) or phenotypically susceptible seedlings (LA1329SUS) were separately pooled and compared to each other and the susceptible cultivar Moneymaker-PtoS. For example, there was a 1.7 log difference in bacterial growth between LA1329RES (log 6.3) and LA1329SUS (log 8.0), and a 1.6 log difference between LA1329RES (log 6.3) and Moneymaker-PtoS (log 7.9) (Figure 7). Therefore, phenotypic resistance correlated with quantitative resistance in the seedling assays.
Figure 7 in the Representative Results section was updated from:
x
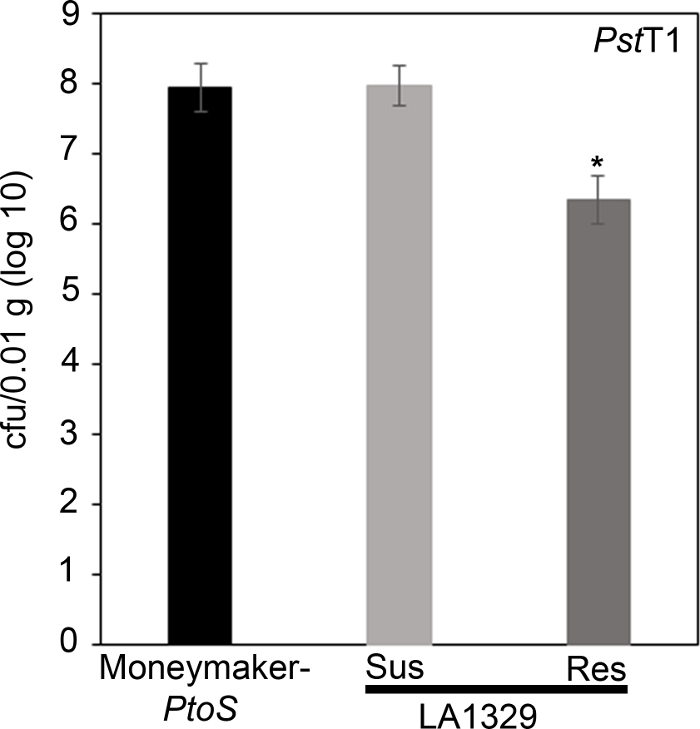
Figure 7: Resistant Solanum neorickii LA1329 seedlings support lower bacterial growth than Moneymaker-PtoS or susceptible S. neorickii LA1329. Bacterial counts were determined 4 days post-inoculation from S. neorickii LA1329 (n = 14) and Moneymaker-PtoS (n = 10) seedlings infected with PstT1 and normalization was performed to 0.01 g of tissue. For LA1329, the two phenotypic groups, susceptible (SUS) or resistant (RES), were observed and counted separately. Above the bar * = statistically significant difference determined by a one-factor analysis of variance. A general linear model procedure (p < 0.001) followed by a multiple comparison of means using Tukey's post hoc test was used. Error bars = standard error. The figure indicates one representative experiment. Please click here to view a larger version of this figure.
x
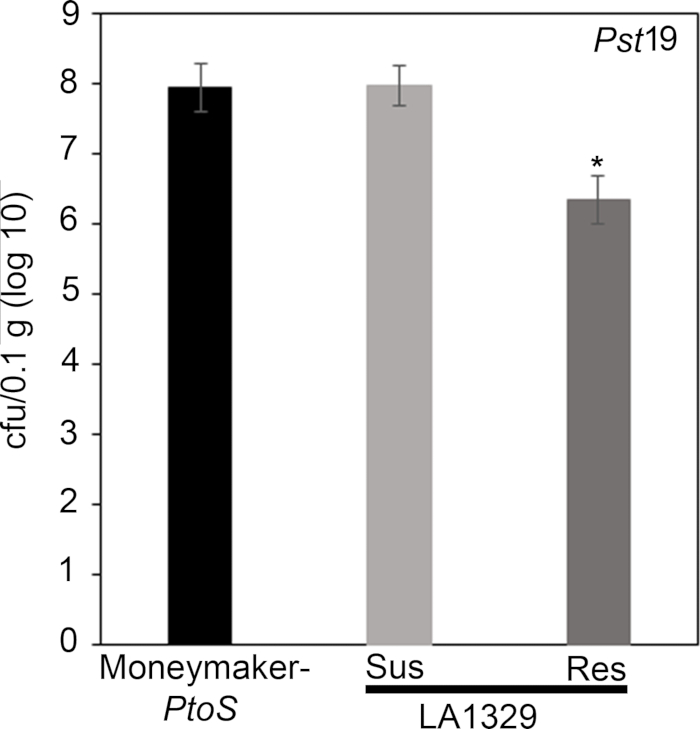
Figure 7: Resistant Solanum neorickii LA1329 seedlings support lower bacterial growth than Moneymaker-PtoS or susceptible S. neorickii LA1329. Bacterial counts were determined 4 days post-inoculation from S. neorickii LA1329 (n = 14) and Moneymaker-PtoS (n = 10) seedlings infected with Pst19 and normalization was performed to 0.1 g of tissue. For LA1329, the two phenotypic groups, susceptible (SUS) or resistant (RES), were observed and counted separately. Above the bar * = statistically significant difference determined by a one-factor analysis of variance. A general linear model procedure (p < 0.001) followed by a multiple comparison of means using Tukey's post hoc test was used. Error bars = standard error. The figure indicates one representative experiment. Please click here to view a larger version of this figure.
The first paragraph of the Discussion section was updated from:
A protocol for flood inoculation with PstDC3000 or PstT1 optimized to detect resistance to these bacterial strains in tomato seedlings is described. There are several critical parameters for optimal results in the seedling resistance assay, including bacterial concentration and surfactant concentration, which were empirically determined22. For PstDC3000, the optical density was optimized to achieve complete survival on a resistant cultivar containing the Pto/Prf cluster and complete death on a susceptible cultivar lacking the Pto/Prf cluster22. For a strain such as PstT1, where there are no known resistant varieties, the optical density was optimized to be the lowest possible for consistent and complete plant death22. Uppalapati et al.24 designed a tomato seedling assay to investigate the pathogenesis of PstDC3000 and the virulence function of coronatine. In this virulence assay, infections were performed using bacteria concentrated to an OD600 of 0.124, 20x higher than the optical density of strains used in our resistance assay. Recognition of PstDC3000 effectors AvrPto and AvrPtoB in tomato seedlings carrying the Pto/Prf gene cluster results in ETI and a macroscopic HR22. In the context of a strong immune response such as ETI, a lower bacterial titer was used for PstDC3000 to avoid overwhelming genetic resistance from the Pto/Prf gene cluster22. In addition, these results suggest that a high bacterial concentration could overwhelm weaker immune responses such as PTI or quantitative partial resistance, where multiple genes contribute to the overall phenotype. Surfactant is necessary for the bacteria to adhere to the leaf surface; however, high concentrations can cause chlorosis of the leaf22. We previously tested a range of surfactant concentrations to empirically determine the ideal concentration in 10-day-old tomato seedlings22. When testing new species that may differ in their sensitivity to surfactant, the surfactant concentration should be optimized to identify a concentration that does not cause damage or chlorosis in the absence of bacteria. Appropriate assay conditions will require optimization of a surfactant concentration that does not cause damage, and a bacterial concentration that causes disease in all susceptible controls.
to:
A protocol for flood inoculation with PstDC3000 or Pst19 optimized to detect resistance to these bacterial strains in tomato seedlings is described. There are several critical parameters for optimal results in the seedling resistance assay, including bacterial concentration and surfactant concentration, which were empirically determined22. For PstDC3000, the optical density was optimized to achieve complete survival on a resistant cultivar containing the Pto/Prf cluster and complete death on a susceptible cultivar lacking the Pto/Prf cluster22. For a strain such as Pst19, where there are no known resistant varieties, the optical density was optimized to be the lowest possible for consistent and complete plant death22. Uppalapati et al.24 designed a tomato seedling assay to investigate the pathogenesis of PstDC3000 and the virulence function of coronatine. In this virulence assay, infections were performed using bacteria concentrated to an OD600 of 0.124, 20x higher than the optical density of strains used in our resistance assay. Recognition of PstDC3000 effectors AvrPto and AvrPtoB in tomato seedlings carrying the Pto/Prf gene cluster results in ETI and a macroscopic HR22. In the context of a strong immune response such as ETI, a lower bacterial titer was used for PstDC3000 to avoid overwhelming genetic resistance from the Pto/Prf gene cluster22. In addition, these results suggest that a high bacterial concentration could overwhelm weaker immune responses such as PTI or quantitative partial resistance, where multiple genes contribute to the overall phenotype. Surfactant is necessary for the bacteria to adhere to the leaf surface; however, high concentrations can cause chlorosis of the leaf22. We previously tested a range of surfactant concentrations to empirically determine the ideal concentration in 10-day-old tomato seedlings22. When testing new species that may differ in their sensitivity to surfactant, the surfactant concentration should be optimized to identify a concentration that does not cause damage or chlorosis in the absence of bacteria. Appropriate assay conditions will require optimization of a surfactant concentration that does not cause damage, and a bacterial concentration that causes disease in all susceptible controls.
The third paragraph of the Discussion section was updated from:
Pst is a foliar pathogen that preferentially colonizes the aerial parts of tomato seedlings, including the cotyledons24 (Figure 3). Therefore, qualitative phenotyping in the seedling flood assay focuses on growth and disease symptoms in aerial portions of the seedling, and tissue for the bacterial growth assay is sampled from the cotyledons for quantitative analysis. After flood inoculation, seedlings may die within 7–10 days after inoculation with PstDC3000 or 10–14 days after inoculation with PstT1, as discussed in section 11. Seedling death is visualized by a brown apical meristem, arrested epicotyl elongation, and/or arrested vegetative growth. If different bacterial strains are used, the timing will have to be empirically determined. In addition, the progression of disease on control plants should be monitored daily after flooding until a consistent time frame from the onset of disease symptoms to seedling death can be identified. Depending on the genotypes and treatments used in the flood assay, seedling phenotypes can be recorded as binary phenotypes or on a disease spectrum (Figure 4). A broader spectrum of phenotypes may be observed when flood inoculating F2 mapping populations from wild tomato accessions crossed to susceptible cultivars (Figure 4C). It may be best to phenotype segregating populations on a disease spectrum depending on how quickly the seedling dies and the degree of new vegetative growth and branching (Figure 4C). The seedling flood assay can also be used in conjunction with the seedling bacterial growth assay to quantitatively assess levels of bacterial growth associated with qualitative phenotypes in individual seedlings (Figure 7). Very large reductions (i.e., ~log 3) in bacterial growth or strong resistance in resistant seedlings of a wild accession compared to a susceptible cultivar suggest that the underlying genetic basis of resistance may be due to ETI22. Smaller reductions in bacterial growth (i.e., ~log 1.7), as observed in LA1329 seedlings, may be due to the contribution of weaker resistance from quantitative trait loci and/or PTI. Thus, the seedling growth assay can be an important tool in further characterizing resistance in wild tomato lines.
to:
Pst is a foliar pathogen that preferentially colonizes the aerial parts of tomato seedlings, including the cotyledons24 (Figure 3). Therefore, qualitative phenotyping in the seedling flood assay focuses on growth and disease symptoms in aerial portions of the seedling, and tissue for the bacterial growth assay is sampled from the cotyledons for quantitative analysis. After flood inoculation, seedlings may die within 7–10 days after inoculation with PstDC3000 or 10–14 days after inoculation with Pst19, as discussed in section 11. Seedling death is visualized by a brown apical meristem, arrested epicotyl elongation, and/or arrested vegetative growth. If different bacterial strains are used, the timing will have to be empirically determined. In addition, the progression of disease on control plants should be monitored daily after flooding until a consistent time frame from the onset of disease symptoms to seedling death can be identified. Depending on the genotypes and treatments used in the flood assay, seedling phenotypes can be recorded as binary phenotypes or on a disease spectrum (Figure 4). A broader spectrum of phenotypes may be observed when flood inoculating F2 mapping populations from wild tomato accessions crossed to susceptible cultivars (Figure 4C). It may be best to phenotype segregating populations on a disease spectrum depending on how quickly the seedling dies and the degree of new vegetative growth and branching (Figure 4C). The seedling flood assay can also be used in conjunction with the seedling bacterial growth assay to quantitatively assess levels of bacterial growth associated with qualitative phenotypes in individual seedlings (Figure 7). Very large reductions (i.e., ~log 3) in bacterial growth or strong resistance in resistant seedlings of a wild accession compared to a susceptible cultivar suggest that the underlying genetic basis of resistance may be due to ETI22. Smaller reductions in bacterial growth (i.e., ~log 1.7), as observed in LA1329 seedlings, may be due to the contribution of weaker resistance from quantitative trait loci and/or PTI. Thus, the seedling growth assay can be an important tool in further characterizing resistance in wild tomato lines.
The fourth paragraph of the Discussion section was updated from:
Typically, genetic screens have been performed on four- to five-week-old adult tomato plants to identify the genetic basis of P. syringae resistance in wild accessions20,21. Adult tomato plants require much longer growth times, require more space in the growth chamber, and are much larger plants, which means that usually few individuals are screened for each line. The seedling flood assay provides a powerful, alternative approach in the identification of P. syringae resistance in wild tomato accessions. Screening at the seedling stage permits a large sample size to be tested which can be particularly advantageous in detecting resistance in genetically complex populations. Reduced growth chamber space requirements and growth time facilitate a high-throughput approach and rapid detection of natural resistance in wild accessions to emerging pathogens. Furthermore, P. syringae resistance that was identified at the seedling stage in this assay is not restricted to the developmental stage. S. neorickii LA1329 and S. habrochaites LA1253 were initially identified at the seedling stage and also display resistance to PstT1 in adult plants as previously described22.
to:
Typically, genetic screens have been performed on four- to five-week-old adult tomato plants to identify the genetic basis of P. syringae resistance in wild accessions20,21. Adult tomato plants require much longer growth times, require more space in the growth chamber, and are much larger plants, which means that usually few individuals are screened for each line. The seedling flood assay provides a powerful, alternative approach in the identification of P. syringae resistance in wild tomato accessions. Screening at the seedling stage permits a large sample size to be tested which can be particularly advantageous in detecting resistance in genetically complex populations. Reduced growth chamber space requirements and growth time facilitate a high-throughput approach and rapid detection of natural resistance in wild accessions to emerging pathogens. Furthermore, P. syringae resistance that was identified at the seedling stage in this assay is not restricted to the developmental stage. S. neorickii LA1329 and S. habrochaites LA1253 were initially identified at the seedling stage and also display resistance to Pst19 in adult plants as previously described22.
Yeniden Basımlar ve İzinler
Bu JoVE makalesinin metnini veya resimlerini yeniden kullanma izni talebi
Izin talebiDaha Fazla Makale Keşfet
This article has been published
Video Coming Soon
JoVE Hakkında
Telif Hakkı © 2020 MyJove Corporation. Tüm hakları saklıdır