
Un abonnement à JoVE est nécessaire pour voir ce contenu. Connectez-vous ou commencez votre essai gratuit.
Method Article
Identification à haut débit de la résistance aux seringues Pseudomonas pv. Tomate dans la tomate à l’aide de semis Flood Assay
Dans cet article
Erratum Notice
Résumé
L’essai d’inondation de semis facilite le criblage rapide des adhésions de tomate sauvage pour la résistance à la bactérie de seringue de Pseudomonas. Cet essai, utilisé en conjonction avec l’essai de croissance bactérienne de semis, peut aider à caractériser davantage la résistance sous-jacente à la bactérie, et peut être employé pour dépister la cartographie des populations pour déterminer la base génétique de la résistance.
Résumé
La tomate est une culture d’importance agronomique qui peut être infectée par les seringues Pseudomonas, une bactérie Gram-négative, entraînant une maladie bactérienne des taches. La tomate-P. syringae pv. le pathosystem de tomate est employé couramment pour disséquer la base génétique des réponses innées de plante et de résistance de la maladie. Alors que la maladie a été gérée avec succès pendant de nombreuses décennies grâce à l’introduction de l’amas de gènes Pto/Prf de Solanum pimpinellifolium dans la tomate cultivée, les souches de la race 1 des seringues P. ont évolué pour surmonter la résistance conférée par le groupe génétique Pto/Prf et se produisent dans le monde entier.
Les espèces de tomates sauvages sont d’importants réservoirs de diversité naturelle dans la reconnaissance des agents pathogènes, parce qu’elles ont évolué dans divers environnements avec différentes pressions pathogènes. Dans les écrans typiques pour la résistance aux maladies dans la tomate sauvage, les plantes adultes sont utilisées, ce qui peut limiter le nombre de plantes qui peuvent être examinées en raison de leur temps de croissance prolongée et de plus grandes exigences d’espace de croissance. Nous avons mis au point une méthode pour dépister les semis de tomates vieux de 10 jours pour détecter la résistance, ce qui réduit au minimum le temps de croissance des plantes et l’espace de la chambre de croissance, permet un roulement rapide des plantes et permet de tester de grandes tailles d’échantillons. Les résultats de la survie ou de la mort peuvent être traités comme des phénotypes discrets ou sur une échelle de résistance définie par la quantité de nouvelle croissance des semis survivants après les inondations. Cette méthode a été optimisée pour filtrer les semis de tomates vieux de 10 jours pour la résistance à deux souches de seringues P. et peuvent facilement être adaptées à d’autres souches de seringues P.
Introduction
Pseudomonas syringae est une bactérie pathogène Gram-négative qui infecte un large éventail d’hôtes végétaux. Les bactéries pénètrent dans la plante hôte par les stomates ou les blessures physiques et prolifèrent dans l’apoplast1. Les plantes ont développé une réponse immunitaire à deux niveaux pour se protéger contre l’infection par des agents pathogènes bactériens. Le premier niveau se produit à la surface des cellules végétales, où les récepteurs de reconnaissance des motifs sur la membrane des cellules végétales perçoivent des modèles moléculaires hautement conservés associés aux agents pathogènes (PAMP) dans un processus appelé immunité déclenchée par pAMP (PTI)2. Au cours de ce processus, la plante hôte dérégère les voies de réponse de défense, y compris le dépôt de callose à la paroi cellulaire, la fermeture des stomates, la production d’espèces réactives d’oxygène, et l’induction des gènes liés à la pathogénie.
Les bactéries peuvent surmonter PTI en utilisant un système de sécrétion de type III pour fournir des protéines, appelés effecteurs, directement dans la cellule végétale3. Les protéines Effector ciblent généralement les composants de PTI et favorisent la virulence pathogène4. Le deuxième niveau d’immunité végétale se produit dans la cellule végétale lors de la reconnaissance des protéines effectrices. Cette reconnaissance dépend des gènes de résistance, qui codent la répétition du site de liaison nucléotide contenant des récepteurs (NLR). Les NLR sont capables soit de reconnaître directement les effecteurs, soit de reconnaître leur activité sur une cible de virulence ou leurre5. Ils déclenchent alors une réponse immunitaire secondaire dans un processus appelé l’immunité effector-déclenchée (ETI), qui est souvent associée à une réponse hypersensible (HR), une forme de mort cellulaire localisée au site de l’infection6. Contrairement à la résistance du gène pour gène associée à l’ETI, les plantes peuvent présenter une résistance partielle quantitative, qui dépend de la contribution de multiples gènes7.
P. syringae pv. tomate (Pst) est l’agent causal de la tache bactérienne sur la tomate et est un problème agricole persistant. Les souches prédominantes sur le terrain ont généralement été les souches de la course Pst 0 qui expriment l’un ou l’autre ou les deux des effecteurs de type III AvrPto et AvrPtoB. DC3000 (PstDC3000) est une souche représentative de race 0 et un modèle pathogène qui peut causer des taches bactériennes dans la tomate. Pour lutter contre la maladie bactérienne des taches, les éleveurs ont introgressé le Pto [P. syringae pv. tomate]/Prf [Pto résistance et sensibilité au fenthion] groupe génétique de l’espèce de tomate sauvage Solanum pimpinellifolium dans les cultivars modernes8,9. Le gène Pto code une protéine sérine-threonine kinase protéine qui, avec le Prf NLR, confère une résistance à PstDC3000 via la reconnaissance des effecteurs AvrPto et AvrPtoB10,11,12,13,14. Cependant, cette résistance est inefficace contre les souches émergentes de la course 1, ce qui permet leur propagation rapide et agressive ces dernières années15,16. Les souches de la course 1 échappent à la reconnaissance par le cluster Pto/Prf, parce qu’AvrPto est soit perdu, soit muté dans ces souches, et AvrPtoB semble s’accumuler au minimum15,17,18.
Les populations de tomates sauvages sont d’importants réservoirs de variation naturelle pour la résistance au Pst et ont déjà été utilisées pour identifier les loci de résistance potentielle19,20,21. Cependant, les écrans actuels pour la résistance aux agents pathogènes utilisent des plantes adultes de 4 à 5 semaines20,21. Par conséquent, ils sont limités par le temps de croissance, l’espace de chambre de croissance, et la taille relativement petite d’échantillon. Pour répondre aux limites des approches conventionnelles, nous avons développé un essai de résistance aux seringues de tomate P. à haut débit à l’aide d’semis de tomates de 10 jours22. Cette approche offre plusieurs avantages par rapport à l’utilisation de plantes adultes : à savoir, un temps de croissance plus court, des besoins d’espace réduits et un débit plus élevé. En outre, nous avons démontré que cette approche récapitule fidèlement les phénotypes de résistance aux maladies observés chez les plantes adultes22.
Dans l’analyse d’inondation des semis décrite dans ce protocole, les semis de tomates sont cultivés sur des boîtes de Petri de murashige stérile et Skoog (MS) médias pendant 10 jours, puis sont inondés d’un inoculum contenant les bactéries d’intérêt et un surfactant. Après les inondations, les semis peuvent être évalués quantitativement pour la résistance aux maladies par le biais d’essais de croissance bactérienne. En outre, la survie ou la mort des semis peut agir comme une résistance discrète ou un phénotype de la maladie 7 à 14 jours après l’inondation. Cette approche offre une alternative à haut débit pour le dépistage d’un grand nombre d’accessions à la tomate sauvage pour la résistance aux souches de la course Pst 1, telles que la souche Pst T1(PstT1), et peut facilement être adaptée à d’autres souches bactériennes d’intérêt.
Access restricted. Please log in or start a trial to view this content.
Protocole
1. Préparation et utilisation d’armoires de biosécurité
- Essuyez l’armoire de biosécurité avec 70% d’éthanol.
- Fermez la ceinture et allumez la lumière ultraviolette dans l’armoire de biosécurité pendant 15 min.
- Après 15 min, éteignez la lumière ultraviolette dans l’armoire de biosécurité. Soulevez la ceinture et allumez la souffleuse pendant 15 min.
- Essuyez tous les articles à utiliser dans l’armoire de biosécurité avec 70% d’éthanol avant de mettre les articles dans l’armoire stérilisée.
- Gants propres ou mains nues avec 70% d’éthanol avant de travailler dans l’armoire de biosécurité.
- Travaillez au centre de l’armoire de biosécurité, loin de la souffleuse.
- Utilisez des bouteilles non ouvertes de 10 mM MgCl2 et ultrapure H2O pour des expériences. Mettez des bouteilles dans l’armoire de biosécurité et ouvrez-les uniquement dans l’armoire de biosécurité stérilisée, pas sur le banc.
- Utilisez des pipettes en verre et des pointes de pipette pour travailler dans l’armoire de biosécurité stérilisée. Assurez-vous que ceux-ci ne sont ouverts dans le coffret de biosécurité, jamais sur le banc.
- Après l’utilisation de l’armoire de biosécurité, autoclavez tous les déchets (sauf les déchets d’eau de Javel) et essuyez la surface avec 70% d’éthanol.
2. Préparation des supports végétaux
- Peser et dissoudre les sels basaux MS 0.5x dans l’ultrapure H2O. Peser 0,8% bacto agar, puis ajouter à dissous 0.5x MS.
- Autoclave et permettre au support de refroidir dans un bain d’eau à 50 oC pendant 1 h avant de verser ou de tuyauterie.
- Pour s’assurer que les plaques ne sont pas trop remplies, marquez les plaques stériles jetables en polystyrène de 100 x 25 mm à un niveau de remplissage de 40 ml. Verser le support dans des plaques stériles de 100 x 25 mm dans une armoire de biosécurité stérilisée.
3. Préparation des matériaux végétaux et conditions de croissance
- Placer les graines de tomate dans un tube de microcentrifuge de 2,2 ml et ajouter 2,0 ml de solution d’eau de Javel à 50 %.
- Rock le tube sur un rocker pendant 25 min.
- Après 25 min, retirer les graines du rocker et retirer la solution d’eau de Javel avec une pipette dans l’armoire stérile de biosécurité. Assurez-vous que toute l’eau de Javel est enlevée.
- Ajouter 2 ml d’ultrapure stérile H2O pour laver les graines. Inverser le tube 5x.
- Retirer le liquide du tube à l’égard d’une pipette.
- Répétez les étapes 3.3-3.5 pour laver les graines 4x de plus.
- Ajouter 2 ml d’ultrapure stérile H2O et verser les graines dans un plat Petri stérile vide.
- Les forces de flamme dans l’éthanol et permettent de refroidir avant le transfert et l’espacement égal des graines sur des plaques de 100 x 25 mm contenant 0,5x MS - 0,8% de support d’agar.
- Transférer les graines de 5 à 7 dans une ligne au milieu d’une assiette et sceller les bords des plaques avec du ruban adhésif chirurgical (1,25 cm x 9,1 m).
- Stratifier les graines stérilisées à 4 oC dans l’obscurité pendant au moins 3 jours pour synchroniser la germination. Assurez-vous que les assiettes sont empilées à plat et face vers le haut, de sorte que les graines ne se déplacent pas sur l’assiette.
- Orientez verticalement les plaques de sorte que les racines poussent vers le bas le long de la surface de la plaque, avec la ligne de graines orientées horizontalement, lors du transfert à la chambre de croissance.
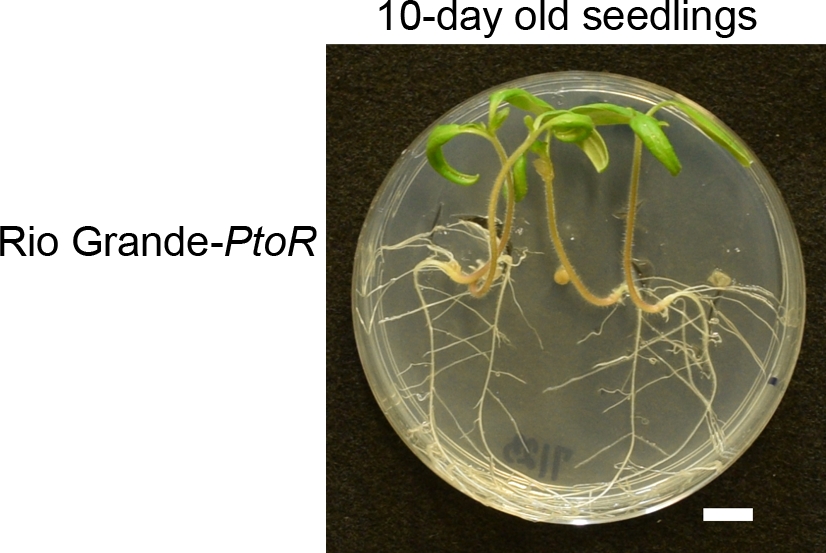
REMARQUE : Réglez la chambre de croissance à 22 oC et fournissez 16 h de lumière à une intensité légère de 200 à 220 E mètre-2 s-1 et 8 h d’obscurité. - Avant les inondations, cultivez des semis pendant 10 jours dans la chambre de croissance à partir de laquelle les semis affichent généralement des cotyledons complètement émergés et agrandis et des premières vraies feuilles émergentes(figure 1).

Figure 1 : Stade de développement des semis typiques de tomates de 10 jours. Les graines de tomates Rio Grande-Ptor ont été stérilisées, plaquées et stratifiées pendant au moins 3 jours dans l’obscurité à 4 oC. Les semis ont été cultivés sur des plaques de MS de 0,5x pendant 10 jours à 22 oC avant d’être inondés. Typiquement, à 10 jours, les cotyledons sont complètement élargis, et les premières vraies feuilles commencent à émerger. S’il vous plaît cliquez ici pour voir une version plus grande de ce chiffre.
4. Préparation des médias du roi B23 (KB)
- Remplissez le bécher de 500 ml d’ultrapure H2O et remuer sur une plaque à remuer.
- Dissoudre complètement 20 g de peptone bacto, 1,5 g de K2HPO4anhydre et 12,5 ml de glycérol dans un bécher avec ultrapure H2O.
- Verser le mélange dissous dans un cylindre gradué de 1 L et porter jusqu’à un volume final de 1 L avec ultrapure H2O.
- Verser le bouillon dans le bécher et remuer jusqu’à ce qu’il soit mélangé.
- Peser 7,5 g de bacto agar dans deux bouteilles en verre de 500 ml et ajouter 500 ml de bouillon KB de l’étape 4,4 dans chaque bouteille. Autoclave pendant 20 min.
- Retirer les bouteilles de l’autoclave et tourbillonner doucement pour distribuer l’agar.
- Transférer les bouteilles dans un bain d’eau de 50 oC pour 1 h.
- Après 1 h, transférer la bouteille dans l’armoire de biosécurité et dans des conditions aseptiques, ajouter 1 600 L de 1 M MgSO4stériles, et des antibiotiques appropriés aux médias.
REMARQUE : Pour les souches résistantes à la rifampicine PstDC3000 et PstT1, utilisez la rifampicine dissoute dans le diméthylformamide à une concentration finale de 50 g/mL. Utilisez le cycloheximide dissous dans l’éthanol à une concentration finale de 50 g/mL pour empêcher la croissance fongique sur les plaques. - Faire tourbillonner doucement les médias pour mélanger, puis verser pour couvrir le fond des assiettes.
- Laisser au moins 1 h pour que les plaques se solidifient avant de les entreposer à l’envers à 4 oC.
5. Maintien des souches bactériennes et des conditions culturelles
- Maintenir un stock de glycérol à partir d’une seule colonie de bactéries comme 1 ml de culture bactérienne saturée et 333 lil de glycérol stérile de 80 % à -80 oC.
- Bactéries de correction (c.-à-d. PstT1) d’un stock de glycérol sur l’agar KB avec des antibiotiques appropriés (section 4).
- Laisser les bactéries récupérer pendant 2 jours à 28 oC avant de strier des bactéries fraîches sur l’agar KB sélectif à l’aide d’un cure-dent plat stérile.
- Streak bactéries fraîches du stock de glycérol sur l’agar KB sélectif approprié à l’aide d’un plat, cure-dents stérile.
REMARQUE : Assurez-vous que le stock de glycérol patché n’a pas plus de 2 semaines. - Pour PstDC3000, incuber la plaque KB à 28 oC pendant 24 h avant d’utiliser des bactéries dans l’expérience d’inondation.
- Pour PstT1, incuber la plaque KB à 28 oC pendant 48 h avant d’utiliser des bactéries dans l’expérience d’inondation.
6. Préparation de PstT1 inoculum
- Resuspendez de façon aseptique la bactérie dans 10 mMIlléentreux MgCl 2 à une densité optique à 600 nm (OD600) de 0,1, soit environ 5 x 10⁷ unités de formation de colonies (CFU)/mL).
- Effectuez des dilutions en série à l’aide de la solution stérile MgCl2 de 10 mM dans l’armoire de biosécurité. Pour PstT1, utilisez un spectrophotomètre pour faire de l’inoculum avec une concentration de départ de600 OD à 0,1.
- Pour PstT1, faire une dilution de 1/10 de la résuspension initiale àOD 600 -0,1 pour obtenir une dilution série à une concentration de600 OD - 0,01.
- À l’aide de la dilution en série à600 OD à 0,01 de l’étape 6.3, faites une dilution 3/4 pour obtenir un OD final600 à 0,0075.
- Faire une dilution 1/10 de copolymer copolymer organosilicone non ioniqueC 13H34O4Si3 (c.-à-d., surfactant) en 10 mM MgCl2 et vortex pour 15 s. Ajouter le stock de 1/10 de surfactant à la dernière dilution série (OD600 - 0,0075) à une concentration finale de 0,015% et bien tourbillonner pour mélanger.
7. Préparation de PstDC3000 inoculum
- Bactéries de résuspendance aseptique dans sterile 10 mM MgCl2 à une densité optique à 600 nm (OD600) de 0.1 (environ 5 x 10⁷ CFU/mL).
- Effectuez des dilutions en série à l’aide de la solution stérile MgCl2 de 10 mM dans l’armoire de biosécurité. Pour PstDC3000, utilisez un spectrophotomètre pour faire de l’inoculum avec une concentration de départ de600 OD à 0,1.
- Pour PstDC3000, faire une dilution de 1/10 de la résuspension initiale à OD600 - 0,1 pour obtenir une dilution série à une concentration de600 OD - 0,01.
- En utilisant la dilution en série àOD 600 à 0,01 de l’étape 3, faire une dilution 1/2 pour obtenir un ODfinal 600 - 0,005.
- Faire une dilution de 1/10 de surfactant dans 10 mM MgCl2 et vortex pour 15 s. Ajouter le stock de 1/10 de surfactant à la dernière dilution série (OD600 - 0,005) à une concentration finale de 0,015% et bien tourbillonner pour mélanger.
8. Méthode d’inondation des semis de tomates
- Sortez les plaques avec les semis de 10 jours de la chambre de croissance et mettez dans l’armoire de biosécurité pour préparer les plaques pour les inondations.
- Retirer le ruban chirurgical de deux assiettes.
- Réglez une minuterie pour 3 min. Mesurez 6 ml de l’inoculum final(PstT1 OD600 à 0,0075 [section 6] ou PstDC3000 OD600 0,005 [section 7]) et transférez 6 ml d’inoculum à chaque plaque avec les semis de 10 jours.
- Poussez doucement les semis vers le bas dans l’inoculum avec une pointe stérile de pipette. Démarrez la minuterie.
- Tenez une assiette dans chaque main. Inclinez l’avant de la plaque vers le bas pour accumuler l’inoculum et immerger principalement les cotyledons et les feuilles des semis.
- Swish côté à côté 5-7x, puis basculer les plaques de retour pour couvrir les racines et l’assiette entière.
- Inclinez les plaques vers le bas à nouveau pour submerger les cotyledons et les feuilles, et répétez pendant un total de 3 min.
- Verser l’inoculum des plaques, poser les plaques sur une surface plane, puis verser tout inoculum résiduel une deuxième fois.
- Remorquez les plaques avec du ruban adhésif chirurgical et répétez les étapes 8.2-8.8 pour les plaques restantes.
- Réinbéquer les plaques dans la chambre de croissance (voir étape 3.11 NOTE) après que toutes les plaques ont été inondées.
- Phénotype après 7 à 10 jours pour PstDC3000 ou 10 à 14 jours pour PstT1 (section 11). Si vous effectuez des essais de croissance bactérienne, collectez le tissu foliaire après 4 jours (sections 9 et 10) puis le phénotype (article 11). Alternativement, effectuer l’analyse phénotypique et les essais de croissance bactérienne sur des ensembles distincts de plantes.
9. Stérilisation de surface des cotyledons pour l’essai de croissance bactérienne
- Quatre jours après l’inondation et la réinbécubation des semis dans la chambre de croissance (article 8), retirer les assiettes avec les semis de tomates de la chambre de croissance.
- Numéro les semis individuels sur l’extérieur inférieur de la plaque où le semis se fixe à la plaque pour chaque génotype.
- Étiquetez les tubes stériles de microcentrifuge de 1,5 ml avec les nombres individuels de semis et utilisez des forceps propres pour déposer une perle de borosilicate stérile de 3 mm dans chaque tube pour une utilisation avec un batteur de perles. (Voir NOTE à l’étape 10.1.)
- Pipette 200 L de 10 mM MgCl2 dans chaque tube et tubes proches.
- Préparer 70 % d’éthanol et verser 100 ml dans un bécher propre. Verser 100 ml d’ultrapure stérile H2O dans un bécher propre et séparé.
- Nettoyez les forceps fins en acier inoxydable avec des pointes dentelées à l’éthanol. Ouvrez légèrement la plaque pour permettre l’élimination aseptique d’un cotyledon avec les forceps propres.
- Pincer le pétiole à la base du cotyledon pour enlever une feuille et tomber dans le bécher avec 70% d’éthanol pour stériliser la surface pendant 10 s. Rincer le cotyledon à ultrapure H2O pour 10 s.
- Déposer le cotyléon sur un essuie-tout et éponger les lingettes de science délicates.
- Peser individuellement chaque cotylède après la stérilisation de surface et le ballonnement, et enregistrer le poids.
- Placez le cotyledon dans un tube de microcentrifuge de 1,5 mL précédemment préparé (à partir des étapes 9.3 et 9.4) étiqueté avec le génotype correspondant et le nombre individuel.
- Ré-inséliser les plaques avec du ruban stérile et réinbérer les semis dans la chambre de croissance (voir étape 3.11 NOTE).
10. Essai de croissance bactérienne
- À l’aide d’échantillons de l’étape 9.10, homogénéisez le tissu à l’aide du batteur de perles dans 10 mM MgCl2 pendant 1-2 min. Si le tissu n’est pas suffisamment macéré, homogénéisez à nouveau.
REMARQUE : De nombreux fabricants produisent des homogénéisateurs de batteurs de perles. Le nombre et le type de perles, ainsi que le temps et la vitesse d’homogénéisation (si programmable) doivent être optimisés pour chaque type d’homogénéise. Assurez-vous que les échantillons ne surchauffent pas pendant l’homogénéisation. - Ajouter 800 L de MgCl2 de 10 mM à chaque tube contenant du tissu macéré de l’étape 10.1 et inverser plusieurs fois pour mélanger.
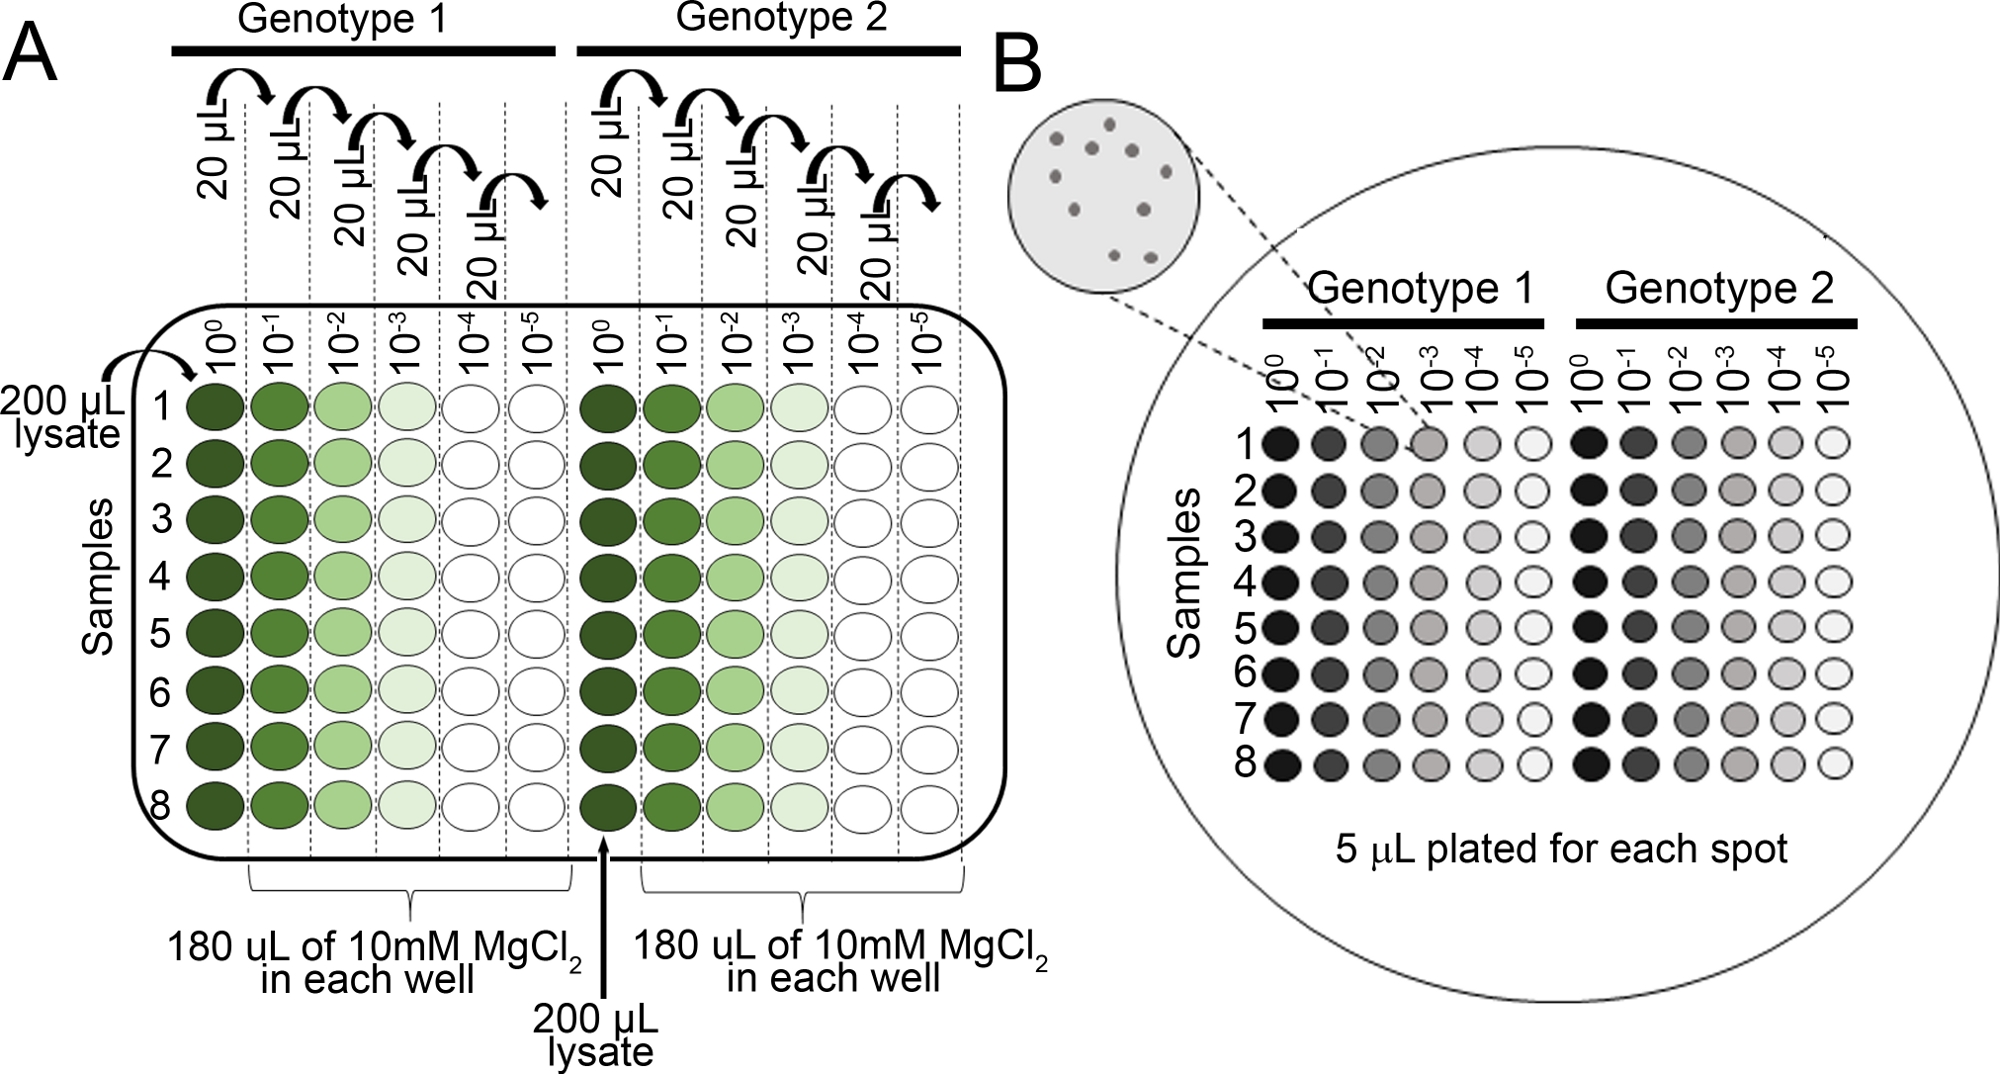
- Préparer des dilutions en série pour chaque échantillon dans 10 mM MgCl2 dans 96 assiette de puits (100, 10-1, 10-2, 10-3, 10-4, 10-5) à l’aide d’une pipette multicanal(figure 2A).
- Pipette 5 L de chaque série de dilution à l’aide d’une pipette multicanal sur une plaque d’agar KB (150 mm x 15 mm) avec cycloheximide et sélection appropriée pour la souche bactérienne d’intérêt (voir étape 4.8 NOTE). Laisser sécher complètement les plaques.
- Incuber la plaque à l’envers à 28 oC pendant 36 h, puis visualiser (figure 2B) les colonies sur les plaques à l’aide d’un microscope disséquant pour déterminer si les colonies sont assez grandes pour compter.
REMARQUE : Si les colonies ne sont pas assez grandes, réinbéquez les plaques et revérifier de nouveau la taille des colonies toutes les quelques heures. Typiquement, les colonies sont comptées 36-48 h après l’incubation.

Figure 2 : Dilutions en série pour les essais de croissance bactérienne des semis. (A) Le tissu foliaire macéré provenant de plantes infectées est dilué avant le comptage des colonies. Les dilutions sont effectuées dans une plaque de 96 puits (100 est non diluée). Typiquement, les dilutions sont faites de 10-1 à 10-5. (B) Plaquettes de dilutions pour le nombre de colonies bactériennes. Un total de 5 L de chaque colonne de la série de dilution est plaqué, de la plus diluée à la plus concentrée. Une fois que les colonies ont complètement séché, la plaque est incubée à 28 oC pour 36-48 h. Les colonies sont comptées sous un microscope disséquant 10x. S’il vous plaît cliquez ici pour voir une version plus grande de ce chiffre.
- Comptez les colonies sous un microscope disséquant avant qu’elles ne fusionnent (figure 2B). Comptez les colonies des plaques de la série de dilution avec moins de 100 colonies.
- Après avoir obtenu le nombre de colonies(figure 2B), normalisez le nombre à 0,01 g de tissu pour les semis et convertissez-le à la croissance bactérienne des grumes(tableau 1).
REMARQUE: La masse moyenne d’un Moneymaker-PtoS cotyledon est de 0,01 g et est empiriquement déterminée22.
| Génotype1 Colonne A | Poids tissulaire (g) Colonne B | - des colonies dans une tache Colonne C | Facteur de dilution pour le spot2 Colonne D | Ajusté de Colonies3 Colonne E | Facteur de dilution pour la colonne F de dilution série | Total de colonies Colonne G (cfu/0.01 g)4 | Moyenne des colonies (cfu/0,01 g) Colonne H | Croissance moyenne des grumes (cfu/0,01 g (log10))Colonne I |
| Échantillon 1 | 0,004 g | 10 | 200 | calculé comme: (C2 x 0,01 g) / B2 | 1000 | calculé comme: (D2 x E2 x F2) | moyenne pour l’échantillon 1 au dernier échantillon : (c.-à-d. G1:G3) moyen | journal de la moyenne c’est à fait. journal(H2) à 6,85 |
| Échantillon 2 | 0,003 g | 15 | 200 | 50 | 1000 | 10000000 | ||
| Échantillon 3 | 0,002 g | 6 | 200 | 30 | 1000 | 6000000 | ||
| 1 Données présentées pour 3 échantillons | ||||||||
| 2 Basé sur le placage de 5 l x 200 pour 1 ml | ||||||||
| 3 Les cotyledons sont trop petits au cœur de sorte que le nombre de colonies a été normalisé à 0,01 g de tissu basé sur la masse moyenne d’un Cotyledon MoneyMaker-PtoS (données non montrées) | ||||||||
| 4 Ajusté par ML en fonction du volume plaqué | ||||||||
Tableau 1 : Calculs d’échantillons pour l’analyse de croissance bactérienne des semis. Les calculs d’échantillons démontrent comment normaliser les dénombrements bactériens et déterminer la croissance bactérienne des grumes.
- Pour les adhésions sauvages et d’autres lignées ayant des antécédents génétiques complexes, corréler le niveau de croissance bactérienne des semis individuels avec leur phénotype tel que décrit à la section 11.
11. Phénotypage pour la résistance
- Retirer les plaques de la chambre de croissance et les semis individuels phénotype pour la mort (en raison de la maladie) ou de survie (en raison de la résistance) après 7-14 jours.
- Plantes de phénotype infectées par une souche très virulente telle que PstDC3000 plus tôt, à 7-10 jours après l’inoculation d’inondation.
- Plantes de phénotype infectées par PstT1 à 10-14 jours après l’inoculation d’inondation.
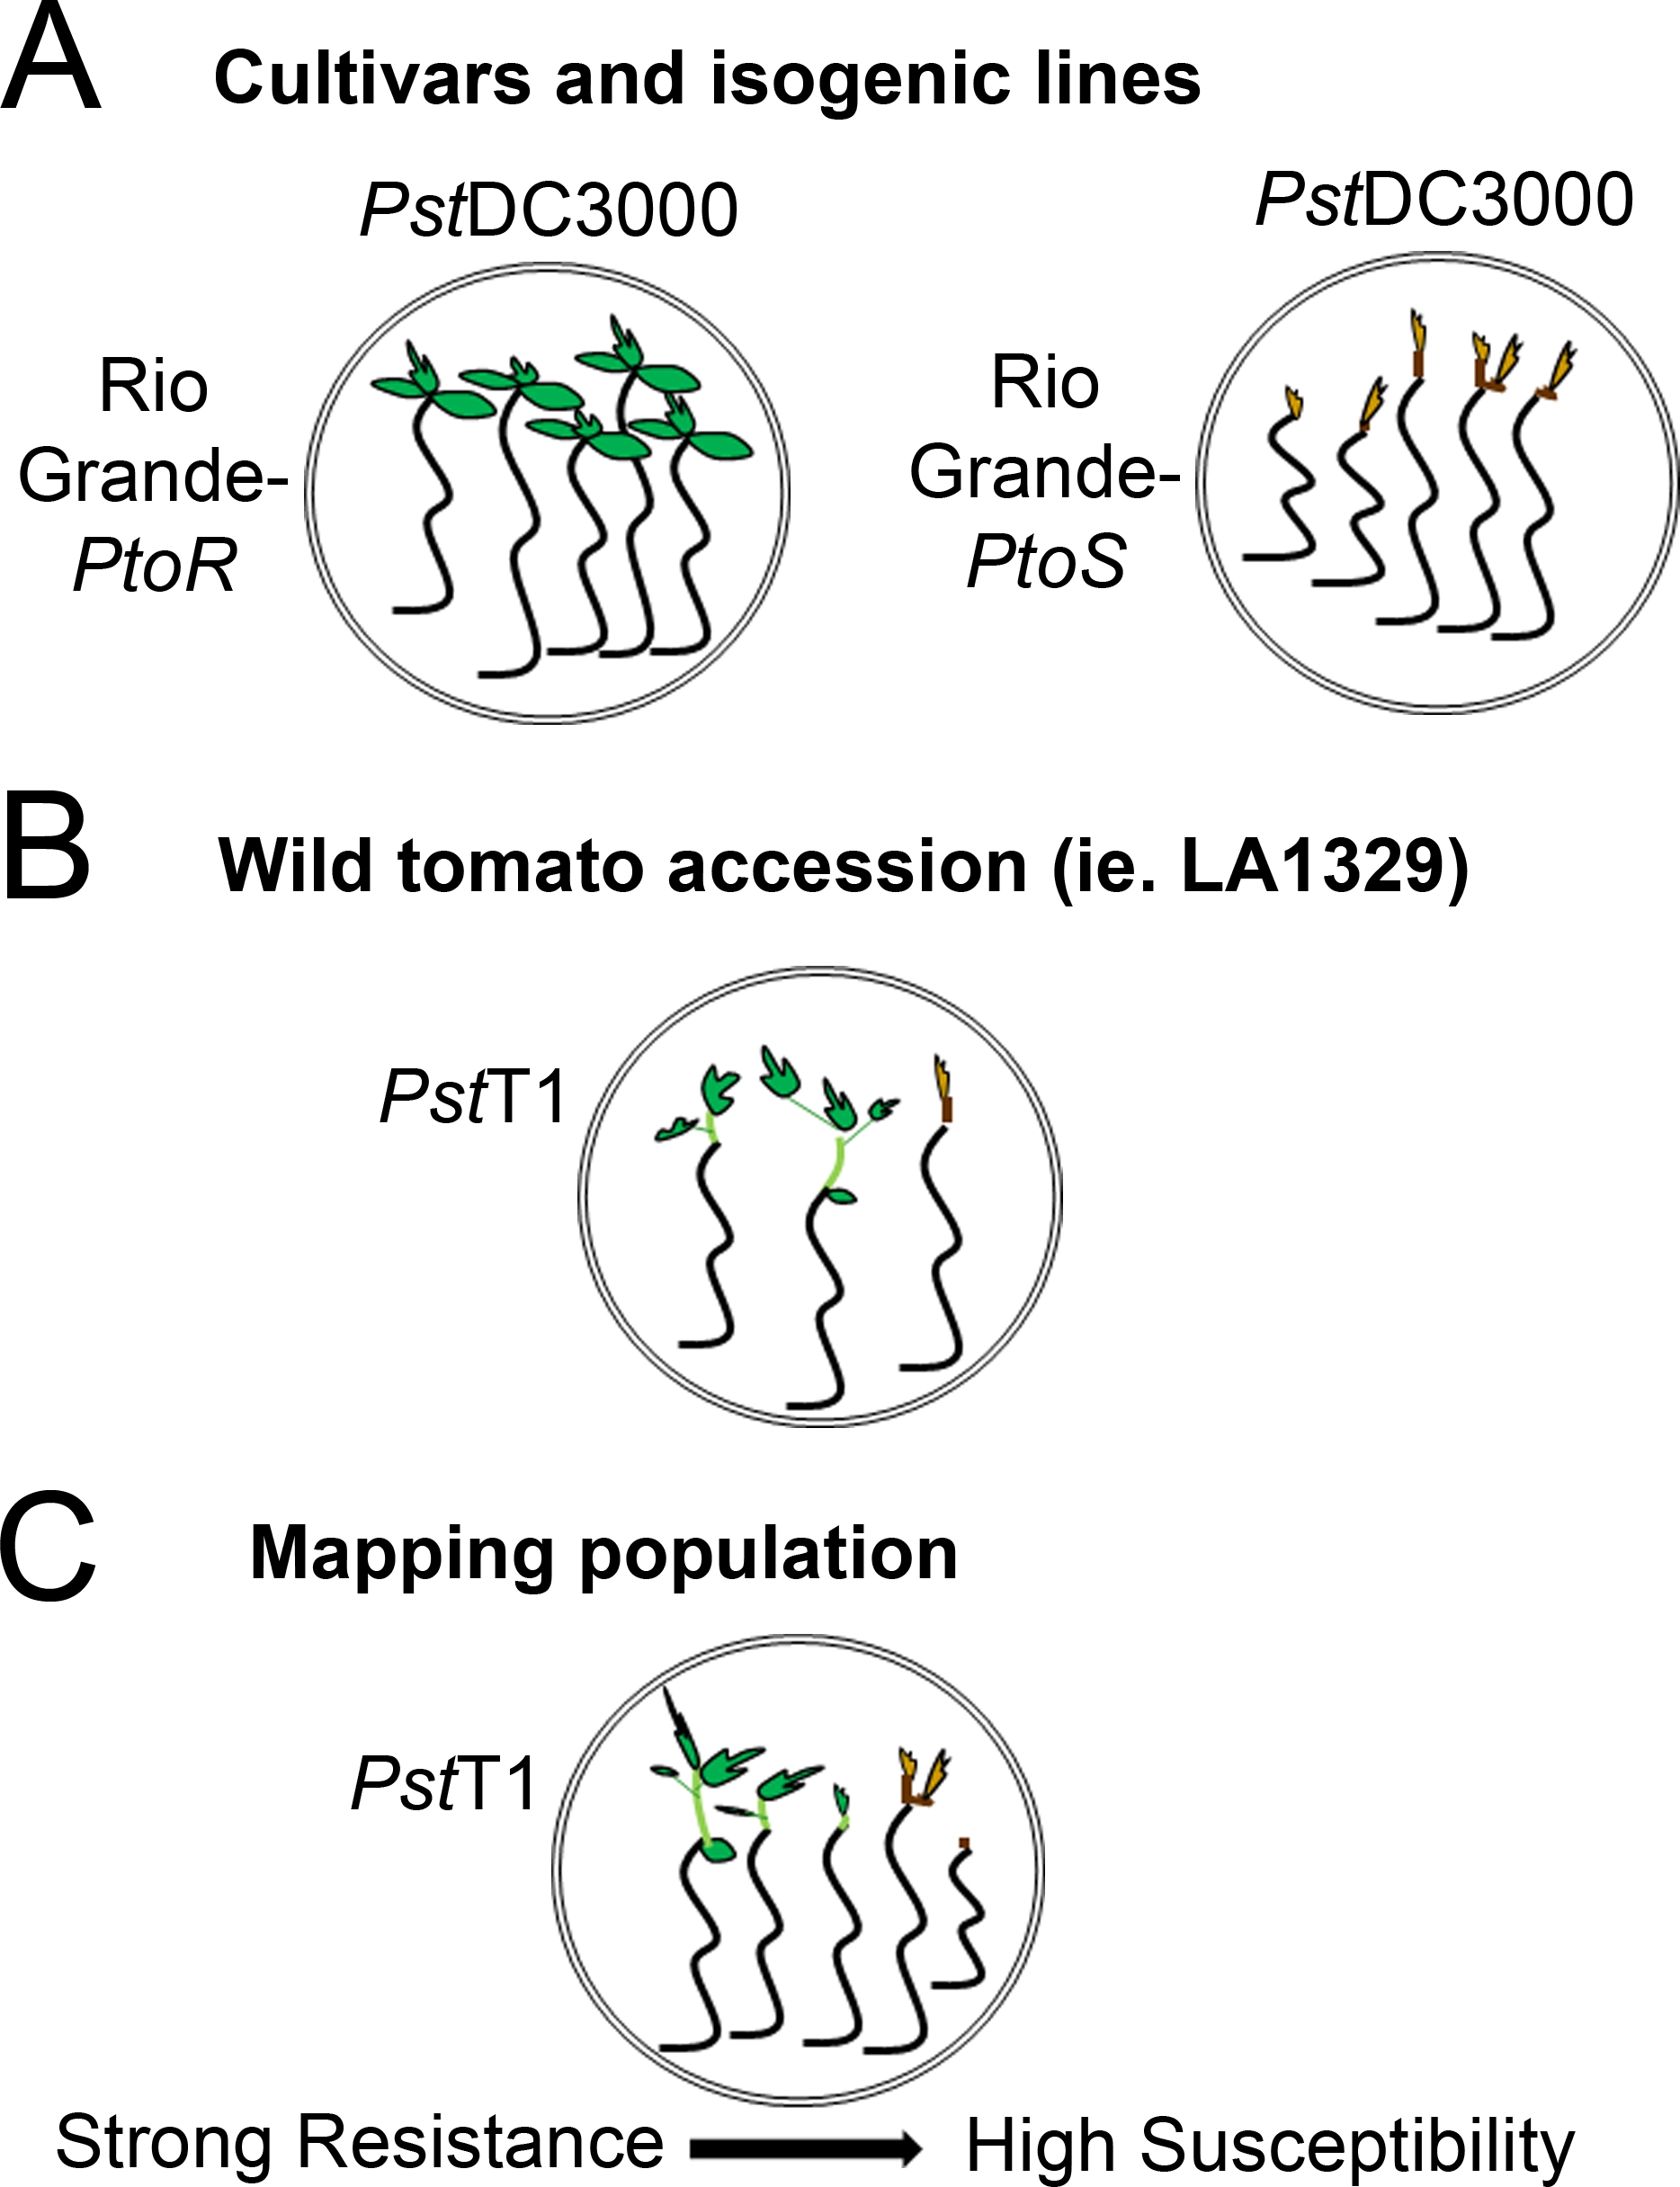
- Déterminer un système de notation en fonction de la gamme de phénotypes de résistance observés. Enregistrez les phénotypes binaires pour les cultivars, les lignées isogéniques et les adhésions sauvages avec des phénotypes de résistance constants et forts à intermédiaires(figure 4A, 4B).
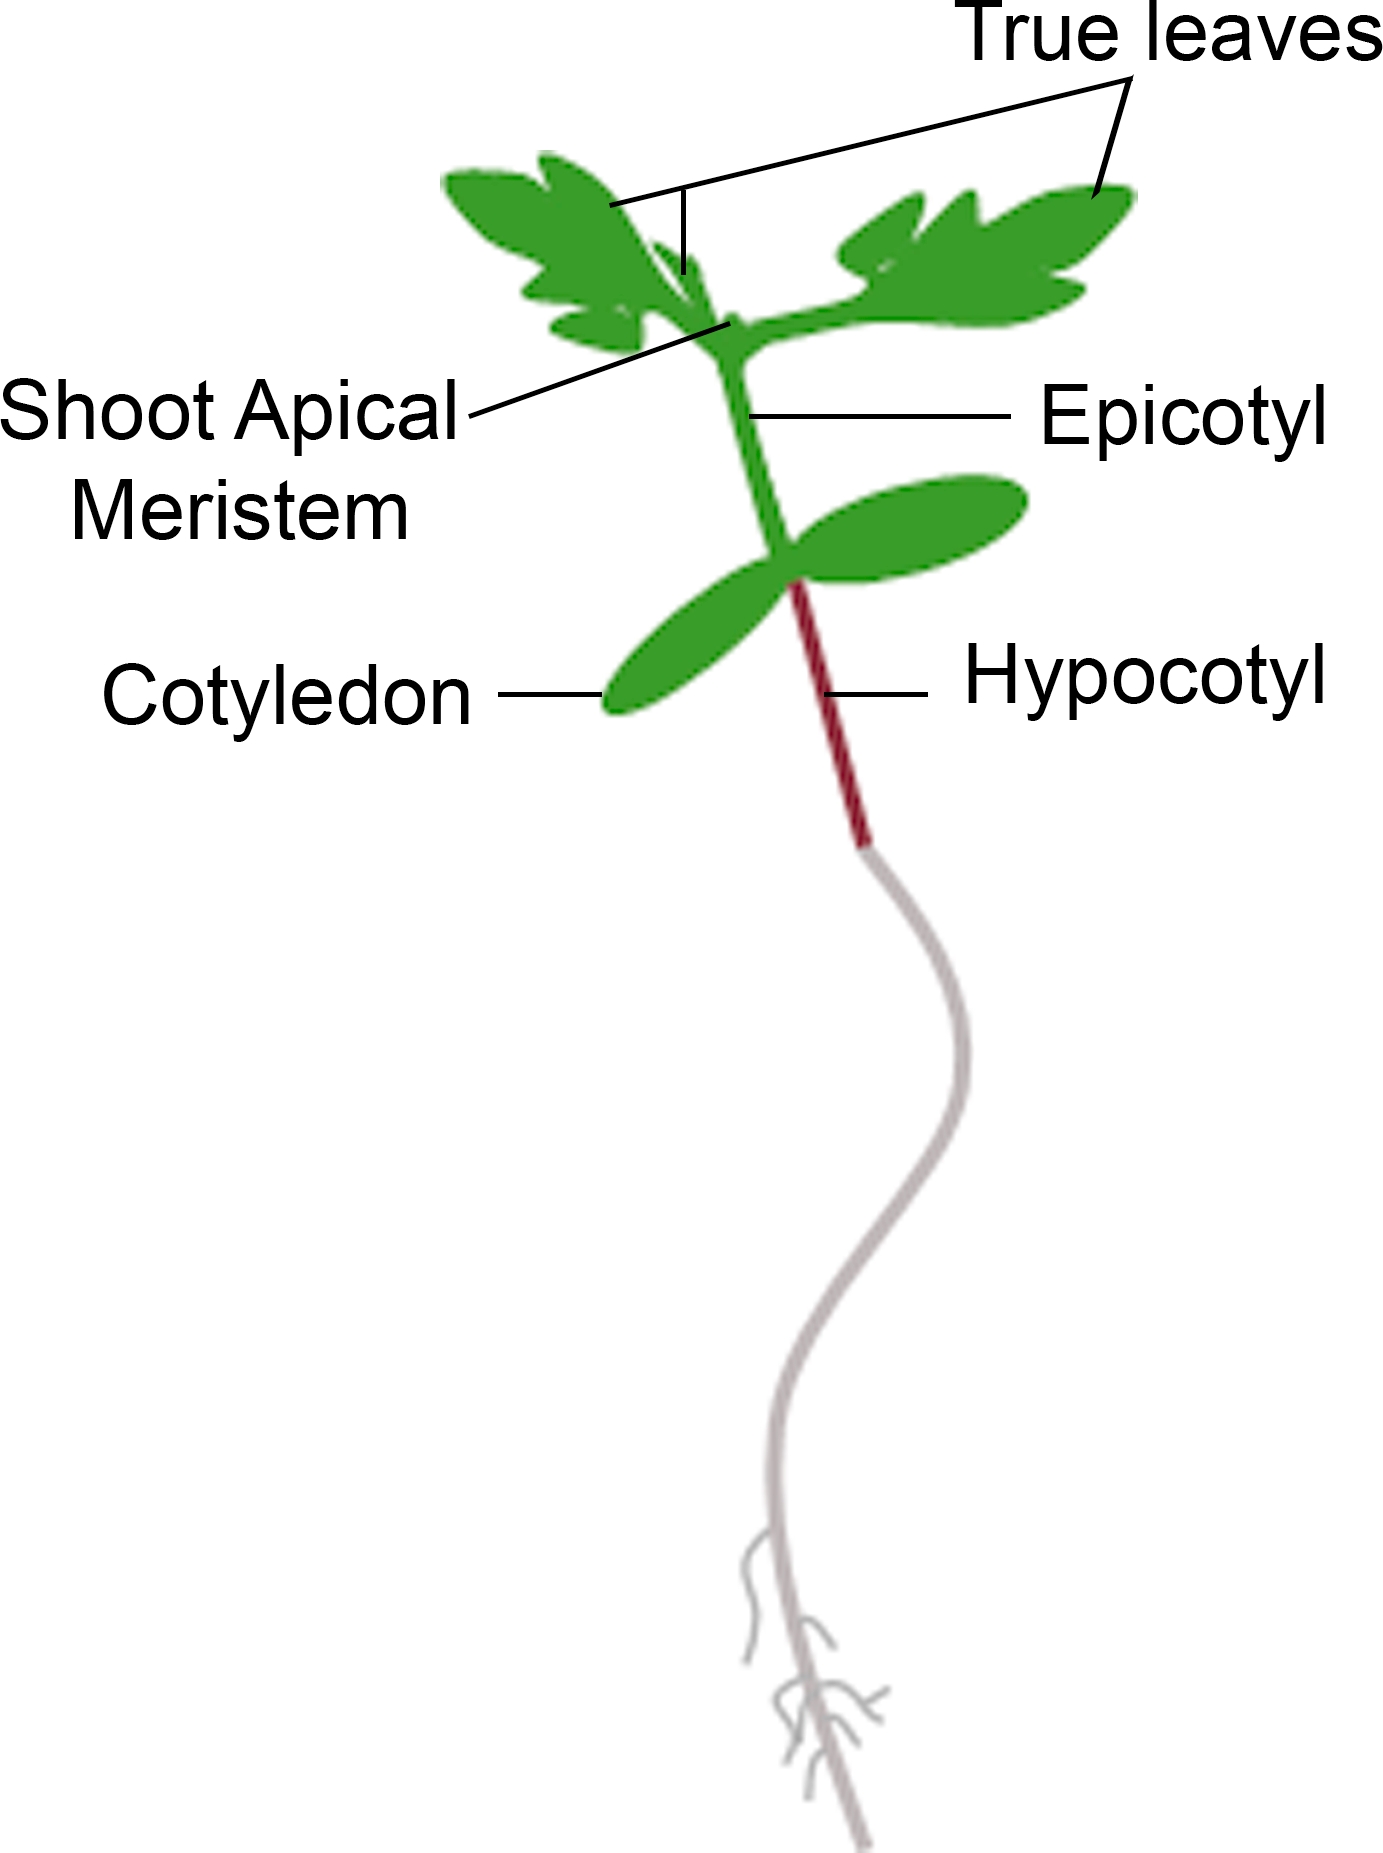
- Si le semis affiche une nouvelle croissance du meristem apical dans le délai de phénotypage, comptez-le comme une survie. Si le semis a un meristem apical brun et n’affiche aucune nouvelle croissance végétative verte, comptez-la comme une mort(figure 3).

Figure 3 : Représentation schématique d’un semis de tomate. Différentes parties d’un semis de tomate sont représentées, y compris l’hypocotyl, les cotyledons, l’épiphétyl, le pic de meristem apique, et les vraies feuilles. S’il vous plaît cliquez ici pour voir une version plus grande de ce chiffre.
- Enregistrer des phénotypes sur un spectre de maladies pour les populations, comme les populations de cartographie F2, avec un large éventail de phénotypes de résistance(figure 4C).
- Surveillez attentivement les semis pour déterminer l’apparition des symptômes de la maladie et la mort afin d’identifier la fenêtre appropriée pour le phénotypage.

Figure 4 : Représentation schématique des phénotypes attendus pour la résistance aux semis et la mort dans divers milieux génétiques. (A) Les semis du Rio Grande-PtoR et du cultivar quasi isogénique Rio Grande-PtoS sont affichés 7 jours après les inondations avec PstDC3000 (OD600 - 0,005) - 0,015% surfactant. Rio Grande-Ptor affiche une résistance constante, et Rio Grande-PtoS affiche une sensibilité constante à l’infection par PstDC3000. Ces lignes donnent lieu à des phénotypes discrets et binaires. (B) Les semis d’une adhésion sauvage, tels que Solanum neorickii LA1329, sont montrés 10 jours après les inondations avec PstT1 (OD600 - 0,0075) - 0,015% surfactant. Les semis affichent une variabilité phénotypique, mais ont été enregistrés comme phénotypes binaires. La quantité de variabilité phénotypique et la méthode de phénottypage (résistance binaire ou spectre de résistance) dépendront de l’adhésion particulière testée. (C) La cartographie des populations générées par la croisement des adhésions sauvages aux cultivars sensibles peut afficher un plus large éventail de phénotypes dans les populations de ségrégation F2. Dans ce cas, il peut être plus approprié d’enregistrer les phénotypes de semis sur un spectre. Les semis très sensibles d’une population cartographique peuvent être phénotypes pour la mort dès le jour 7 lorsqu’ils sont inondés de PstT1, et montrent généralement un meristem apical brun, non à très peu d’extension de l’épiotyl, et pas de nouvelle croissance végétative verte. Le meristem apical des semis sensibles peut rester vert ou très brun clair pendant plus de temps, et il peut y avoir une certaine extension de l’épiotyl et très peu de croissance végétative, qui devient brun et les arrestations par jour 10. Les semis individuels peuvent être phénotypes pour la résistance basée sur la quantité de croissance végétative nouvelle et continue par jour 14. Les semis peuvent ensuite être regroupés en fonction des phénotypes décrits ci-dessus en différentes catégories de résistance telles que la faible, moyenne ou forte résistance. S’il vous plaît cliquez ici pour voir une version plus grande de ce chiffre.
Access restricted. Please log in or start a trial to view this content.
Résultats
Détection de l’immunité PtoR-négociée dans les cultivars et les lignées isogéniques à l’aide de l’essai de résistance aux semis
La figure 5 montre des résultats représentatifs pour les cultivars Moneymaker-PtoR et Moneymaker-PtoS 7 à 10 jours après les inondations avec PstDC3000. Avant l’infection, les semis de 10 jours ont montré des cotyledons complètement émergés et agrandis et des premières feuilles vraies ?...
Access restricted. Please log in or start a trial to view this content.
Discussion
Un protocole d’inoculation d’inondation avec PstDC3000 ou PstT1 optimisé pour détecter la résistance à ces souches bactériennes dans les semis de tomates est décrit. Il existe plusieurs paramètres critiques pour des résultats optimaux dans l’essai de résistance aux semis, y compris la concentration bactérienne et la concentration de surfactant, qui ont été empiriquementdéterminés 22. Pour PstDC3000, la densité optique a été optimisée pour atteindr...
Access restricted. Please log in or start a trial to view this content.
Déclarations de divulgation
Les auteurs n’ont rien à divulguer.
Remerciements
Nous remercions Jamie Calma d’avoir testé l’effet du volume des médias sur les maladies ou les résultats de la résistance. Nous remercions le Dr Mael Baudin et le Dr Karl J. Scheiber du Laboratoire Lewis d’avoir fourni des commentaires et des suggestions constructifs sur le manuscrit. La recherche sur l’immunité végétale dans le laboratoire Lewis a été soutenue par l’USDA ARS 2030-21000-046-00D et 2030-21000-050-00D (JDL), et la Direction des sciences biologiques de la NSF IOS-1557661 (JDL).
Access restricted. Please log in or start a trial to view this content.
matériels
| Name | Company | Catalog Number | Comments |
| 3M Tape Micropore 1/2" x 10 YD CS 240 (1.25 cm x 9.1 m) | VWR International | 56222-182 | |
| 3mm borosilicate glass beads | Friedrich & Dimmock | GB3000B | |
| Bacto peptone | BD | 211677 | |
| Bacto agar | BD | 214010 | |
| Biophotometer Plus | Eppendorf | E952000006 | |
| Biosafety cabinet, class II type A2 | |||
| BRAND Disposable Plastic Cuvettes, Polystyrene | VWR International | 47744-642 | |
| Chenille Kraft Flat Wood Toothpicks | VWR International | 500029-808 | |
| cycloheximide | Research Products International | C81040-5.0 | |
| Dibasic potassium phosphate anhydrous, ACS grade | Fisher Scientific | P288-500 | |
| Dimethylformamide | |||
| Dissecting microscope (Magnification of at least 10x) | |||
| Ethanol - 190 Proof | |||
| Falcon polystyrene 96 well microplates, flat-bottom | Fisher Scientific | 08-772-3 | |
| Glass Alcohol Burner Wick | Fisher Scientific | S41898A / No. W-125 | |
| Glass Alcohol Burners | Fisher Scientific | S41898 / No. BO125 | |
| Glycerol ACS reagent | VWR International | EMGX0185-5 | |
| Kimberly-Clark™ Kimtech Science™ Kimwipes™ Delicate Task Wipers | Fisher Scientific | 06-666-A | |
| Magnesium chloride, ACS grade | VWR International | 97061-356 | |
| Magnesium sulfate heptahydrate, ACS grade | VWR International | 97062-130 | |
| Microcentrifuge tubes, 1.5 mL | |||
| Microcentrifuge tubes, 2.2 mL | |||
| Mini Beadbeater-96, 115 volt | Bio Spec Products Inc. | 1001 | |
| Murashige & Skoog, Basal Salts | Caisson Laboratories, Inc. | MSP01-50LT | |
| Pipet-Lite XLS LTS 8-CH Pipet 20-200uL | Rainin | L8-200XLS | |
| Pipet-Lite XLS LTS 8-CH Pipet 2-20uL | Rainin | L8-20XLS | |
| Polystyrene 100mm x 25mm sterile petri dish | VWR International | 89107-632 | |
| Polystyrene 150mm x 15mm sterile petri dish | Fisher Scientific | FB08-757-14 | |
| Polystyrene 150x15mm sterile petri dish | Fisher Scientific | 08-757-148 | |
| Pure Bright Germicidal Ultra Bleach 5.7% Available Chlorine (defined as 100% bleach) | Staples | 1013131 | |
| Rifampicin | Gold Biotechnology | R-120-25 | |
| Silwet L-77 (non-ionic organosilicone surfactant co-polymer C13H34O4Si3 surfactant) | Fisher Scientific | NCO138454 | |
| Tips LTS 20 μL 960/10 GPS-L10 | Rainin | 17005091 | |
| Tips LTS 250 μL 960/10 GPS-L250 | Rainin | 17005093 | |
| VWR dissecting forceps fine tip, 4.5" | VWR International | 82027-386 |
Références
- Underwood, W., Melotto, M., He, S. Y. Role of plant stomata in bacterial invasion. Cell Microbiology. 9 (7), 1621-1629 (2007).
- Zipfel, C. Early molecular events in PAMP-triggered immunity. Current Opinion in Plant Biology. 12 (4), 414-420 (2009).
- Galan, J. E., Wolf-Watz, H. Protein delivery into eukaryotic cells by type III secretion machines. Nature. 444 (7119), 567-573 (2006).
- Lewis, J. D., Desveaux, D., Guttman, D. S. The targeting of plant cellular systems by injected type III effector proteins. Seminars in Cell and Developmental Biology. 20 (9), 1055-1063 (2009).
- Schreiber, K. J., Baudin, M., Hassan, J. A., Lewis, J. D. Die another day: molecular mechanisms of effector-triggered immunity elicited by type III secreted effector proteins. Seminars in Cell and Developmental Biology. 56, 124-133 (2016).
- Heath, M. C. Hypersensitive response-related death. Plant Molecular Biology. 44 (3), 321-334 (2000).
- Boyd, L. A., Ridout, C., O'Sullivan, D. M., Leach, J. E., Leung, H. Plant-pathogen interactions: disease resistance in modern agriculture. Trends in Genetics. 29 (4), 233-240 (2013).
- Pitblado, R. E., MacNeill, B. H. Genetic basis of resistance to Pseudomonas syringae pv. tomato in field tomatoes. Canadian Journal of Plant Pathology. 5 (4), 251-255 (1983).
- Pedley, K. F., Martin, G. B. Molecular basis of Pto-mediated resistance to bacterial speck disease in tomato. Annual Reviews of Phytopathology. 41, 215-243 (2003).
- Ronald, P. C., Salmeron, J. M., Carland, F. M., Mehta, A. Y., Staskawicz, B. J. The cloned avirulence gene AvrPto induces disease resistance in tomato cultivars containing the Pto resistance gene. Journal of Bacteriology. 174 (5), 1604-1611 (1992).
- Martin, G. B., et al. Map-based cloning of a protein kinase gene conferring disease resistance in tomato. Science. 262 (5138), 1432-1436 (1993).
- Salmeron, J. M., Barker, S. J., Carland, F. M., Mehta, A. Y., Staskawicz, B. J. Tomato mutants altered in bacterial disease resistance provide evidence for a new locus controlling pathogen recognition. Plant Cell. 6 (4), 511-520 (1994).
- Salmeron, J. M., et al. Tomato Prf is a member of the leucine-rich repeat class of plant disease resistance genes and lies embedded within the Pto kinase gene cluster. Cell. 86 (1), 123-133 (1996).
- Scofield, S. R., et al. Molecular basis of gene-for-gene specificity in bacterial speck disease of tomato. Science. 274 (5295), 2063-2065 (1996).
- Kunkeaw, S., Tan, S., Coaker, G. Molecular and evolutionary analyses of Pseudomonas syringae pv. tomato race 1. Molecular Plant-Microbe Interactions. 23 (4), 415-424 (2010).
- Cai, R., et al. The plant pathogen Pseudomonas syringae pv. tomato is genetically monomorphic and under strong selection to evade tomato immunity. PLoS Pathogens. 7 (8), 1002130(2011).
- Almeida, N. F., et al. A draft genome sequence of Pseudomonas syringae pv. tomato T1 reveals a type III effector repertoire significantly divergent from that of Pseudomonas syringae pv. tomato DC3000. Molecular Plant-Microbe Interactions. 22 (1), 52-62 (2009).
- Lin, N. C., Abramovitch, R. B., Kim, Y. J., Martin, G. B. Diverse AvrPtoB homologs from several Pseudomonas syringae pathovars elicit Pto-dependent resistance and have similar virulence activities. Applied and Environmental Microbiology. 72 (1), 702-712 (2006).
- Rose, L. E., Langley, C. H., Bernal, A. J., Michelmore, R. W. Natural variation in the Pto pathogen resistance gene within species of wild tomato (Lycopersicon). I. Functional analysis of Pto alleles. Genetics. 171 (1), 345-357 (2005).
- Thapa, S. P., Miyao, E. M., Davis, R. M., Coaker, G. Identification of QTLs controlling resistance to Pseudomonas syringae pv. tomato race 1 strains from the wild tomato Solanum habrochaites LA1777. Theoretical and Applied Genetics. 128 (4), 681-692 (2015).
- Bao, Z. L., et al. Identification of a candidate gene in Solanum habrochaites for resistance to a race 1 strain of Pseudomonas syringae pv. tomato. Plant Genome. 8 (3), 1-15 (2015).
- Hassan, J. A., Zhou, Y. J., Lewis, J. D. A rapid seedling resistance assay identifies wild tomato lines that are resistant to Pseudomonas syringae pv. tomato race 1. Molecular Plant-Microbe Interactions. 30 (9), 701-709 (2017).
- King, E. O., Ward, M. K., Raney, D. E. Two simple media for the demonstration of pyocyanin and fluorescin. Journal of Laboratory and Clinical Medicine. 44 (2), 301-307 (1954).
- Uppalapati, S. R., et al. Pathogenicity of Pseudomonas syringae pv. tomato on tomato seedlings: phenotypic and gene expression analyses of the virulence function of coronatine. Molecular Plant-Microbe Interactions. 21 (4), 383-395 (2008).
- Bhardwaj, V., Meier, S., Petersen, L. N., Ingle, R. A., Roden, L. C. Defence responses of Arabidopsis thaliana to infection by Pseudomonas syringae are regulated by the circadian clock. PLoS One. 6 (10), 26968(2011).
- Lu, H., McClung, C. R., Zhang, C. Tick tock: circadian regulation of plant innate immunity. Annual Review of Phytopathology. 55, 287-311 (2017).
- Wang, W., et al. Timing of plant immune responses by a central circadian regulator. Nature. 470 (7332), 110-114 (2011).
Access restricted. Please log in or start a trial to view this content.
Erratum
Formal Correction: Erratum: High-Throughput Identification of Resistance to Pseudomonas syringae pv. Tomato in Tomato using Seedling Flood Assay
Posted by JoVE Editors on 10/18/2023. Citeable Link.
An erratum was issued for: High-Throughput Identification of Resistance to Pseudomonas syringae pv. Tomato in Tomato using Seedling Flood Assay. The Introduction, Protocol, Representative Results and Discussion sections were updated.
The last paragraph of the Introduction section was updated from:
In the seedling flood assay described in this protocol, tomato seedlings are grown on Petri dishes of sterile Murashige and Skoog (MS) media for 10 days and then are flooded with an inoculum containing the bacteria of interest and a surfactant. Following flooding, seedlings can be quantitatively evaluated for disease resistance via bacterial growth assays. Additionally, seedling survival or death can act as a discrete resistance or disease phenotype 7–14 days after flooding. This approach offers a high-throughput alternative for screening large numbers of wild tomato accessions for resistance to Pst race 1 strains, such as Pst strain T1 (PstT1), and can easily be adapted to other bacterial strains of interest.
to:
In the seedling flood assay described in this protocol, tomato seedlings are grown on Petri dishes of sterile Murashige and Skoog (MS) media for 10 days and then are flooded with an inoculum containing the bacteria of interest and a surfactant. Following flooding, seedlings can be quantitatively evaluated for disease resistance via bacterial growth assays. Additionally, seedling survival or death can act as a discrete resistance or disease phenotype 7–14 days after flooding. This approach offers a high-throughput alternative for screening large numbers of wild tomato accessions for resistance to Pst race 1 strains, such as Pst strain 19 (Pst19), and can easily be adapted to other bacterial strains of interest.
Step 4.8 of the Protocol section was updated from:
- After 1 h, transfer the bottle to the biosafety cabinet and under aseptic conditions, add 1,600 µL of sterile 1 M MgSO4, and appropriate antibiotics to the media.
NOTE: For rifampicin resistant strains PstDC3000 and PstT1, use rifampicin dissolved in dimethylformamide at a final concentration of 50 µg/mL. Use cycloheximide dissolved in ethanol at a final concentration of 50 µg/mL to prevent fungal growth on the plates.
to:
- After 1 h, transfer the bottle to the biosafety cabinet and under aseptic conditions, add 1,600 µL of sterile 1 M MgSO4, and appropriate antibiotics to the media.
NOTE: For rifampicin resistant strains PstDC3000 and Pst19, use rifampicin dissolved in dimethylformamide at a final concentration of 50 µg/mL. Use cycloheximide dissolved in ethanol at a final concentration of 50 µg/mL to prevent fungal growth on the plates.
Step 5.2 of the Protocol section was updated from:
- Patch bacteria (i.e., PstT1) from a glycerol stock onto KB agar with appropriate antibiotics (section 4).
to:
- Patch bacteria (i.e., Pst19) from a glycerol stock onto KB agar with appropriate antibiotics (section 4).
Step 5.6 of the Protocol section was updated from:
- For PstT1, incubate the KB plate at 28 ˚C for 48 h prior to using bacteria in the flood experiment.
to:
- For Pst19, incubate the KB plate at 28 ˚C for 48 h prior to using bacteria in the flood experiment.
Step 6 of the Protocol section was updated from:
6. Preparation of PstT1 inoculum
to
6. Preparation of Pst19 inoculum
Step 6.2 of the Protocol section was updated from:
- Perform serial dilutions using sterile 10 mM MgCl2 solution in the biosafety cabinet. For PstT1, use a spectrophotometer to make inoculum with a starting concentration of OD600 = 0.1.
to:
- Perform serial dilutions using sterile 10 mM MgCl2 solution in the biosafety cabinet. For Pst19, use a spectrophotometer to make inoculum with a starting concentration of OD600 = 0.1.
Step 6.3 of the Protocol section was updated from:
- For PstT1, make a 1/10 dilution from the initial resuspension at OD600 = 0.1 to obtain a serial dilution at a concentration of OD600 = 0.01.
to:
- For Pst19, make a 1/10 dilution from the initial resuspension at OD600 = 0.1 to obtain a serial dilution at a concentration of OD600 = 0.01.
Step 8.3 of the Protocol section was updated from:
- Set a timer for 3 min. Measure 6 mL of final inoculum (PstT1 OD600 = 0.0075 [section 6] or PstDC3000 OD600 = 0.005 [section 7]) and transfer 6 mL of inoculum to each plate with the 10-day-old seedlings.
to:
- Set a timer for 3 min. Measure 6 mL of final inoculum (Pst19 OD600 = 0.0075 [section 6] or PstDC3000 OD600 = 0.005 [section 7]) and transfer 6 mL of inoculum to each plate with the 10-day-old seedlings.
Step 8.11 of the Protocol section was updated from:
- Phenotype after 7–10 days for PstDC3000 or 10–14 days for PstT1 (section 11). If carrying out bacterial growth assays, collect leaf tissue after 4 days (sections 9 and 10) and then phenotype (section 11). Alternatively, perform phenotypic analysis and bacterial growth assays on separate sets of plants.
to:
- Phenotype after 7–10 days for PstDC3000 or 10–14 days for Pst19 (section 11). If carrying out bacterial growth assays, collect leaf tissue after 4 days (sections 9 and 10) and then phenotype (section 11). Alternatively, perform phenotypic analysis and bacterial growth assays on separate sets of plants.
Step 10.7 of the Protocol section was updated from:
- After obtaining colony counts (Figure 2B), normalize the counts to 0.01 g of tissue for seedlings and convert to log bacterial growth (Table 1).
NOTE: The average mass of one Moneymaker-PtoS cotyledon is 0.01 g and is empirically determined22.
| Genotype1 Column A | Tissue Weight (g) Column B | # of Colonies in a spot Column C | Dilution factor for spot2 Column D | Adjusted # of Colonies3 Column E | Dilution factor for serial dilution Column F | Total # of Colonies Column G (cfu/0.01 g)4 | Average # of Colonies (cfu/0.01 g) Column H | Average Log Growth (cfu/0.01 g (log10)) Column I |
| Sample 1 | 0.004 g | 10 | 200 | calculated as: (C2 x 0.01 g) / B2 = 25 | 1000 | calculated as: (D2 x E2 x F2) = 5000000 | average for sample 1 through last sample: (ie. average G1:G3) = 7000000 | log of average ie. log(H2) = 6.85 |
| Sample 2 | 0.003 g | 15 | 200 | 50 | 1000 | 10000000 | ||
| Sample 3 | 0.002 g | 6 | 200 | 30 | 1000 | 6000000 | ||
| 1Data shown for 3 samples | ||||||||
| 2Based on plating 5 µL x 200 for 1 mL | ||||||||
| 3Cotyledons are too small to core so colony counts were normalized to 0.01 g of tissue based on the average mass of one MoneyMaker-PtoS cotyledon (data not shown) | ||||||||
| 4Adjusted per mL based on volume plated | ||||||||
Table 1: Sample calculations for seedling bacterial growth assay. Sample calculations demonstrate how to normalize bacterial counts and determine log bacterial growth.
to:
- After obtaining colony counts (Figure 2B), normalize the counts to 0.1 g of tissue for seedlings and convert to log bacterial growth (Table 1).
NOTE: The average mass of one Moneymaker-PtoS cotyledon is 0.1 g and is empirically determined22.
| Genotype1 Column A | Tissue Weight (g) Column B | # of Colonies in a spot Column C | Dilution factor for spot2 Column D | Adjusted # of Colonies3 Column E | Dilution factor for serial dilution Column F | Total # of Colonies Column G (cfu/0.01 g)4 | Average # of Colonies (cfu/0.01 g) Column H | Average Log Growth (cfu/0.1 g (log10)) Column I |
| Sample 1 | 0.04 g | 10 | 200 | calculated as: (C2 x 0.1 g) / B2 = 25 | 1000 | calculated as: (D2 x E2 x F2) = 5000000 | average for sample 1 through last sample: (ie. average G1:G3) = 7000000 | log of average ie. log(H2) = 6.85 |
| Sample 2 | 0.03 g | 15 | 200 | 50 | 1000 | 10000000 | ||
| Sample 3 | 0.02 g | 6 | 200 | 30 | 1000 | 6000000 | ||
| 1Data shown for 3 samples | ||||||||
| 2Based on plating 5 µL x 200 for 1 mL | ||||||||
| 3Cotyledons are too small to core so colony counts were normalized to 0.1 g of tissue based on the average mass of one MoneyMaker-PtoS cotyledon (data not shown) | ||||||||
| 4Adjusted per mL based on volume plated | ||||||||
Table 1: Sample calculations for seedling bacterial growth assay. Sample calculations demonstrate how to normalize bacterial counts and determine log bacterial growth.
Step 11.3 of the Protocol section was updated from:
- Phenotype plants infected with PstT1 at 10–14 days after flood inoculation.
to:
- Phenotype plants infected with Pst19 at 10–14 days after flood inoculation.
Figure 4 in the Protocol section was updated from:
Figure 4: Schematic representation of expected phenotypes for seedling resistance and death in various genetic backgrounds. (A) Seedlings of Rio Grande-PtoR and the near-isogenic cultivar Rio Grande-PtoS are displayed 7 days after flooding with PstDC3000 (OD600 = 0.005) + 0.015% surfactant. Rio Grande-PtoR displays consistent resistance, and Rio Grande-PtoS displays consistent susceptibility to infection with PstDC3000. These lines give rise to discrete and binary phenotypes. (B) Seedlings of a wild accession, such as Solanum neorickii LA1329, are shown 10 days after flooding with PstT1 (OD600 = 0.0075) + 0.015% surfactant. Seedlings display phenotypic variability but were recorded as binary phenotypes. The amount of phenotypic variability and the method of phenotyping (binary resistance or resistance spectrum) will depend on the particular accession tested. (C) Mapping populations generated by outcrossing wild accessions to susceptible cultivars may display a wider spectrum of phenotypes in F2 segregating populations. In this case, it may be most appropriate to record seedling phenotypes on a spectrum. Highly susceptible seedlings from a mapping population may be phenotyped for death as early as day 7 when flooded with PstT1, and typically show a brown apical meristem, no to very little extension of the epicotyl, and no new, green vegetative growth. The apical meristem of susceptible seedlings may stay green or very light brown for more time, and there may be some extension of the epicotyl and very little vegetative growth, which turns brown and arrests by day 10. Individual seedlings can be phenotyped for resistance based on the amount of new and ongoing vegetative growth by day 14. Seedlings can then be grouped based on the phenotypes described above into different categories of resistance such as weak, medium, or strong resistance. Please click here to view a larger version of this figure.
to:
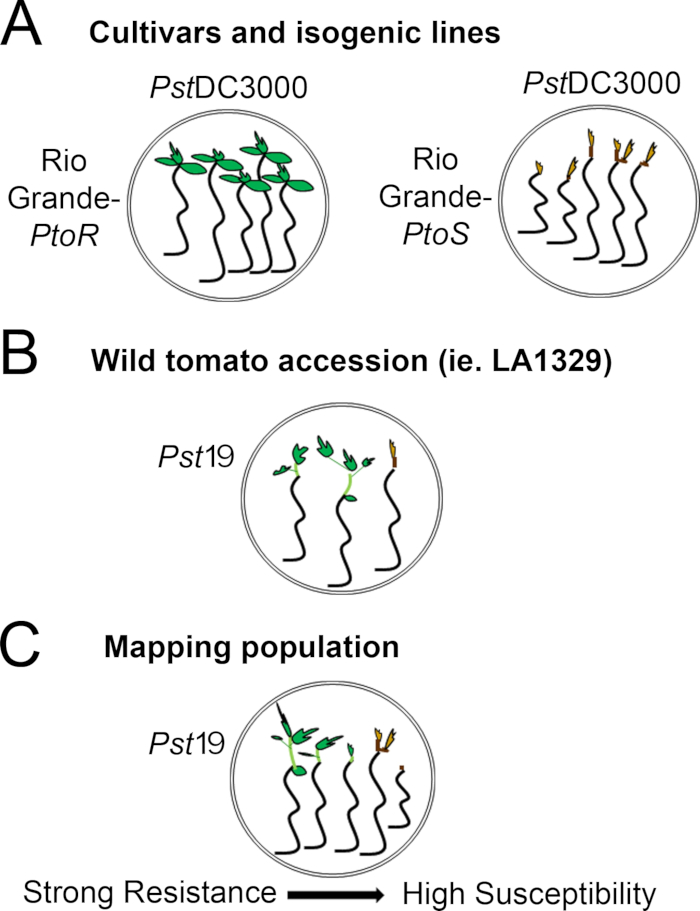
Figure 4: Schematic representation of expected phenotypes for seedling resistance and death in various genetic backgrounds. (A) Seedlings of Rio Grande-PtoR and the near-isogenic cultivar Rio Grande-PtoS are displayed 7 days after flooding with PstDC3000 (OD600 = 0.005) + 0.015% surfactant. Rio Grande-PtoR displays consistent resistance, and Rio Grande-PtoS displays consistent susceptibility to infection with PstDC3000. These lines give rise to discrete and binary phenotypes. (B) Seedlings of a wild accession, such as Solanum neorickii LA1329, are shown 10 days after flooding with Pst19 (OD600 = 0.0075) + 0.015% surfactant. Seedlings display phenotypic variability but were recorded as binary phenotypes. The amount of phenotypic variability and the method of phenotyping (binary resistance or resistance spectrum) will depend on the particular accession tested. (C) Mapping populations generated by outcrossing wild accessions to susceptible cultivars may display a wider spectrum of phenotypes in F2 segregating populations. In this case, it may be most appropriate to record seedling phenotypes on a spectrum. Highly susceptible seedlings from a mapping population may be phenotyped for death as early as day 7 when flooded with Pst19, and typically show a brown apical meristem, no to very little extension of the epicotyl, and no new, green vegetative growth. The apical meristem of susceptible seedlings may stay green or very light brown for more time, and there may be some extension of the epicotyl and very little vegetative growth, which turns brown and arrests by day 10. Individual seedlings can be phenotyped for resistance based on the amount of new and ongoing vegetative growth by day 14. Seedlings can then be grouped based on the phenotypes described above into different categories of resistance such as weak, medium, or strong resistance. Please click here to view a larger version of this figure.
The second paragraph of the Representative Results section was updated from:
Phenotypic screening of wild accessions using the seedling resistance assay
Figure 6 shows representative results for seedlings of susceptible and resistant accessions 10–14 days after flooding with PstT1. Susceptible accessions include RG-PtoR, S. pimpinellifolium LA1375, and S. pimpinellifolium LA1606, and resistant accessions include S. neorickii LA1329. Ten-day-old seedlings were flooded with 10 mM MgCl2 + 0.015% surfactant as a negative control, and PstT1 at an optical density of 0.0075 + 0.015% surfactant. The seedlings were phenotyped at least 10 days after flooding, as PstT1-infected seedlings died more slowly than PstDC3000-infected seedlings. Mock-inoculated seedlings were green, healthy, and actively growing. This control is important to ensure that the accessions are not sensitive to the concentration of surfactant, and to ensure there is no bacterial contamination. Susceptible accessions (Rio Grande-PtoR [n = 7], S. pimpinellifolium LA1375 [n = 7], and S. pimpinellifolium LA1606 [n = 5]) were dead, had brown apical meristems, and lacked new growth 10–14 days after inoculation with PstT1. In contrast, two S. neorickii LA1329 (n = 3) seedlings displayed a high level of new, green growth and survived infection with PstT1 (Figure 6). Three LA1329 seedlings did not germinate. Typically, 5–7 individuals were screened for each accession in a primary screen to determine the prevalence of resistance in the population. When a more genetically complex wild accession, such as LA1329, is flooded with PstT1, the resistance phenotypes display slightly more variability among individual seedlings, compared to Moneymaker-PtoR treated with PstDC3000. However, the resistance phenotypes were usually less variable than those seen in F2 mapping populations. Thus, binary phenotyping criteria was used for LA1329.
to:
Phenotypic screening of wild accessions using the seedling resistance assay
Figure 6 shows representative results for seedlings of susceptible and resistant accessions 10–14 days after flooding with Pst19. Susceptible accessions include RG-PtoR, S. pimpinellifolium LA1375, and S. pimpinellifolium LA1606, and resistant accessions include S. neorickii LA1329. Ten-day-old seedlings were flooded with 10 mM MgCl2 + 0.015% surfactant as a negative control, and Pst19 at an optical density of 0.0075 + 0.015% surfactant. The seedlings were phenotyped at least 10 days after flooding, as Pst19-infected seedlings died more slowly than PstDC3000-infected seedlings. Mock-inoculated seedlings were green, healthy, and actively growing. This control is important to ensure that the accessions are not sensitive to the concentration of surfactant, and to ensure there is no bacterial contamination. Susceptible accessions (Rio Grande-PtoR [n = 7], S. pimpinellifolium LA1375 [n = 7], and S. pimpinellifolium LA1606 [n = 5]) were dead, had brown apical meristems, and lacked new growth 10–14 days after inoculation with Pst19. In contrast, two S. neorickii LA1329 (n = 3) seedlings displayed a high level of new, green growth and survived infection with Pst19 (Figure 6). Three LA1329 seedlings did not germinate. Typically, 5–7 individuals were screened for each accession in a primary screen to determine the prevalence of resistance in the population. When a more genetically complex wild accession, such as LA1329, is flooded with Pst19, the resistance phenotypes display slightly more variability among individual seedlings, compared to Moneymaker-PtoR treated with PstDC3000. However, the resistance phenotypes were usually less variable than those seen in F2 mapping populations. Thus, binary phenotyping criteria was used for LA1329.
Figure 6 in the Representative Results section was updated from:
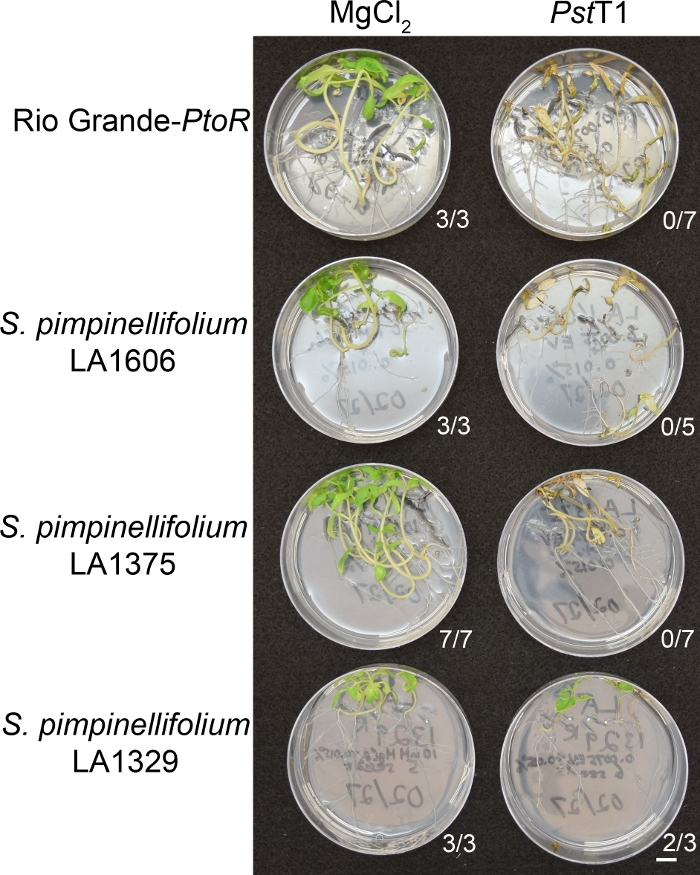
Figure 6: Phenotypic characterization of resistance or disease symptoms 10–14 days post-infection in wild accessions. Rio Grande-PtoR, S. pimpinellifolium LA1606, S. pimpinellifolium LA1375 and S. neorickii LA1329 tomato seedlings were grown on 0.5x MS plates for 10 days, and then flooded with PstT1 (OD600 = 0.0075) + 0.015% surfactant. The number of surviving seedlings for each wild accession out of the total number tested is shown. Scale bar = 1 cm. Please click here to view a larger version of this figure.
to:
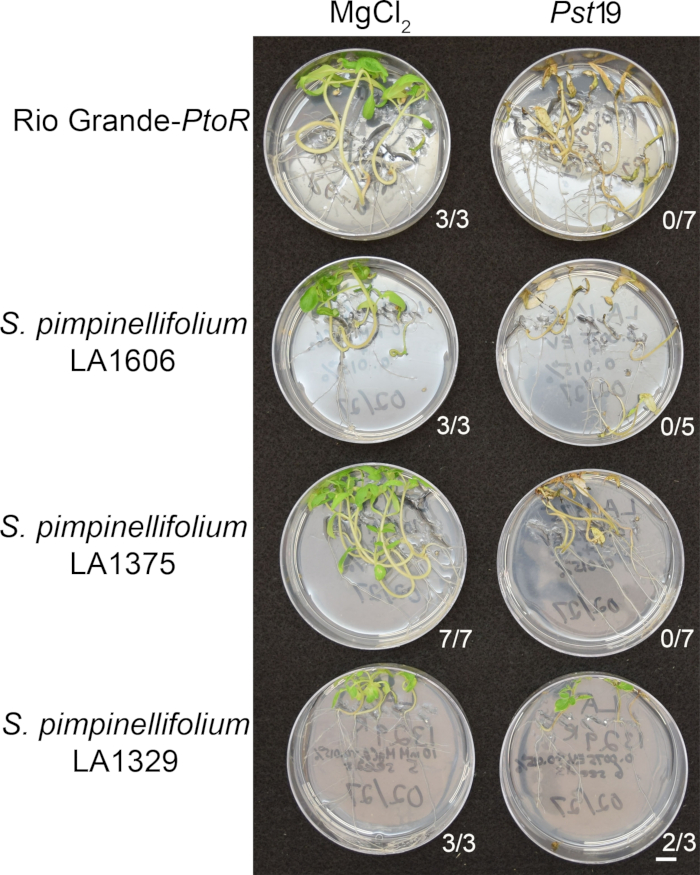
Figure 6: Phenotypic characterization of resistance or disease symptoms 10–14 days post-infection in wild accessions. Rio Grande-PtoR, S. pimpinellifolium LA1606, S. pimpinellifolium LA1375 and S. neorickii LA1329 tomato seedlings were grown on 0.5x MS plates for 10 days, and then flooded with Pst19 (OD600 = 0.0075) + 0.015% surfactant. The number of surviving seedlings for each wild accession out of the total number tested is shown. Scale bar = 1 cm. Please click here to view a larger version of this figure.
The third paragraph of the Representative Results section was updated from:
Quantitative assessment of bacterial growth using the seedling flood assay
To confirm that the observed resistance in LA1329 to PstT1 resulted in lower bacterial growth, bacterial growth assays were carried out in tomato seedlings. The level of PstT1 growth in Moneymaker-PtoS and S. neorickii LA1329 was determined 4 days post-infection. Moneymaker-PtoS is a near-isogenic line with consistent susceptibility among individual seedlings. Wild accessions such as S. neorickii LA1329 are often more genetically complex. LA1329 displays approximately 60% resistance to PstT1 across the population22. Because seedlings may drop their cotyledons after infection, one seedling was grown on each plate to correlate bacterial growth in the harvested cotyledon with overall seedling survival or death as determined phenotypically at least 10 days after flooding. The bacterial counts on day 4 for each seedling were normalized to 0.01 g of tissue and converted to log growth (CFU/0.01 g(log10)). Log growth for phenotypically resistant LA1329 seedlings (LA1329RES) or phenotypically susceptible seedlings (LA1329SUS) were separately pooled and compared to each other and the susceptible cultivar Moneymaker-PtoS. For example, there was a 1.7 log difference in bacterial growth between LA1329RES (log 6.3) and LA1329SUS (log 8.0), and a 1.6 log difference between LA1329RES (log 6.3) and Moneymaker-PtoS (log 7.9) (Figure 7). Therefore, phenotypic resistance correlated with quantitative resistance in the seedling assays.
to:
Quantitative assessment of bacterial growth using the seedling flood assay
To confirm that the observed resistance in LA1329 to Pst19 resulted in lower bacterial growth, bacterial growth assays were carried out in tomato seedlings. The level of Pst19 growth in Moneymaker-PtoS and S. neorickii LA1329 was determined 4 days post-infection. Moneymaker-PtoS is a near-isogenic line with consistent susceptibility among individual seedlings. Wild accessions such as S. neorickii LA1329 are often more genetically complex. LA1329 displays approximately 60% resistance to Pst19 across the population22. Because seedlings may drop their cotyledons after infection, one seedling was grown on each plate to correlate bacterial growth in the harvested cotyledon with overall seedling survival or death as determined phenotypically at least 10 days after flooding. The bacterial counts on day 4 for each seedling were normalized to 0.01 g of tissue and converted to log growth (CFU/0.01 g(log10)). Log growth for phenotypically resistant LA1329 seedlings (LA1329RES) or phenotypically susceptible seedlings (LA1329SUS) were separately pooled and compared to each other and the susceptible cultivar Moneymaker-PtoS. For example, there was a 1.7 log difference in bacterial growth between LA1329RES (log 6.3) and LA1329SUS (log 8.0), and a 1.6 log difference between LA1329RES (log 6.3) and Moneymaker-PtoS (log 7.9) (Figure 7). Therefore, phenotypic resistance correlated with quantitative resistance in the seedling assays.
Figure 7 in the Representative Results section was updated from:
x
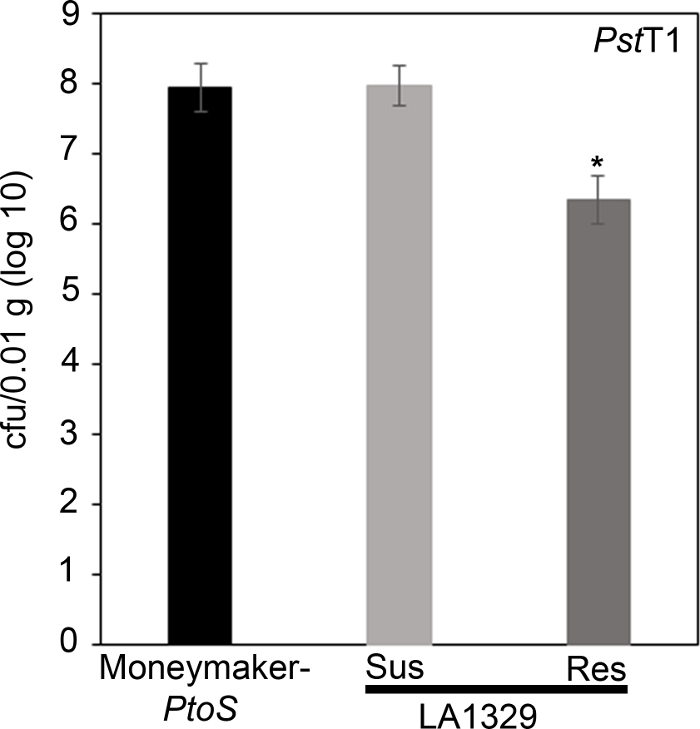
Figure 7: Resistant Solanum neorickii LA1329 seedlings support lower bacterial growth than Moneymaker-PtoS or susceptible S. neorickii LA1329. Bacterial counts were determined 4 days post-inoculation from S. neorickii LA1329 (n = 14) and Moneymaker-PtoS (n = 10) seedlings infected with PstT1 and normalization was performed to 0.01 g of tissue. For LA1329, the two phenotypic groups, susceptible (SUS) or resistant (RES), were observed and counted separately. Above the bar * = statistically significant difference determined by a one-factor analysis of variance. A general linear model procedure (p < 0.001) followed by a multiple comparison of means using Tukey's post hoc test was used. Error bars = standard error. The figure indicates one representative experiment. Please click here to view a larger version of this figure.
x
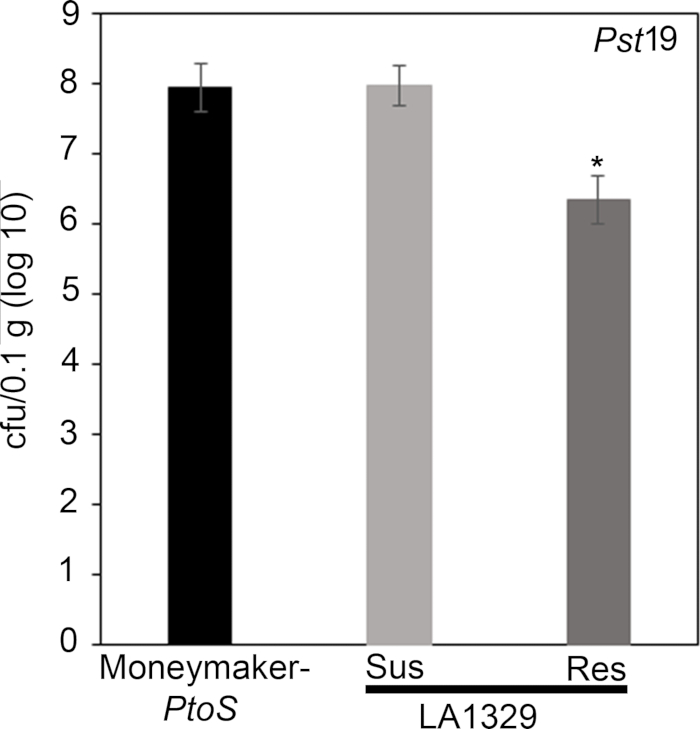
Figure 7: Resistant Solanum neorickii LA1329 seedlings support lower bacterial growth than Moneymaker-PtoS or susceptible S. neorickii LA1329. Bacterial counts were determined 4 days post-inoculation from S. neorickii LA1329 (n = 14) and Moneymaker-PtoS (n = 10) seedlings infected with Pst19 and normalization was performed to 0.1 g of tissue. For LA1329, the two phenotypic groups, susceptible (SUS) or resistant (RES), were observed and counted separately. Above the bar * = statistically significant difference determined by a one-factor analysis of variance. A general linear model procedure (p < 0.001) followed by a multiple comparison of means using Tukey's post hoc test was used. Error bars = standard error. The figure indicates one representative experiment. Please click here to view a larger version of this figure.
The first paragraph of the Discussion section was updated from:
A protocol for flood inoculation with PstDC3000 or PstT1 optimized to detect resistance to these bacterial strains in tomato seedlings is described. There are several critical parameters for optimal results in the seedling resistance assay, including bacterial concentration and surfactant concentration, which were empirically determined22. For PstDC3000, the optical density was optimized to achieve complete survival on a resistant cultivar containing the Pto/Prf cluster and complete death on a susceptible cultivar lacking the Pto/Prf cluster22. For a strain such as PstT1, where there are no known resistant varieties, the optical density was optimized to be the lowest possible for consistent and complete plant death22. Uppalapati et al.24 designed a tomato seedling assay to investigate the pathogenesis of PstDC3000 and the virulence function of coronatine. In this virulence assay, infections were performed using bacteria concentrated to an OD600 of 0.124, 20x higher than the optical density of strains used in our resistance assay. Recognition of PstDC3000 effectors AvrPto and AvrPtoB in tomato seedlings carrying the Pto/Prf gene cluster results in ETI and a macroscopic HR22. In the context of a strong immune response such as ETI, a lower bacterial titer was used for PstDC3000 to avoid overwhelming genetic resistance from the Pto/Prf gene cluster22. In addition, these results suggest that a high bacterial concentration could overwhelm weaker immune responses such as PTI or quantitative partial resistance, where multiple genes contribute to the overall phenotype. Surfactant is necessary for the bacteria to adhere to the leaf surface; however, high concentrations can cause chlorosis of the leaf22. We previously tested a range of surfactant concentrations to empirically determine the ideal concentration in 10-day-old tomato seedlings22. When testing new species that may differ in their sensitivity to surfactant, the surfactant concentration should be optimized to identify a concentration that does not cause damage or chlorosis in the absence of bacteria. Appropriate assay conditions will require optimization of a surfactant concentration that does not cause damage, and a bacterial concentration that causes disease in all susceptible controls.
to:
A protocol for flood inoculation with PstDC3000 or Pst19 optimized to detect resistance to these bacterial strains in tomato seedlings is described. There are several critical parameters for optimal results in the seedling resistance assay, including bacterial concentration and surfactant concentration, which were empirically determined22. For PstDC3000, the optical density was optimized to achieve complete survival on a resistant cultivar containing the Pto/Prf cluster and complete death on a susceptible cultivar lacking the Pto/Prf cluster22. For a strain such as Pst19, where there are no known resistant varieties, the optical density was optimized to be the lowest possible for consistent and complete plant death22. Uppalapati et al.24 designed a tomato seedling assay to investigate the pathogenesis of PstDC3000 and the virulence function of coronatine. In this virulence assay, infections were performed using bacteria concentrated to an OD600 of 0.124, 20x higher than the optical density of strains used in our resistance assay. Recognition of PstDC3000 effectors AvrPto and AvrPtoB in tomato seedlings carrying the Pto/Prf gene cluster results in ETI and a macroscopic HR22. In the context of a strong immune response such as ETI, a lower bacterial titer was used for PstDC3000 to avoid overwhelming genetic resistance from the Pto/Prf gene cluster22. In addition, these results suggest that a high bacterial concentration could overwhelm weaker immune responses such as PTI or quantitative partial resistance, where multiple genes contribute to the overall phenotype. Surfactant is necessary for the bacteria to adhere to the leaf surface; however, high concentrations can cause chlorosis of the leaf22. We previously tested a range of surfactant concentrations to empirically determine the ideal concentration in 10-day-old tomato seedlings22. When testing new species that may differ in their sensitivity to surfactant, the surfactant concentration should be optimized to identify a concentration that does not cause damage or chlorosis in the absence of bacteria. Appropriate assay conditions will require optimization of a surfactant concentration that does not cause damage, and a bacterial concentration that causes disease in all susceptible controls.
The third paragraph of the Discussion section was updated from:
Pst is a foliar pathogen that preferentially colonizes the aerial parts of tomato seedlings, including the cotyledons24 (Figure 3). Therefore, qualitative phenotyping in the seedling flood assay focuses on growth and disease symptoms in aerial portions of the seedling, and tissue for the bacterial growth assay is sampled from the cotyledons for quantitative analysis. After flood inoculation, seedlings may die within 7–10 days after inoculation with PstDC3000 or 10–14 days after inoculation with PstT1, as discussed in section 11. Seedling death is visualized by a brown apical meristem, arrested epicotyl elongation, and/or arrested vegetative growth. If different bacterial strains are used, the timing will have to be empirically determined. In addition, the progression of disease on control plants should be monitored daily after flooding until a consistent time frame from the onset of disease symptoms to seedling death can be identified. Depending on the genotypes and treatments used in the flood assay, seedling phenotypes can be recorded as binary phenotypes or on a disease spectrum (Figure 4). A broader spectrum of phenotypes may be observed when flood inoculating F2 mapping populations from wild tomato accessions crossed to susceptible cultivars (Figure 4C). It may be best to phenotype segregating populations on a disease spectrum depending on how quickly the seedling dies and the degree of new vegetative growth and branching (Figure 4C). The seedling flood assay can also be used in conjunction with the seedling bacterial growth assay to quantitatively assess levels of bacterial growth associated with qualitative phenotypes in individual seedlings (Figure 7). Very large reductions (i.e., ~log 3) in bacterial growth or strong resistance in resistant seedlings of a wild accession compared to a susceptible cultivar suggest that the underlying genetic basis of resistance may be due to ETI22. Smaller reductions in bacterial growth (i.e., ~log 1.7), as observed in LA1329 seedlings, may be due to the contribution of weaker resistance from quantitative trait loci and/or PTI. Thus, the seedling growth assay can be an important tool in further characterizing resistance in wild tomato lines.
to:
Pst is a foliar pathogen that preferentially colonizes the aerial parts of tomato seedlings, including the cotyledons24 (Figure 3). Therefore, qualitative phenotyping in the seedling flood assay focuses on growth and disease symptoms in aerial portions of the seedling, and tissue for the bacterial growth assay is sampled from the cotyledons for quantitative analysis. After flood inoculation, seedlings may die within 7–10 days after inoculation with PstDC3000 or 10–14 days after inoculation with Pst19, as discussed in section 11. Seedling death is visualized by a brown apical meristem, arrested epicotyl elongation, and/or arrested vegetative growth. If different bacterial strains are used, the timing will have to be empirically determined. In addition, the progression of disease on control plants should be monitored daily after flooding until a consistent time frame from the onset of disease symptoms to seedling death can be identified. Depending on the genotypes and treatments used in the flood assay, seedling phenotypes can be recorded as binary phenotypes or on a disease spectrum (Figure 4). A broader spectrum of phenotypes may be observed when flood inoculating F2 mapping populations from wild tomato accessions crossed to susceptible cultivars (Figure 4C). It may be best to phenotype segregating populations on a disease spectrum depending on how quickly the seedling dies and the degree of new vegetative growth and branching (Figure 4C). The seedling flood assay can also be used in conjunction with the seedling bacterial growth assay to quantitatively assess levels of bacterial growth associated with qualitative phenotypes in individual seedlings (Figure 7). Very large reductions (i.e., ~log 3) in bacterial growth or strong resistance in resistant seedlings of a wild accession compared to a susceptible cultivar suggest that the underlying genetic basis of resistance may be due to ETI22. Smaller reductions in bacterial growth (i.e., ~log 1.7), as observed in LA1329 seedlings, may be due to the contribution of weaker resistance from quantitative trait loci and/or PTI. Thus, the seedling growth assay can be an important tool in further characterizing resistance in wild tomato lines.
The fourth paragraph of the Discussion section was updated from:
Typically, genetic screens have been performed on four- to five-week-old adult tomato plants to identify the genetic basis of P. syringae resistance in wild accessions20,21. Adult tomato plants require much longer growth times, require more space in the growth chamber, and are much larger plants, which means that usually few individuals are screened for each line. The seedling flood assay provides a powerful, alternative approach in the identification of P. syringae resistance in wild tomato accessions. Screening at the seedling stage permits a large sample size to be tested which can be particularly advantageous in detecting resistance in genetically complex populations. Reduced growth chamber space requirements and growth time facilitate a high-throughput approach and rapid detection of natural resistance in wild accessions to emerging pathogens. Furthermore, P. syringae resistance that was identified at the seedling stage in this assay is not restricted to the developmental stage. S. neorickii LA1329 and S. habrochaites LA1253 were initially identified at the seedling stage and also display resistance to PstT1 in adult plants as previously described22.
to:
Typically, genetic screens have been performed on four- to five-week-old adult tomato plants to identify the genetic basis of P. syringae resistance in wild accessions20,21. Adult tomato plants require much longer growth times, require more space in the growth chamber, and are much larger plants, which means that usually few individuals are screened for each line. The seedling flood assay provides a powerful, alternative approach in the identification of P. syringae resistance in wild tomato accessions. Screening at the seedling stage permits a large sample size to be tested which can be particularly advantageous in detecting resistance in genetically complex populations. Reduced growth chamber space requirements and growth time facilitate a high-throughput approach and rapid detection of natural resistance in wild accessions to emerging pathogens. Furthermore, P. syringae resistance that was identified at the seedling stage in this assay is not restricted to the developmental stage. S. neorickii LA1329 and S. habrochaites LA1253 were initially identified at the seedling stage and also display resistance to Pst19 in adult plants as previously described22.
Réimpressions et Autorisations
Demande d’autorisation pour utiliser le texte ou les figures de cet article JoVE
Demande d’autorisationThis article has been published
Video Coming Soon
À PROPOS DE JoVE
Copyright © 2025 MyJoVE Corporation. Tous droits réservés.