
Для просмотра этого контента требуется подписка на Jove Войдите в систему или начните бесплатную пробную версию.
Method Article
Высокопроходичная идентификация сопротивления Pseudomonas syringae pv. Помидор в томате с использованием рассеять рассаду наводнение
В этой статье
Erratum Notice
Резюме
Анализ потопа саженцев облегчает быстрый скрининг диких томатов на устойчивость к бактерии Pseudomonas шприцев. Этот опрос, используемый в сочетании с рассеиванием бактериального роста, может помочь в дальнейшей характеристике основной резистентности к бактерии, и может быть использован для отображения данных для определения генетической основы резистентности.
Аннотация
Помидор является агрономически важной культурой, которая может быть заражена Pseudomonas шприцев, Грам-отрицательных бактерий, в результате бактериальной болезни пятнышко. Помидор-P. syringae pv. томатная патосистема широко используется для вскрытия генетической основы врожденных реакций растений и устойчивости к болезням. В то время как болезнь успешно управляется в течение многих десятилетий путем введения кластера генов Pto/Prf из Solanum pimpinellifolium в культивируемые помидоры, раса 1 штаммов P. syringae эволюционировали, чтобы преодолеть сопротивление, присуждаемое кластером генов Pto/Prf и происходит во всем мире.
Дикие виды томатов являются важными резервуарами естественного разнообразия в распознавании патогенов, потому что они развивались в различных средах с различным иным патогенным давлением. В типичных экранах для сопротивления заболевания в одичалых томатах, взрослые заводы использованы, которые могут ограничивать число заводов которые можно экранировать из-за их выдвинутого времени роста и больших требований пространства роста. Мы разработали метод проверки 10-дневных саженцев томатов на устойчивость, который минимизирует время роста растений и пространство камеры роста, позволяет быстро текучесть растений, и позволяет проверить большие размеры выборки. Результаты семени выживания или смерти можно рассматривать как дискретные фенотипы или по шкале сопротивления, определяемой количеством нового роста выживших саженцев после наводнения. Этот метод был оптимизирован для проверки 10-дневных саженцев томатов на устойчивость к двум штаммам P. syringae и может быть легко адаптирован к другим штаммам P. syringae.
Введение
Pseudomonas syringae является грамотрицательным патогенной бактерией, которая заражает широкий спектр растительных хозяев. Бактерии попадают в растение-хозяина через стоматы или физические раны и размножаться в апопласте 1. Растения развили двухуровневый иммунный ответ для защиты от инфекции бактериальными патогенами. Первый уровень происходит на поверхности клеток растений, где рецепторы распознавания образов на мембране клеток растений воспринимают высоко консервированные патогенно-ассоциированные молекулярные модели (PAMPs) в процессе, называемом PAMP-спровоцированный иммунитет (PTI)2. В ходе этого процесса, хозяин завода upregulates пути обороны ответ, в том числе осаждение кальяны на клеточной стенке, закрытие стомата, производство реактивных видов кислорода, и индукции патогенеза связанных генов.
Бактерии могут преодолеть PTI, используя систему секреции типа III для доставки белков, называемых эффекторами, непосредственно в клетку растения3. Эффекторные белки обычно нацелены на компоненты PTI и способствуют патогенной вирулентности4. Второй уровень растительного иммунитета возникает в растительной клетке при распознавании белков-эффекторов. Это признание зависит от генов устойчивости, которые кодируют нуклеотид-связывающий сайт, богатый лейкином, содержащий рецепторы (НЛР). НЛР способны либо распознавать эффекторов напрямую, либо распознавать их активность на вирулентности или приманку5. Затем они вызывают вторичный иммунный ответ в процессе, называемом эффектор-спровоцированный иммунитет (ETI), который часто связан с гиперчувствительной реакции (HR), форма локализованной смерти клеток в месте инфекции6. В отличие от генной резистентности, связанной с ETI, растения могут проявлять количественную частичную резистентность, которая зависит от вклада нескольких генов7.
P. syringae pv. помидор (Pst) является причинным агентом бактериальной пятнышко на помидоры и является постоянной сельскохозяйственной проблемой. Преобладающие штаммы в этой области, как правило, были Pst расы 0 штаммов, которые выражают либо или оба типа III эффекторов AvrPto и AvrPtoB. DC3000 (PstDC3000) является репрезентативной расы 0 штамма и модель патогена, который может вызвать бактериальные пятнышко в томатах. Для борьбы с бактериальной болезнью пятнышка, заводчики introgressed Pto pto p. syringae pv. помидоры/Prf -устойчивость Пто и чувствительность фентиона- генкластер из дикого вида томатов Solanum pimpinellifolium в современные сорта8,9. Ген Пто кодирует серино-threonine белка киназы, что, вместе с Prf NLR, придают устойчивость к PstDC3000 через признание эффекторов AvrPto и AvrPtoB10,11,12,13,14. Тем не менее, это сопротивление является неэффективным против возникающих расы 1 штаммов, что позволяет их быстрого и агрессивного распространения в последние годы15,16. Штаммы гонки 1 уклоняются от признания кластера Pto/Prf, потому что AvrPto либо теряется, либо мутирует в этих штаммах, а AvrPtoB, кажется, накапливает минимально15,17,18.
Дикие популяции томатов являются важными резервуарами естественного изменения устойчивости Pst и ранее использовались для выявления потенциальной устойчивости локусов19,20,21. Тем не менее, текущие экраны для возбудителя устойчивость использовать 4-5-недельный взрослых растений20,21. Таким образом, они ограничены временем роста, пространством камеры роста и относительно небольшими размерами выборки. Для устранения ограничений обычных подходов, мы разработали высокой пропускной томатной P. syringae сопротивление с использованием 10-дневных саженцев помидоров22. Этот подход предлагает ряд преимуществ по сравнению с использованием взрослых растений: а именно, более короткое время роста, снижение требований к пространству, и более высокую пропускную стоимость. Кроме того, мы продемонстрировали, что этот подход точно резюмирует фенотипы устойчивости к болезням, наблюдаемые у взрослых растений22.
В рассаде наводнений, описанных в этом протоколе, саженцы помидоров выращиваются на чашках Петри стерильных Мурашиге и Skoog (MS) сми в течение 10 дней, а затем наводнены инокулум, содержащий бактерии интереса и сурфактант. После наводнения, саженцы могут быть количественно оценены на устойчивость к болезням с помощью бактериальных анализов роста. Кроме того, выживание рассады или смерть может выступать в качестве дискретной резистентности или фенотипа болезни 7-14 дней после наводнения. Этот подход предлагает высокую пропускную стоимость альтернативу для скрининга большого количества диких томатов для сопротивления Pst расы 1 штаммов, таких как Штамм Pst T1 (PstT1), и может быть легко адаптирована к другим бактериальным штаммам интереса.
протокол
1. Подготовка и использование шкафа для биобезопасности
- Протрите шкаф биобезопасности с 70% этанола.
- Закройте пояс и включите ультрафиолетовый свет в шкафу биобезопасности в течение 15 минут.
- После 15 минут выключите ультрафиолетовый свет в шкафу для биобезопасности. Поднимите пояс и включите воздуходувку в течение 15 минут.
- Протрите все элементы, которые будут использоваться в кабинете биобезопасности с 70% этанола до сдачи элементов в стерилизованный шкаф.
- Чистые перчатки или голыми руками с 70% этанола перед работой в шкафу биобезопасности.
- Работа в центре шкафа биобезопасности, вдали от воздуходувки.
- Используйте неоткрытые бутылки автоклавированных стерильных 10 мМ MgCl2 и ультрачистый H2O для экспериментов. Положите бутылки в шкаф биобезопасности и только открыть их в стерилизованных биобезопасности шкаф, а не на скамейке.
- Используйте специальные стеклянные пипетки и пипетки советы для работы в стерилизованном шкафу биобезопасности. Убедитесь, что они открыты только в кабинете биобезопасности, никогда на скамейке.
- После использования шкафа биобезопасности, автоклавировать все отходы (кроме отбеливателя отходов) и протрите поверхность с 70% этанола.
2. Подготовка растительных носителей
- Взвесьте и растворите 0,5x MS базальных солей в ультрачистых H2O. Взвесить 0,8% бакто агар, а затем добавить в растворенный 0,5x MS.
- Autoclave и позволяют средствам массовой информации для охлаждения в 50 градусов воды в течение 1 ч до заливки или пипетки.
- Чтобы пластины не были переполнены, отметьте полистирол одноразовыми стерильными 100 х 25 мм пластин до уровня заполнения 40 мл. Налейте средства массовой информации в 100 х 25 мм стерильных пластин в стерилизованном шкафу биобезопасности.
3. Подготовка растительных материалов и условия роста
- Поместите семена помидоров в микроцентрифуге 2,2 мл и добавьте 2,0 мл 50% отбеливательного раствора.
- Рок трубки на рокер в течение 25 минут.
- После 25 мин, удалить семена из рокера и удалить отбеливатель раствор с пипеткой в стерильной биобезопасности шкаф. Убедитесь, что все отбеливатель удаляется.
- Добавьте 2 мл стерильных ультрачистых H2O, чтобы вымыть семена. Перевернуть трубку 5x.
- Удалить жидкость из трубки с пипеткой.
- Повторите шаги 3.3-3.5, чтобы вымыть семена в 4 раз больше.
- Добавьте 2 мл стерильных ультрачистых H2O и вылейте семена в пустую стерильную чашку Петри.
- Пламя щипцы в этанол и позволяют остыть до передачи и равномерно ежеразия семян на 100 х 25 мм пластин, содержащих 0,5x MS и 0,8% агар-носителей.
- Перенесите 5-7 семян в линию посередине одной тарелки и запечатайте края пластин хирургическим лентой (1,25 см х 9,1 м).
- Стратить стерилизованные семена при 4 градусах Цельсия в темноте в течение не менее 3 дней, чтобы синхронизировать прорастание. Убедитесь, что пластины укладываются плоскими и лицом вверх, так что семена не перемещаются на тарелку.
- Вертикально ориентируйте пластины так, чтобы корни росли вниз вдоль поверхности пластины, при передаче линии семян горизонтально, при передаче в камеру роста.
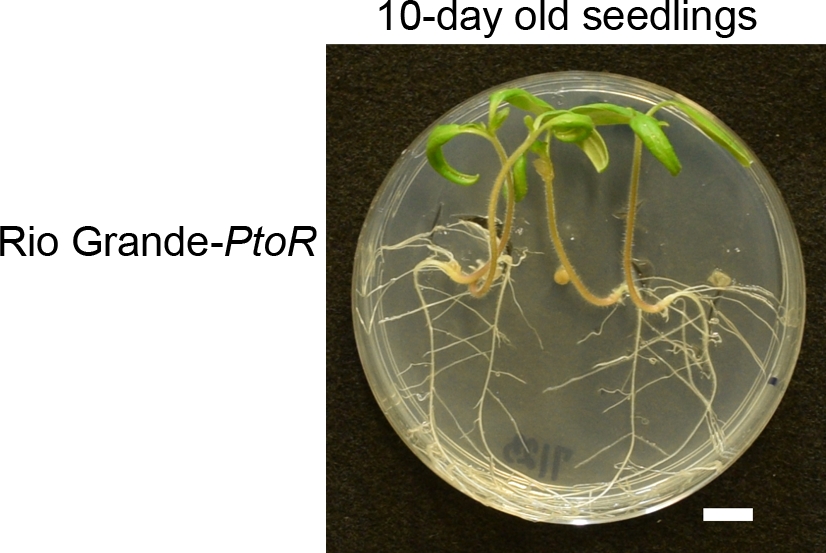
ПРИМЕЧАНИЕ: Установите камеру роста до 22 градусов по Цельсию и обеспечить 16 ч света при интенсивности света 200-220 евро-2 s -1 и 8 ч темноты. - До затопления, выращивать саженцы в течение 10 дней в камере роста, в какой момент саженцы обычно отображаются полностью появились и расширенные cotyledons и возникающих первых истинных листьев (Рисунок 1).

Рисунок 1: Стадия развития типичных 10-дневных саженцев помидоров. Семена томатов Rio Grande-PtoR были стерилизованы, покрыты и стратифицированы в течение не менее 3 дней в темноте при 4 градусах Цельсия. Саженцы выращивались на 0,5x MS пластин в течение 10 дней при 22 градусах Цельсия, прежде чем быть затоплены. Как правило, в 10 дней котиледоны полностью расширяются, и начинают появляться первые истинные листья. Пожалуйста, нажмите здесь, чтобы просмотреть большую версию этой цифры.
4. Подготовка Королевских B23 (KB) СМИ
- Заполните стакан 500 мл ультрачистых H2O и перемешайте на тарелке перемешать.
- Полностью растворите 20 г бакто пептона, 1,5 г ангидры K2HPO4и 12,5 мл глицерола в стакане с ультрачистым H2O.
- Налейте растворенные смеси в 1 L окончил цилиндр и довести до 1 л окончательный том с ультрачистым H2O.
- Налейте бульон обратно в стакан и перемешать, пока не перемешивают.
- Взвесьте 7,5 г бакто агара в две стеклянные бутылки 500 мл и добавьте 500 мл бульона КБ со ступени 4,4 в каждую бутылку. Автоклав на 20 мин.
- Удалите бутылки из автоклава и закружить осторожно, чтобы распределить агар.
- Перенесите бутылки на водяную ванну по 50 градусов по Цельсию на 1 ч.
- После 1 ч, перенесите бутылку в шкаф биобезопасности и в асептических условиях, добавить 1600 л стерильных 1 M MgSO4, и соответствующие антибиотики для средств массовой информации.
ПРИМЕЧАНИЕ: Для рифампицина устойчивых штаммов PstDC3000 и PstT1, используйте рифампицин, растворенный в диметилформамиде при конечной концентрации 50 мкг/мл. Используйте циклогексимид, растворенный в этаноле при конечной концентрации 50 мкг/мл, чтобы предотвратить грибковый рост на пластинах. - Закрутите средства мягко, чтобы перемешать, а затем залить, чтобы покрыть дно пластин.
- Разрешить по крайней мере 1 ч для пластин, чтобы затвердеть перед хранением их вверх дном при 4 градусах Цельсия.
5. Поддержание бактериальных штаммов и культурных условий
- Поддержание глицерола из одной колонии бактерий, как 1 мл насыщенной бактериальной культуры и 333 Л стерильного 80% глицерола при -80 градусов по Цельсию.
- Патч бактерий (т.е. PstT1) из глицерола фонда на КБ агар с соответствующими антибиотиками (раздел 4).
- Разрешить бактерии, чтобы восстановить в течение 2 дней при 28 градусов по Цельсию, прежде чем полос свежие бактерии на селективной Агар КБ с помощью плоской, стерильной зубочисткой.
- Полоса свежих бактерий из глицерола фонда на соответствующие селективный Агар КБ с помощью плоской, стерильной зубочисткой.
ПРИМЕЧАНИЕ: Убедитесь, что патч глицерол запасов не более 2 недель. - Для PstDC3000, инкубировать пластины КБ на 28 градусов по Цельсию в течение 24 ч до использования бактерий в эксперименте наводнения.
- Для PstT1, инкубировать пластины КБ на 28 градусов по Цельсию в течение 48 ч до использования бактерий в эксперименте наводнения.
6. Подготовка PstT1 inoculum
- Асептически resuspend бактерий в стерильных 10 мМ MgCl2 к оптической плотности на 600 нм (OD600) 0,1, или примерно 5 х 107 колонии формирования единиц (CFU)/mL).
- Выполняйте серийные разбавления с использованием стерильного раствора 10 мМ MgCl2 в шкафу для биобезопасности. Для PstT1 используйте спектрофотометр, чтобы сделать инокулум со стартовой концентрацией OD600 и 0,1.
- Для PstT1, сделать 1/10 разбавления от первоначального повторного на OD600 и 0,1 для получения серийного разбавления в концентрации OD600 и 0,01.
- Используя серийное разбавление на OD600 и 0.01 от шага 6.3, сделайте разбавление 3/4 для того чтобы получить окончательноеOD 600 й 0.0075.
- Сделать 1/10 разбавления не-ионического органосиликона сурфактант амеример C13H34O4Si3 (т.е., surfactant) в 10 мМ MgCl2 и вихрь для 15 s. Добавьте 1/10 запас сурфактанта к последнему серийному разбавлению (OD600 и 0.0075) к окончательной концентрации 0.015% и закружите наилучшим образом для того чтобы смешать.
7. Подготовка PstDC3000 инокулум
- Асептически повторнобактерии в стерильных 10 мм MgCl2 к оптической плотности на 600 нм (OD600) 0,1 (примерно 5 х 107 CFU/mL).
- Выполняйте серийные разбавления с использованием стерильного раствора 10 мМ MgCl2 в шкафу для биобезопасности. Для PstDC3000 используйте спектрофотометр, чтобы сделать инокулум со стартовой концентрацией OD600 и 0,1.
- Для PstDC3000, сделать 1/10 разбавления от первоначального повторного на OD600 и 0,1 для получения серийного разбавления в концентрации OD600 и 0,01.
- Используя серийное разбавление на OD600 и 0.01 от шага 3, сделайте разбавление 1/2 для того чтобы получить окончательноеOD 600 й 0.005.
- Сделать 1/10 разбавления сурфактанта в 10 мМ MgCl2 и вихрь для 15 с. Добавьте 1/10 запас сурфактанта к последнему серийному разбавлению (OD600 и 0.005) до конечной концентрации 0,015% и хорошо перемешивайте.
8. Метод затопления саженцев томатов
- Возьмите пластины с 10-дневной саженцы из камеры роста и положить в кабинет биобезопасности, чтобы подготовить пластины для затопления.
- Снимите хирургическую ленту с двух пластин.
- Установите таймер на 3 мин. Измерьте 6 мл окончательного инокулума(PstT1 OD600 - 0,0075 (раздел 6) или PstDC3000 OD600 и 0,005 (раздел 7) и перенесите 6 мл инокулума на каждую тарелку с 10-дневными саженцами.
- Аккуратно нажмите саженцы вниз в инокулум с стерильным кончиком пипетки. Запустите таймер.
- Держите по одной тарелке в каждой руке. Наклоните переднюю часть пластины вниз, чтобы накопить инокулум и в основном погрузить cotyledons и листья саженцев.
- Swish из стороны в сторону 5-7x, а затем наконечник пластины назад, чтобы покрыть корни и всю пластину.
- Наклоните пластины вниз снова, чтобы погрузить cotyledons и листьев, и повторить в общей сложности 3 мин.
- Налейте инокулум с пластин, установите пластины вниз на плоскую поверхность, а затем слить любой остаточный инокул ум во второй раз.
- Переверните пластины хирургической лентой и повторите шаги 8.2-8.8 для любых оставшихся пластин.
- Повторно инкубировать пластины в камере роста (см. шаг 3.11 ПРИМЕЧАНИЕ) после того, как все пластины были затоплены.
- Фенотип после 7-10 дней для PstDC3000 или 10-14 дней для PstT1 (раздел 11). При проведении анализов бактериального роста, собирать ткани листьев через 4 дня (разделы 9 и 10), а затем фенотип (раздел 11). Кроме того, выполнять фенотипический анализ и бактериальный рост анализы на отдельных наборов растений.
9. Поверхностная стерилизация котиледонов для асссея роста бактерий
- Через четыре дня после затопления и повторного инкубации саженцев в камере роста (раздел 8), удалите пластины с томатной саженцы из камеры роста.
- Номер отдельных саженцев на нижней внешней пластины, где саженец прикрепляется к пластине для каждого генотипа.
- Этикетка стерильных 1,5 мл микроцентрифуговых труб с отдельными номерами рассады и использовать чистые щипцы, чтобы падение одного 3 мм стерильной боросиликатового бисера в каждую трубку для использования с бисером колотуции. (См. ПРИМЕЧАНИЕ в шаге 10.1.)
- Пипетка 200 л 10 мМ MgCl2 в каждой трубке и закрыть трубки.
- Приготовьте 70% этанола и вылейте 100 мл в чистый стакан. Налейте 100 мл стерильного ультрачистого H2O в отдельный, чистый стакан.
- Чистая нержавеющей стали прямо тонкой точки щипчинки с зубчатыми кончиками с этанолом. Откройте пластину слегка, чтобы асептический удаление одного котиледона с чистыми щипками.
- Pinch петиола у основания котидона, чтобы удалить лист и падение в стакан с 70% этанола на поверхность стерилизовать в течение 10 с. Промыть колиледон в ультрачистых H2O для 10 с.
- Поместите котиддон на бумажное полотенце и процветы сухим с тонкими научными салфетками.
- Индивидуально взвесьте каждый колиледон после поверхности стерилизации и промотирования, и запишите вес.
- Поместите котиддон в ранее подготовленную микроцентрифугную трубку мощностью 1,5 мл (со ступеней 9,3 и 9,4) с маркировкой соответствующего генотипа и индивидуального номера.
- Запечатайте пластины стерильной лентой и повторно инкубировать саженцы в камере роста (см. шаг 3.11 ПРИМЕЧАНИЕ).
10. Бактериальный рост асссе
- Используя образцы со ступени 9.10, гомогенизируют ткань с помощью бисера в 10 мМ MgCl2 в течение 1-2 мин. Если ткань недостаточно macerated, гомогенизировать снова.
ПРИМЕЧАНИЕ: Многие производители производят бисером колотующих гомогенизаторов. Количество и тип бисера, а также время и скорость гомогенизации (если программируемые) должны быть оптимизированы для каждого типа гомогенизатора. Убедитесь, что образцы не перегреваются во время гомогенизации. - Добавьте 800 кЛ 10 мМ MgCl2 к каждой трубке, содержащей macerated ткани от шага 10.1 и инвертировать несколько раз, чтобы смешать.
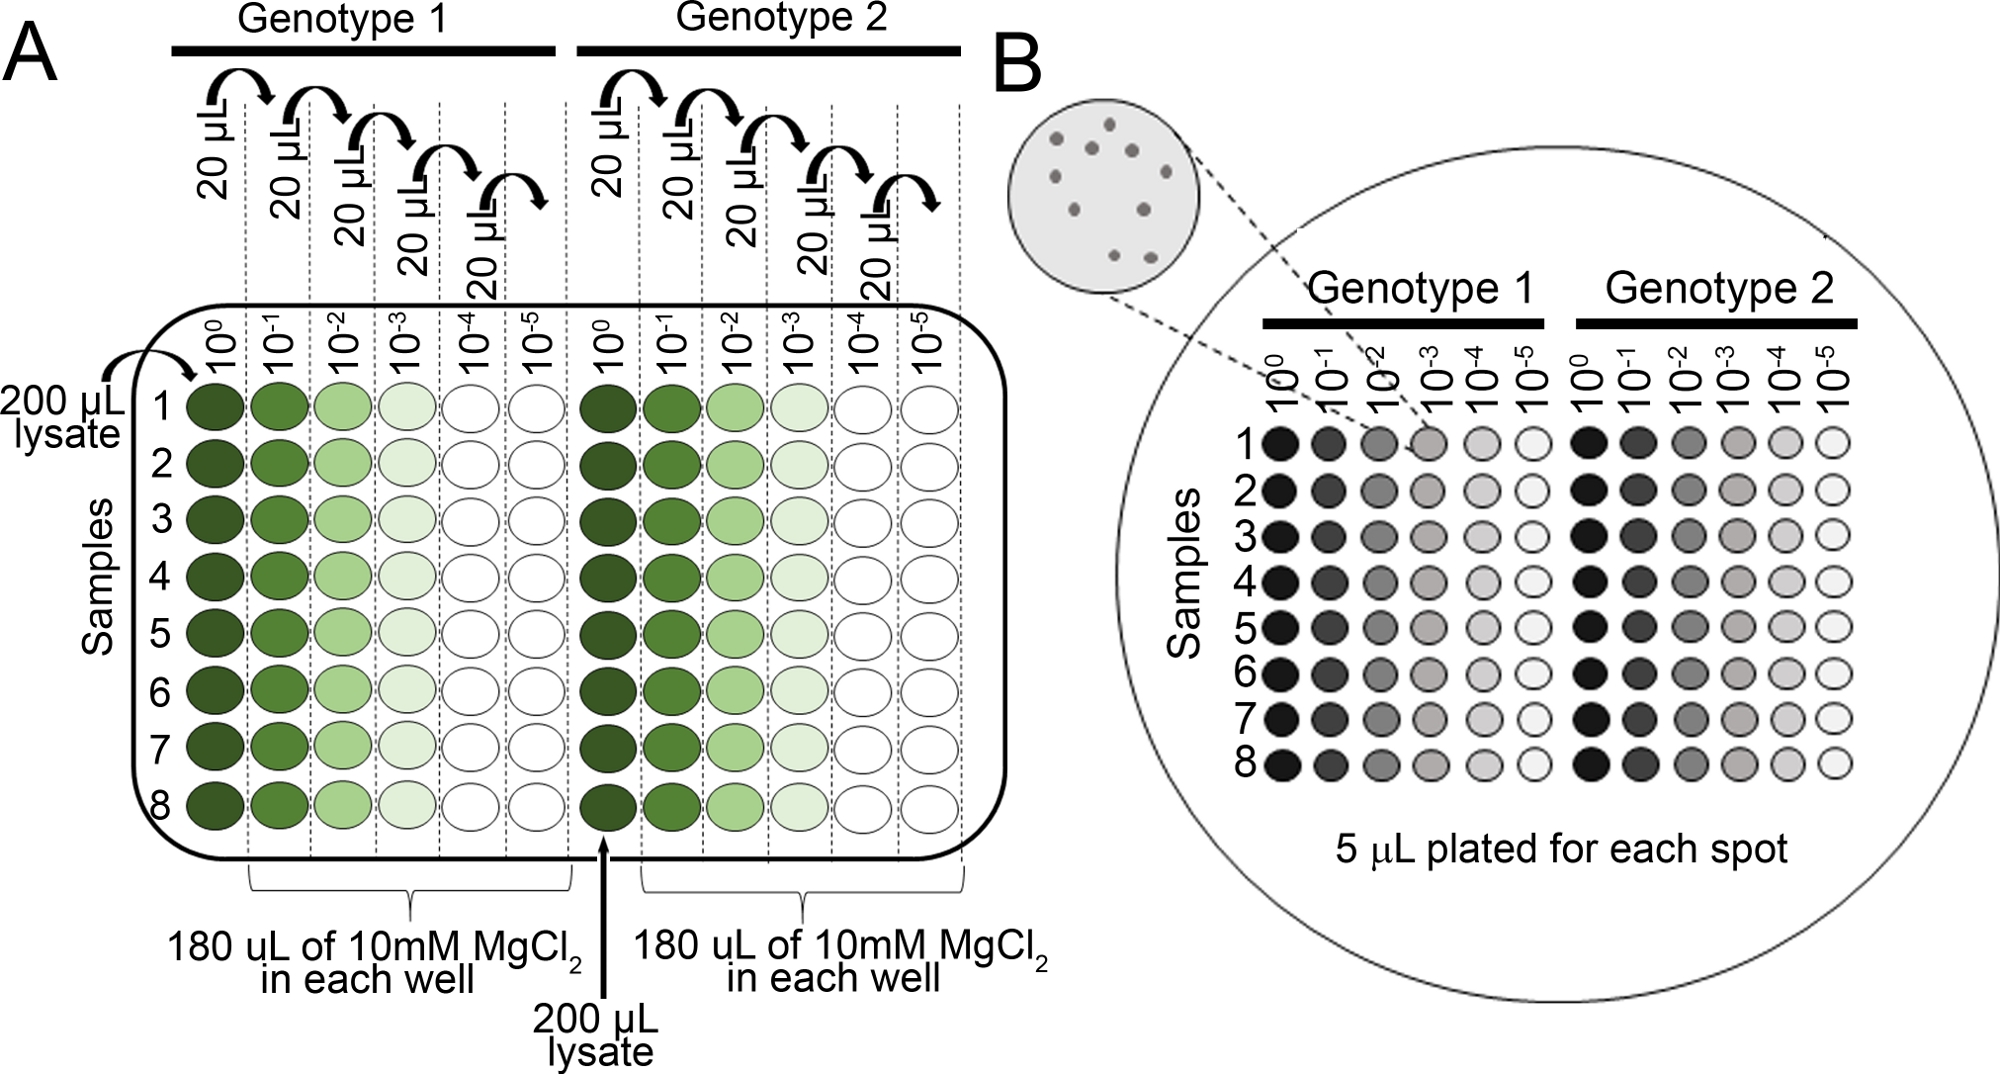
- Подготовка серийных разбавлений для каждого образца в 10 мМ MgCl2 в 96 хорошо пластины (100, 10-1, 10-2, 10-3, 10-4, 10-5) с помощью многоканальной пипетки (Рисунок 2A).
- Пипетка 5 зл от каждой серии разбавления с помощью многоканальной пипетки на агарную пластину КБ (150 мм х 15 мм) с циклогексидом и подходящим выбором для бактериального штамма интереса (см. шаг 4.8 NOTE). Пусть пластины высохнут полностью.
- Инкубировать пластину вверх дном на 28 градусов по Цельсию в течение 36 ч, а затем визуализировать (Рисунок 2B) колоний на пластинах с помощью расчленяющего микроскопа, чтобы определить, если колонии достаточно велики, чтобы рассчитывать.
ПРИМЕЧАНИЕ: Если колонии не достаточно велики, повторно инкубировать пластины и перепроверить размер колоний каждые несколько часов. Как правило, после инкубации колонии подсчитываются в 36–48 ч.

Рисунок 2: Серийные разбавления для рассады бактериального роста анализы. (A) Ткань листьев с macerated от зараженных заводов разбавлена до подсчитывать колонии. Разбавления выполняются в 96 хорошо пластины (100 неразбавлен). Как правило, разбавления производятся от 10-1 до 10-5 . (B) Покрытие разбавления для бактериальных колоний рассчитывает. В общей сложности 5 л каждого столбца серии разбавления покрыто, от большинства разбавленных до наиболее концентрированных. После того, как колонии полностью высохли, пластина инкубируется при 28 градусах по Цельсию при 36-48 ч. Колонии подсчитываются под 10-кратным расчленяющим микроскопом. Пожалуйста, нажмите здесь, чтобы просмотреть большую версию этой цифры.
- Подсчитайте колонии под рассекающим микроскопом, прежде чем они сливаются(Рисунок 2B). Подсчитайте колонии из разбавления серии пластин с менее чем 100 колоний.
- После получения колонии рассчитывает(Рисунок 2B), нормализовать рассчитывает на 0,01 г ткани для рассады и преобразовать в журнал бактериального роста (таблица 1).
ПРИМЕЧАНИЕ: Средняя масса одного Moneymaker-PtoS котиледон составляет 0,01 г и эмпирически определяется22.
| Генотип1 Колонка А | Вес ткани (g) Колонка B | - колоний в месте Колонка C | Коэффициент разбавления для пятна2 Колонка D | Скорректировано - колоний3 Колонка E | Коэффициент разбавления для последовательной разбавления колонки F | Итого - колонна G (cfu/0.01 g)4 | Средняя колонка H в среднем по колониям (cfu/0.01 г) | Средний рост журнала (cfu/0.01 г (журнал10)) Колонка I |
| Пример 1 | 0,004 г | 10 | 200 | рассчитывается как: (C2 x 0.01 г) / B2 25 | 1000 | рассчитывается как: (D2 x E2 x F2) | среднее значение для образца 1 по последнему образцу: (т.е. средний G1:G3) | журнал среднего т.е. журнал (H2) 6,85 |
| Пример 2 | 0,003 г | 15 | 200 | 50 | 1000 | 10000000 | ||
| Пример 3 | 0,002 г | 6 | 200 | 30 | 1000 | 6000000 | ||
| 1 Данные, показанные по 3 примерам | ||||||||
| 2 На основе покрытия 5 л х 200 на 1 мл | ||||||||
| 3 Cotyledons слишком малы к сердечнику поэтому отсчеты колонии были нормализованы до 0.01 g ткани основанной на средней массе одного MoneyMaker-PtoS cotyledon (данные не показаны) | ||||||||
| 4 Скорректирована на мл на основе объема покрынный | ||||||||
Таблица 1: Выборка расчетов для оценки роста роста саженцев. Выборочные расчеты показывают, как нормализовать бактериальные отсчеты и определить рост бактерий.
- Для диких присоединений и других линий со сложным генетическим фоном, коррелирует уровень роста бактерий в отдельных саженцев с их фенотипом, как описано в разделе 11.
11. Фенотипирование для сопротивления
- Удалите пластины из камеры роста и фенотип отдельных саженцев для смерти (из-за болезни) или выживания (из-за сопротивления) после 7-14 дней.
- Фенотип растений, инфицированных высоко вирулентным штаммом, таких как PstDC3000 ранее, в 7-10 дней после наводнения прививки.
- Фенотип растений, инфицированных PstT1 в 10-14 дней после прививки от наводнения.
- Определите систему скоринга на основе диапазона наблюдаемых фенотипов сопротивления. Запись бинарных фенотипов для сортов, изогенных линий и диких присоединений с последовательными, сильными до промежуточных фенотипов сопротивления(рисунок 4А, 4B).
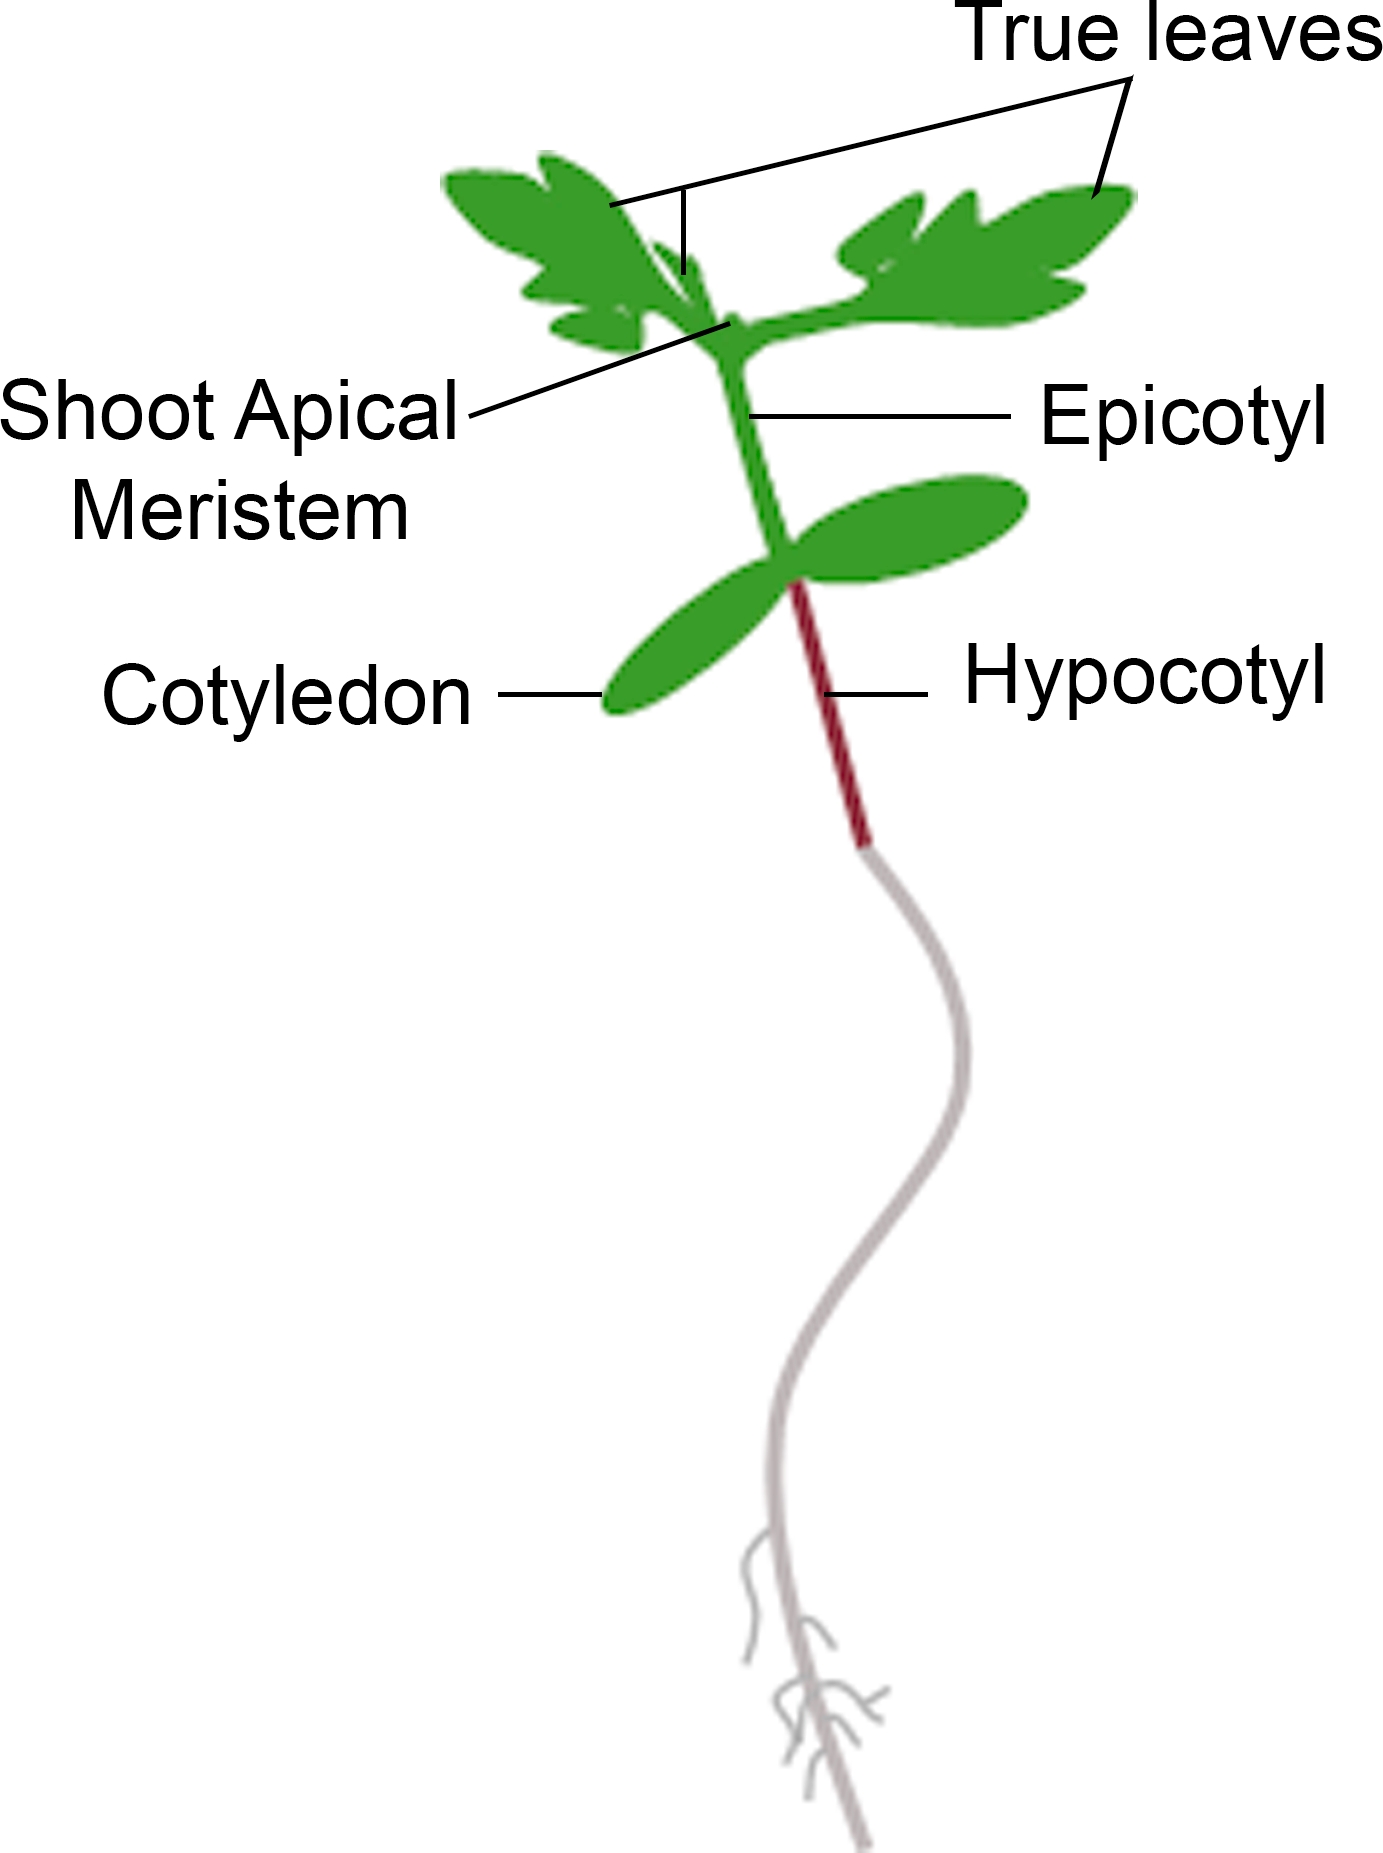
- Если рассада отображает новый рост от апикальной меристем в сроки для фенотипирования, считать его как выживание. Если саженец имеет коричневый апекальное меристем и не отображает новый, зеленый вегетативный рост, считать его смертью(рисунок 3).

Рисунок 3: Схематическое представление саженца помидоров. Различные части саженцы помидоров изображены, в том числе гипокотила, котедоны, эпепотил, стрелять апикальный меристем, и истинные листья. Пожалуйста, нажмите здесь, чтобы просмотреть большую версию этой цифры.
- Запись фенотипов на спектре заболеваний для популяций, таких как F2 картирования популяций, с широким диапазоном фенотипов сопротивления(Рисунок 4C).
- Тщательно следите за саженцами на наличие симптомов заболевания и смерти, чтобы определить подходящее окно для фенотипирования.

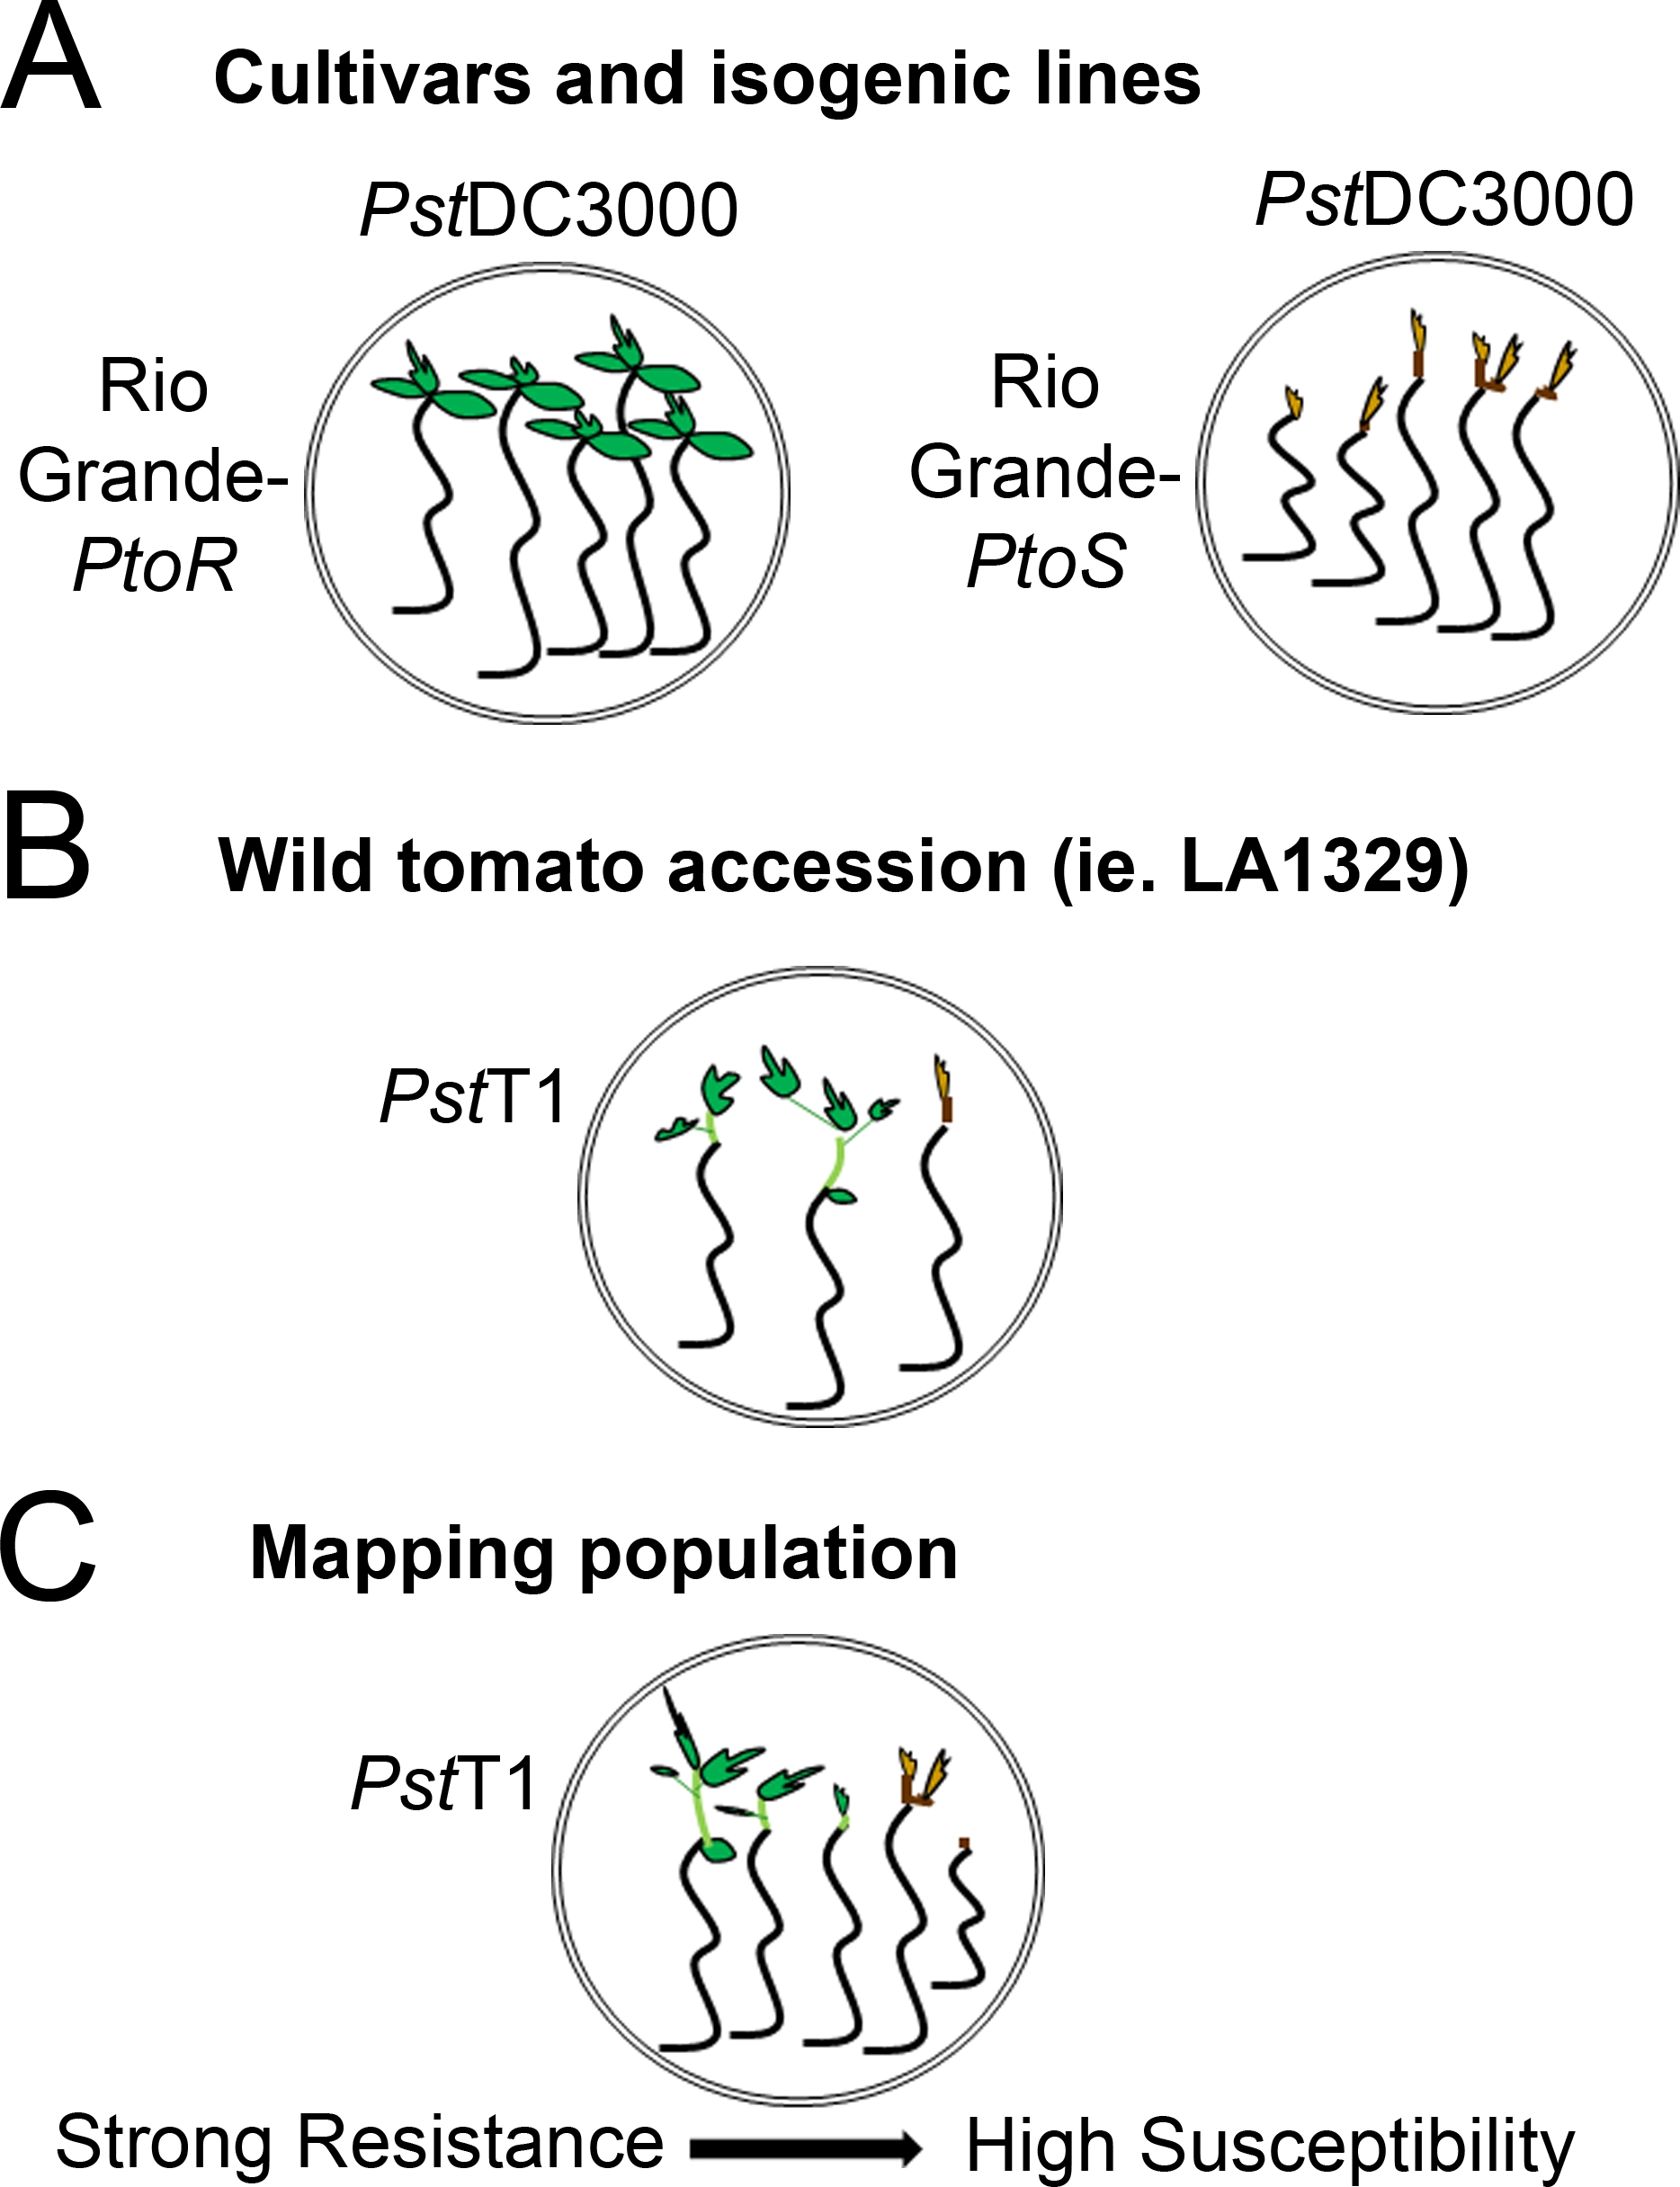
Рисунок 4: Схематическое представление ожидаемых фенотипов для сопротивления рассады и смерти в различных генетических фонах. (A) Семена Рио-Гранде-PtoR и почти изогенный сорт Рио-Гранде-PtoS отображаются через 7 дней после наводнения с PstDC3000 (OD 600 и 0,005) 0,015% surfactant. Rio Grande-PtoR проявляет последовательную устойчивость, а Rio Grande-PtoS отображает последовательную восприимчивость к инфекции PstDC3000. Эти линии приводят к дискретным и бинарным фенотипам. (B) Рассада дикого присоединения, такие как Solanum neorickii LA1329, показаны через 10 дней после затопления pstT1 (OD600 и 0.0075) 0,015% surfactant. Рассада отображает фенотипическую изменчивость, но были записаны как бинарные фенотипы. Количество фенотипической изменчивости и метод фенотипирования (бинарное сопротивление или спектр сопротивления) будет зависеть от конкретного присоединения испытания. (C) Картирование популяций, порожденных перекрестием диких присоединений к восприимчивым сортам, может отображать более широкий спектр фенотипов в группе F2, сегрегирующих популяции. В этом случае наиболее целесообразным может быть запись фенотипов рассады на спектре. Очень восприимчивы саженцы из картографирования населения может быть фенотипом для смерти уже в 7-й день, когда затоплены с PstT1, и, как правило, показывают коричневый апикальный меристем, нет очень мало расширения эпепотил, и не новый, зеленый вегетативного роста. Апикальный меристем восприимчивых саженцев может оставаться зеленым или очень светло-коричневый больше времени, и может быть некоторое расширение эпепотил и очень мало вегетативного роста, который становится коричневым и арестов на 10 день. Индивидуальные саженцы могут быть фенотипизированы для сопротивления на основе количества новых и текущих вегетативного роста на 14-й день. Рассада может быть сгруппирована на основе фенотипов, описанных выше, в различные категории сопротивления, такие как слабое, среднее или сильное сопротивление. Пожалуйста, нажмите здесь, чтобы просмотреть большую версию этой цифры.
Результаты
Обнаружение PtoR-опосредованного иммунитета в сортах и изогенных линиях с использованием рассады
Рисунок 5 показывает репрезентативные результаты для Moneymaker-PtoR и Moneymaker-PtoS сортов 7-10 дней после наводнения с PstDC3000. До заражения 10-дневные саженц...
Обсуждение
Описан протокол прививки от наводнений pstDC3000 или PstT1, оптимизированный для обнаружения устойчивости к этим бактериальным штаммам в саженцах помидоров. Есть несколько критических параметров для оптимальных результатов в растестировани на саженец, включая концентрацию бакте?...
Раскрытие информации
Авторам нечего раскрывать.
Благодарности
Мы благодарим Джейми Кальму за тестирование влияния объема средств массовой информации на результаты болезней или резистентности. Мы благодарим д-ра Маэля Бодена и д-ра Карла Ш.Шайбера из лаборатории Льюиса за предоставление конструктивных замечаний и предложений по рукописи. Исследования иммунитета растений в лаборатории Льюиса были поддержаны USDA ARS 2030-21000-046-00D и 2030-21000-050-00D (JDL) и Управлением по биологическим наукам NSF IOS-1557661 (JDL).
Материалы
| Name | Company | Catalog Number | Comments |
| 3M Tape Micropore 1/2" x 10 YD CS 240 (1.25 cm x 9.1 m) | VWR International | 56222-182 | |
| 3mm borosilicate glass beads | Friedrich & Dimmock | GB3000B | |
| Bacto peptone | BD | 211677 | |
| Bacto agar | BD | 214010 | |
| Biophotometer Plus | Eppendorf | E952000006 | |
| Biosafety cabinet, class II type A2 | |||
| BRAND Disposable Plastic Cuvettes, Polystyrene | VWR International | 47744-642 | |
| Chenille Kraft Flat Wood Toothpicks | VWR International | 500029-808 | |
| cycloheximide | Research Products International | C81040-5.0 | |
| Dibasic potassium phosphate anhydrous, ACS grade | Fisher Scientific | P288-500 | |
| Dimethylformamide | |||
| Dissecting microscope (Magnification of at least 10x) | |||
| Ethanol - 190 Proof | |||
| Falcon polystyrene 96 well microplates, flat-bottom | Fisher Scientific | 08-772-3 | |
| Glass Alcohol Burner Wick | Fisher Scientific | S41898A / No. W-125 | |
| Glass Alcohol Burners | Fisher Scientific | S41898 / No. BO125 | |
| Glycerol ACS reagent | VWR International | EMGX0185-5 | |
| Kimberly-Clark™ Kimtech Science™ Kimwipes™ Delicate Task Wipers | Fisher Scientific | 06-666-A | |
| Magnesium chloride, ACS grade | VWR International | 97061-356 | |
| Magnesium sulfate heptahydrate, ACS grade | VWR International | 97062-130 | |
| Microcentrifuge tubes, 1.5 mL | |||
| Microcentrifuge tubes, 2.2 mL | |||
| Mini Beadbeater-96, 115 volt | Bio Spec Products Inc. | 1001 | |
| Murashige & Skoog, Basal Salts | Caisson Laboratories, Inc. | MSP01-50LT | |
| Pipet-Lite XLS LTS 8-CH Pipet 20-200uL | Rainin | L8-200XLS | |
| Pipet-Lite XLS LTS 8-CH Pipet 2-20uL | Rainin | L8-20XLS | |
| Polystyrene 100mm x 25mm sterile petri dish | VWR International | 89107-632 | |
| Polystyrene 150mm x 15mm sterile petri dish | Fisher Scientific | FB08-757-14 | |
| Polystyrene 150x15mm sterile petri dish | Fisher Scientific | 08-757-148 | |
| Pure Bright Germicidal Ultra Bleach 5.7% Available Chlorine (defined as 100% bleach) | Staples | 1013131 | |
| Rifampicin | Gold Biotechnology | R-120-25 | |
| Silwet L-77 (non-ionic organosilicone surfactant co-polymer C13H34O4Si3 surfactant) | Fisher Scientific | NCO138454 | |
| Tips LTS 20 μL 960/10 GPS-L10 | Rainin | 17005091 | |
| Tips LTS 250 μL 960/10 GPS-L250 | Rainin | 17005093 | |
| VWR dissecting forceps fine tip, 4.5" | VWR International | 82027-386 |
Ссылки
- Underwood, W., Melotto, M., He, S. Y. Role of plant stomata in bacterial invasion. Cell Microbiology. 9 (7), 1621-1629 (2007).
- Zipfel, C. Early molecular events in PAMP-triggered immunity. Current Opinion in Plant Biology. 12 (4), 414-420 (2009).
- Galan, J. E., Wolf-Watz, H. Protein delivery into eukaryotic cells by type III secretion machines. Nature. 444 (7119), 567-573 (2006).
- Lewis, J. D., Desveaux, D., Guttman, D. S. The targeting of plant cellular systems by injected type III effector proteins. Seminars in Cell and Developmental Biology. 20 (9), 1055-1063 (2009).
- Schreiber, K. J., Baudin, M., Hassan, J. A., Lewis, J. D. Die another day: molecular mechanisms of effector-triggered immunity elicited by type III secreted effector proteins. Seminars in Cell and Developmental Biology. 56, 124-133 (2016).
- Heath, M. C. Hypersensitive response-related death. Plant Molecular Biology. 44 (3), 321-334 (2000).
- Boyd, L. A., Ridout, C., O'Sullivan, D. M., Leach, J. E., Leung, H. Plant-pathogen interactions: disease resistance in modern agriculture. Trends in Genetics. 29 (4), 233-240 (2013).
- Pitblado, R. E., MacNeill, B. H. Genetic basis of resistance to Pseudomonas syringae pv. tomato in field tomatoes. Canadian Journal of Plant Pathology. 5 (4), 251-255 (1983).
- Pedley, K. F., Martin, G. B. Molecular basis of Pto-mediated resistance to bacterial speck disease in tomato. Annual Reviews of Phytopathology. 41, 215-243 (2003).
- Ronald, P. C., Salmeron, J. M., Carland, F. M., Mehta, A. Y., Staskawicz, B. J. The cloned avirulence gene AvrPto induces disease resistance in tomato cultivars containing the Pto resistance gene. Journal of Bacteriology. 174 (5), 1604-1611 (1992).
- Martin, G. B., et al. Map-based cloning of a protein kinase gene conferring disease resistance in tomato. Science. 262 (5138), 1432-1436 (1993).
- Salmeron, J. M., Barker, S. J., Carland, F. M., Mehta, A. Y., Staskawicz, B. J. Tomato mutants altered in bacterial disease resistance provide evidence for a new locus controlling pathogen recognition. Plant Cell. 6 (4), 511-520 (1994).
- Salmeron, J. M., et al. Tomato Prf is a member of the leucine-rich repeat class of plant disease resistance genes and lies embedded within the Pto kinase gene cluster. Cell. 86 (1), 123-133 (1996).
- Scofield, S. R., et al. Molecular basis of gene-for-gene specificity in bacterial speck disease of tomato. Science. 274 (5295), 2063-2065 (1996).
- Kunkeaw, S., Tan, S., Coaker, G. Molecular and evolutionary analyses of Pseudomonas syringae pv. tomato race 1. Molecular Plant-Microbe Interactions. 23 (4), 415-424 (2010).
- Cai, R., et al. The plant pathogen Pseudomonas syringae pv. tomato is genetically monomorphic and under strong selection to evade tomato immunity. PLoS Pathogens. 7 (8), 1002130 (2011).
- Almeida, N. F., et al. A draft genome sequence of Pseudomonas syringae pv. tomato T1 reveals a type III effector repertoire significantly divergent from that of Pseudomonas syringae pv. tomato DC3000. Molecular Plant-Microbe Interactions. 22 (1), 52-62 (2009).
- Lin, N. C., Abramovitch, R. B., Kim, Y. J., Martin, G. B. Diverse AvrPtoB homologs from several Pseudomonas syringae pathovars elicit Pto-dependent resistance and have similar virulence activities. Applied and Environmental Microbiology. 72 (1), 702-712 (2006).
- Rose, L. E., Langley, C. H., Bernal, A. J., Michelmore, R. W. Natural variation in the Pto pathogen resistance gene within species of wild tomato (Lycopersicon). I. Functional analysis of Pto alleles. Genetics. 171 (1), 345-357 (2005).
- Thapa, S. P., Miyao, E. M., Davis, R. M., Coaker, G. Identification of QTLs controlling resistance to Pseudomonas syringae pv. tomato race 1 strains from the wild tomato Solanum habrochaites LA1777. Theoretical and Applied Genetics. 128 (4), 681-692 (2015).
- Bao, Z. L., et al. Identification of a candidate gene in Solanum habrochaites for resistance to a race 1 strain of Pseudomonas syringae pv. tomato. Plant Genome. 8 (3), 1-15 (2015).
- Hassan, J. A., Zhou, Y. J., Lewis, J. D. A rapid seedling resistance assay identifies wild tomato lines that are resistant to Pseudomonas syringae pv. tomato race 1. Molecular Plant-Microbe Interactions. 30 (9), 701-709 (2017).
- King, E. O., Ward, M. K., Raney, D. E. Two simple media for the demonstration of pyocyanin and fluorescin. Journal of Laboratory and Clinical Medicine. 44 (2), 301-307 (1954).
- Uppalapati, S. R., et al. Pathogenicity of Pseudomonas syringae pv. tomato on tomato seedlings: phenotypic and gene expression analyses of the virulence function of coronatine. Molecular Plant-Microbe Interactions. 21 (4), 383-395 (2008).
- Bhardwaj, V., Meier, S., Petersen, L. N., Ingle, R. A., Roden, L. C. Defence responses of Arabidopsis thaliana to infection by Pseudomonas syringae are regulated by the circadian clock. PLoS One. 6 (10), 26968 (2011).
- Lu, H., McClung, C. R., Zhang, C. Tick tock: circadian regulation of plant innate immunity. Annual Review of Phytopathology. 55, 287-311 (2017).
- Wang, W., et al. Timing of plant immune responses by a central circadian regulator. Nature. 470 (7332), 110-114 (2011).
Erratum
Formal Correction: Erratum: High-Throughput Identification of Resistance to Pseudomonas syringae pv. Tomato in Tomato using Seedling Flood Assay
Posted by JoVE Editors on 10/18/2023. Citeable Link.
An erratum was issued for: High-Throughput Identification of Resistance to Pseudomonas syringae pv. Tomato in Tomato using Seedling Flood Assay. The Introduction, Protocol, Representative Results and Discussion sections were updated.
The last paragraph of the Introduction section was updated from:
In the seedling flood assay described in this protocol, tomato seedlings are grown on Petri dishes of sterile Murashige and Skoog (MS) media for 10 days and then are flooded with an inoculum containing the bacteria of interest and a surfactant. Following flooding, seedlings can be quantitatively evaluated for disease resistance via bacterial growth assays. Additionally, seedling survival or death can act as a discrete resistance or disease phenotype 7–14 days after flooding. This approach offers a high-throughput alternative for screening large numbers of wild tomato accessions for resistance to Pst race 1 strains, such as Pst strain T1 (PstT1), and can easily be adapted to other bacterial strains of interest.
to:
In the seedling flood assay described in this protocol, tomato seedlings are grown on Petri dishes of sterile Murashige and Skoog (MS) media for 10 days and then are flooded with an inoculum containing the bacteria of interest and a surfactant. Following flooding, seedlings can be quantitatively evaluated for disease resistance via bacterial growth assays. Additionally, seedling survival or death can act as a discrete resistance or disease phenotype 7–14 days after flooding. This approach offers a high-throughput alternative for screening large numbers of wild tomato accessions for resistance to Pst race 1 strains, such as Pst strain 19 (Pst19), and can easily be adapted to other bacterial strains of interest.
Step 4.8 of the Protocol section was updated from:
- After 1 h, transfer the bottle to the biosafety cabinet and under aseptic conditions, add 1,600 µL of sterile 1 M MgSO4, and appropriate antibiotics to the media.
NOTE: For rifampicin resistant strains PstDC3000 and PstT1, use rifampicin dissolved in dimethylformamide at a final concentration of 50 µg/mL. Use cycloheximide dissolved in ethanol at a final concentration of 50 µg/mL to prevent fungal growth on the plates.
to:
- After 1 h, transfer the bottle to the biosafety cabinet and under aseptic conditions, add 1,600 µL of sterile 1 M MgSO4, and appropriate antibiotics to the media.
NOTE: For rifampicin resistant strains PstDC3000 and Pst19, use rifampicin dissolved in dimethylformamide at a final concentration of 50 µg/mL. Use cycloheximide dissolved in ethanol at a final concentration of 50 µg/mL to prevent fungal growth on the plates.
Step 5.2 of the Protocol section was updated from:
- Patch bacteria (i.e., PstT1) from a glycerol stock onto KB agar with appropriate antibiotics (section 4).
to:
- Patch bacteria (i.e., Pst19) from a glycerol stock onto KB agar with appropriate antibiotics (section 4).
Step 5.6 of the Protocol section was updated from:
- For PstT1, incubate the KB plate at 28 ˚C for 48 h prior to using bacteria in the flood experiment.
to:
- For Pst19, incubate the KB plate at 28 ˚C for 48 h prior to using bacteria in the flood experiment.
Step 6 of the Protocol section was updated from:
6. Preparation of PstT1 inoculum
to
6. Preparation of Pst19 inoculum
Step 6.2 of the Protocol section was updated from:
- Perform serial dilutions using sterile 10 mM MgCl2 solution in the biosafety cabinet. For PstT1, use a spectrophotometer to make inoculum with a starting concentration of OD600 = 0.1.
to:
- Perform serial dilutions using sterile 10 mM MgCl2 solution in the biosafety cabinet. For Pst19, use a spectrophotometer to make inoculum with a starting concentration of OD600 = 0.1.
Step 6.3 of the Protocol section was updated from:
- For PstT1, make a 1/10 dilution from the initial resuspension at OD600 = 0.1 to obtain a serial dilution at a concentration of OD600 = 0.01.
to:
- For Pst19, make a 1/10 dilution from the initial resuspension at OD600 = 0.1 to obtain a serial dilution at a concentration of OD600 = 0.01.
Step 8.3 of the Protocol section was updated from:
- Set a timer for 3 min. Measure 6 mL of final inoculum (PstT1 OD600 = 0.0075 [section 6] or PstDC3000 OD600 = 0.005 [section 7]) and transfer 6 mL of inoculum to each plate with the 10-day-old seedlings.
to:
- Set a timer for 3 min. Measure 6 mL of final inoculum (Pst19 OD600 = 0.0075 [section 6] or PstDC3000 OD600 = 0.005 [section 7]) and transfer 6 mL of inoculum to each plate with the 10-day-old seedlings.
Step 8.11 of the Protocol section was updated from:
- Phenotype after 7–10 days for PstDC3000 or 10–14 days for PstT1 (section 11). If carrying out bacterial growth assays, collect leaf tissue after 4 days (sections 9 and 10) and then phenotype (section 11). Alternatively, perform phenotypic analysis and bacterial growth assays on separate sets of plants.
to:
- Phenotype after 7–10 days for PstDC3000 or 10–14 days for Pst19 (section 11). If carrying out bacterial growth assays, collect leaf tissue after 4 days (sections 9 and 10) and then phenotype (section 11). Alternatively, perform phenotypic analysis and bacterial growth assays on separate sets of plants.
Step 10.7 of the Protocol section was updated from:
- After obtaining colony counts (Figure 2B), normalize the counts to 0.01 g of tissue for seedlings and convert to log bacterial growth (Table 1).
NOTE: The average mass of one Moneymaker-PtoS cotyledon is 0.01 g and is empirically determined22.
| Genotype1 Column A | Tissue Weight (g) Column B | # of Colonies in a spot Column C | Dilution factor for spot2 Column D | Adjusted # of Colonies3 Column E | Dilution factor for serial dilution Column F | Total # of Colonies Column G (cfu/0.01 g)4 | Average # of Colonies (cfu/0.01 g) Column H | Average Log Growth (cfu/0.01 g (log10)) Column I |
| Sample 1 | 0.004 g | 10 | 200 | calculated as: (C2 x 0.01 g) / B2 = 25 | 1000 | calculated as: (D2 x E2 x F2) = 5000000 | average for sample 1 through last sample: (ie. average G1:G3) = 7000000 | log of average ie. log(H2) = 6.85 |
| Sample 2 | 0.003 g | 15 | 200 | 50 | 1000 | 10000000 | ||
| Sample 3 | 0.002 g | 6 | 200 | 30 | 1000 | 6000000 | ||
| 1Data shown for 3 samples | ||||||||
| 2Based on plating 5 µL x 200 for 1 mL | ||||||||
| 3Cotyledons are too small to core so colony counts were normalized to 0.01 g of tissue based on the average mass of one MoneyMaker-PtoS cotyledon (data not shown) | ||||||||
| 4Adjusted per mL based on volume plated | ||||||||
Table 1: Sample calculations for seedling bacterial growth assay. Sample calculations demonstrate how to normalize bacterial counts and determine log bacterial growth.
to:
- After obtaining colony counts (Figure 2B), normalize the counts to 0.1 g of tissue for seedlings and convert to log bacterial growth (Table 1).
NOTE: The average mass of one Moneymaker-PtoS cotyledon is 0.1 g and is empirically determined22.
| Genotype1 Column A | Tissue Weight (g) Column B | # of Colonies in a spot Column C | Dilution factor for spot2 Column D | Adjusted # of Colonies3 Column E | Dilution factor for serial dilution Column F | Total # of Colonies Column G (cfu/0.01 g)4 | Average # of Colonies (cfu/0.01 g) Column H | Average Log Growth (cfu/0.1 g (log10)) Column I |
| Sample 1 | 0.04 g | 10 | 200 | calculated as: (C2 x 0.1 g) / B2 = 25 | 1000 | calculated as: (D2 x E2 x F2) = 5000000 | average for sample 1 through last sample: (ie. average G1:G3) = 7000000 | log of average ie. log(H2) = 6.85 |
| Sample 2 | 0.03 g | 15 | 200 | 50 | 1000 | 10000000 | ||
| Sample 3 | 0.02 g | 6 | 200 | 30 | 1000 | 6000000 | ||
| 1Data shown for 3 samples | ||||||||
| 2Based on plating 5 µL x 200 for 1 mL | ||||||||
| 3Cotyledons are too small to core so colony counts were normalized to 0.1 g of tissue based on the average mass of one MoneyMaker-PtoS cotyledon (data not shown) | ||||||||
| 4Adjusted per mL based on volume plated | ||||||||
Table 1: Sample calculations for seedling bacterial growth assay. Sample calculations demonstrate how to normalize bacterial counts and determine log bacterial growth.
Step 11.3 of the Protocol section was updated from:
- Phenotype plants infected with PstT1 at 10–14 days after flood inoculation.
to:
- Phenotype plants infected with Pst19 at 10–14 days after flood inoculation.
Figure 4 in the Protocol section was updated from:
Figure 4: Schematic representation of expected phenotypes for seedling resistance and death in various genetic backgrounds. (A) Seedlings of Rio Grande-PtoR and the near-isogenic cultivar Rio Grande-PtoS are displayed 7 days after flooding with PstDC3000 (OD600 = 0.005) + 0.015% surfactant. Rio Grande-PtoR displays consistent resistance, and Rio Grande-PtoS displays consistent susceptibility to infection with PstDC3000. These lines give rise to discrete and binary phenotypes. (B) Seedlings of a wild accession, such as Solanum neorickii LA1329, are shown 10 days after flooding with PstT1 (OD600 = 0.0075) + 0.015% surfactant. Seedlings display phenotypic variability but were recorded as binary phenotypes. The amount of phenotypic variability and the method of phenotyping (binary resistance or resistance spectrum) will depend on the particular accession tested. (C) Mapping populations generated by outcrossing wild accessions to susceptible cultivars may display a wider spectrum of phenotypes in F2 segregating populations. In this case, it may be most appropriate to record seedling phenotypes on a spectrum. Highly susceptible seedlings from a mapping population may be phenotyped for death as early as day 7 when flooded with PstT1, and typically show a brown apical meristem, no to very little extension of the epicotyl, and no new, green vegetative growth. The apical meristem of susceptible seedlings may stay green or very light brown for more time, and there may be some extension of the epicotyl and very little vegetative growth, which turns brown and arrests by day 10. Individual seedlings can be phenotyped for resistance based on the amount of new and ongoing vegetative growth by day 14. Seedlings can then be grouped based on the phenotypes described above into different categories of resistance such as weak, medium, or strong resistance. Please click here to view a larger version of this figure.
to:
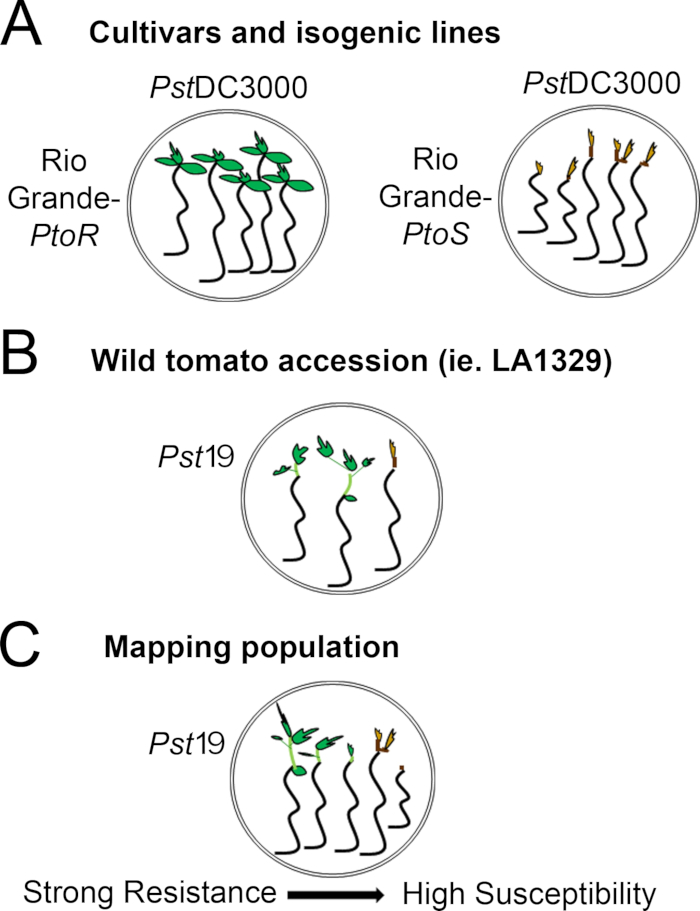
Figure 4: Schematic representation of expected phenotypes for seedling resistance and death in various genetic backgrounds. (A) Seedlings of Rio Grande-PtoR and the near-isogenic cultivar Rio Grande-PtoS are displayed 7 days after flooding with PstDC3000 (OD600 = 0.005) + 0.015% surfactant. Rio Grande-PtoR displays consistent resistance, and Rio Grande-PtoS displays consistent susceptibility to infection with PstDC3000. These lines give rise to discrete and binary phenotypes. (B) Seedlings of a wild accession, such as Solanum neorickii LA1329, are shown 10 days after flooding with Pst19 (OD600 = 0.0075) + 0.015% surfactant. Seedlings display phenotypic variability but were recorded as binary phenotypes. The amount of phenotypic variability and the method of phenotyping (binary resistance or resistance spectrum) will depend on the particular accession tested. (C) Mapping populations generated by outcrossing wild accessions to susceptible cultivars may display a wider spectrum of phenotypes in F2 segregating populations. In this case, it may be most appropriate to record seedling phenotypes on a spectrum. Highly susceptible seedlings from a mapping population may be phenotyped for death as early as day 7 when flooded with Pst19, and typically show a brown apical meristem, no to very little extension of the epicotyl, and no new, green vegetative growth. The apical meristem of susceptible seedlings may stay green or very light brown for more time, and there may be some extension of the epicotyl and very little vegetative growth, which turns brown and arrests by day 10. Individual seedlings can be phenotyped for resistance based on the amount of new and ongoing vegetative growth by day 14. Seedlings can then be grouped based on the phenotypes described above into different categories of resistance such as weak, medium, or strong resistance. Please click here to view a larger version of this figure.
The second paragraph of the Representative Results section was updated from:
Phenotypic screening of wild accessions using the seedling resistance assay
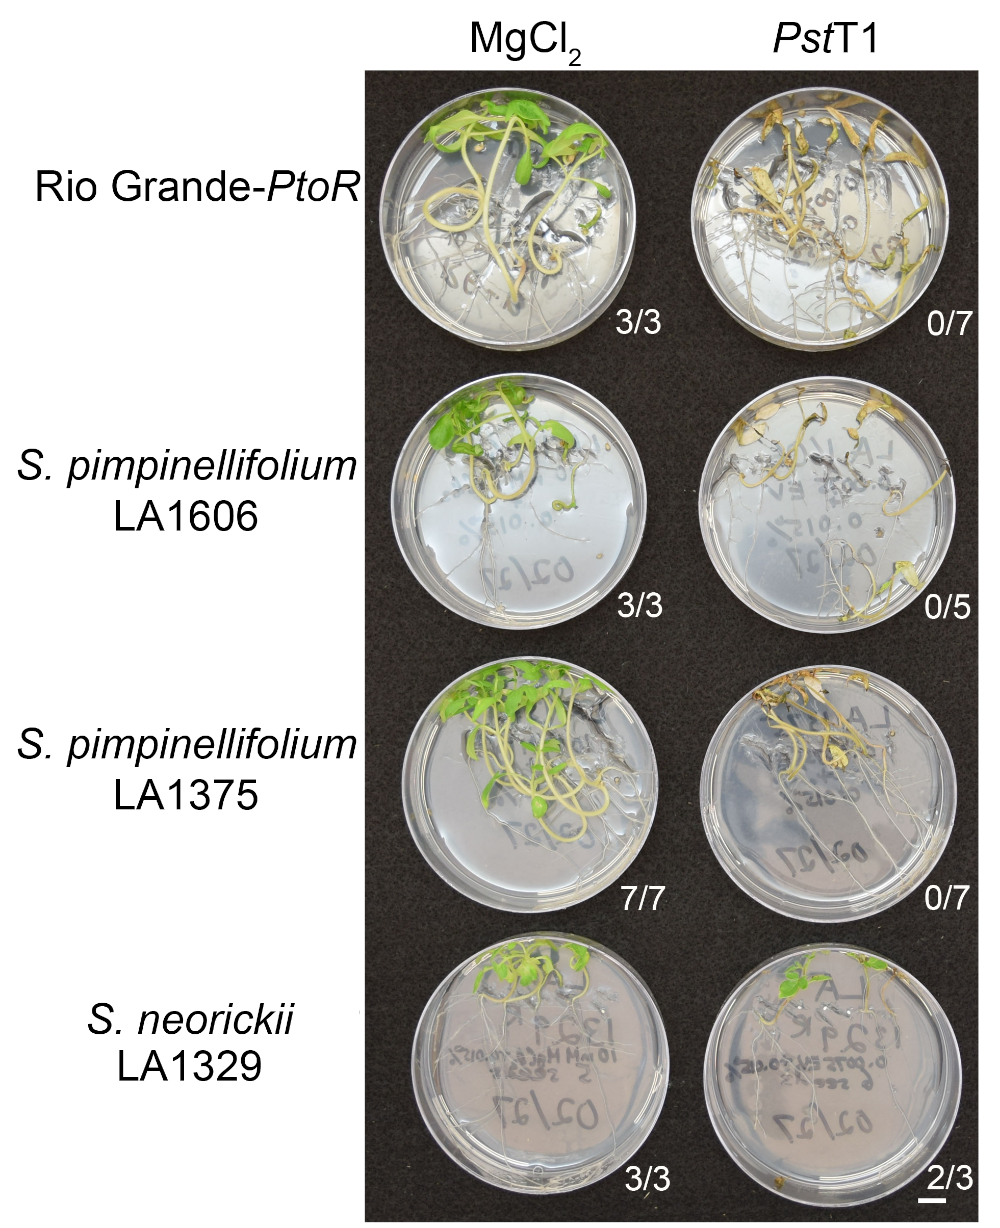
Figure 6 shows representative results for seedlings of susceptible and resistant accessions 10–14 days after flooding with PstT1. Susceptible accessions include RG-PtoR, S. pimpinellifolium LA1375, and S. pimpinellifolium LA1606, and resistant accessions include S. neorickii LA1329. Ten-day-old seedlings were flooded with 10 mM MgCl2 + 0.015% surfactant as a negative control, and PstT1 at an optical density of 0.0075 + 0.015% surfactant. The seedlings were phenotyped at least 10 days after flooding, as PstT1-infected seedlings died more slowly than PstDC3000-infected seedlings. Mock-inoculated seedlings were green, healthy, and actively growing. This control is important to ensure that the accessions are not sensitive to the concentration of surfactant, and to ensure there is no bacterial contamination. Susceptible accessions (Rio Grande-PtoR [n = 7], S. pimpinellifolium LA1375 [n = 7], and S. pimpinellifolium LA1606 [n = 5]) were dead, had brown apical meristems, and lacked new growth 10–14 days after inoculation with PstT1. In contrast, two S. neorickii LA1329 (n = 3) seedlings displayed a high level of new, green growth and survived infection with PstT1 (Figure 6). Three LA1329 seedlings did not germinate. Typically, 5–7 individuals were screened for each accession in a primary screen to determine the prevalence of resistance in the population. When a more genetically complex wild accession, such as LA1329, is flooded with PstT1, the resistance phenotypes display slightly more variability among individual seedlings, compared to Moneymaker-PtoR treated with PstDC3000. However, the resistance phenotypes were usually less variable than those seen in F2 mapping populations. Thus, binary phenotyping criteria was used for LA1329.
to:
Phenotypic screening of wild accessions using the seedling resistance assay
Figure 6 shows representative results for seedlings of susceptible and resistant accessions 10–14 days after flooding with Pst19. Susceptible accessions include RG-PtoR, S. pimpinellifolium LA1375, and S. pimpinellifolium LA1606, and resistant accessions include S. neorickii LA1329. Ten-day-old seedlings were flooded with 10 mM MgCl2 + 0.015% surfactant as a negative control, and Pst19 at an optical density of 0.0075 + 0.015% surfactant. The seedlings were phenotyped at least 10 days after flooding, as Pst19-infected seedlings died more slowly than PstDC3000-infected seedlings. Mock-inoculated seedlings were green, healthy, and actively growing. This control is important to ensure that the accessions are not sensitive to the concentration of surfactant, and to ensure there is no bacterial contamination. Susceptible accessions (Rio Grande-PtoR [n = 7], S. pimpinellifolium LA1375 [n = 7], and S. pimpinellifolium LA1606 [n = 5]) were dead, had brown apical meristems, and lacked new growth 10–14 days after inoculation with Pst19. In contrast, two S. neorickii LA1329 (n = 3) seedlings displayed a high level of new, green growth and survived infection with Pst19 (Figure 6). Three LA1329 seedlings did not germinate. Typically, 5–7 individuals were screened for each accession in a primary screen to determine the prevalence of resistance in the population. When a more genetically complex wild accession, such as LA1329, is flooded with Pst19, the resistance phenotypes display slightly more variability among individual seedlings, compared to Moneymaker-PtoR treated with PstDC3000. However, the resistance phenotypes were usually less variable than those seen in F2 mapping populations. Thus, binary phenotyping criteria was used for LA1329.
Figure 6 in the Representative Results section was updated from:
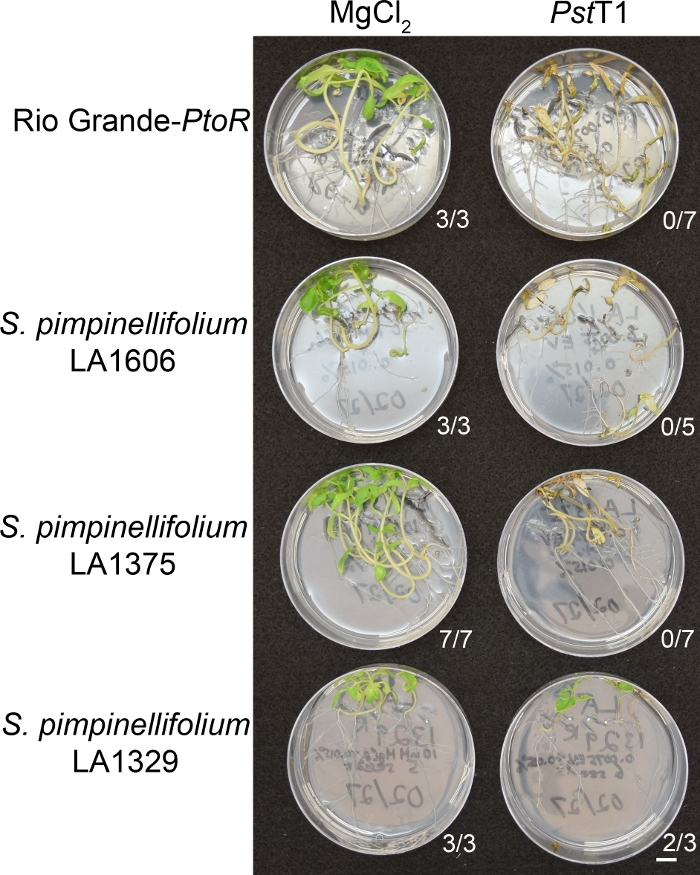
Figure 6: Phenotypic characterization of resistance or disease symptoms 10–14 days post-infection in wild accessions. Rio Grande-PtoR, S. pimpinellifolium LA1606, S. pimpinellifolium LA1375 and S. neorickii LA1329 tomato seedlings were grown on 0.5x MS plates for 10 days, and then flooded with PstT1 (OD600 = 0.0075) + 0.015% surfactant. The number of surviving seedlings for each wild accession out of the total number tested is shown. Scale bar = 1 cm. Please click here to view a larger version of this figure.
to:
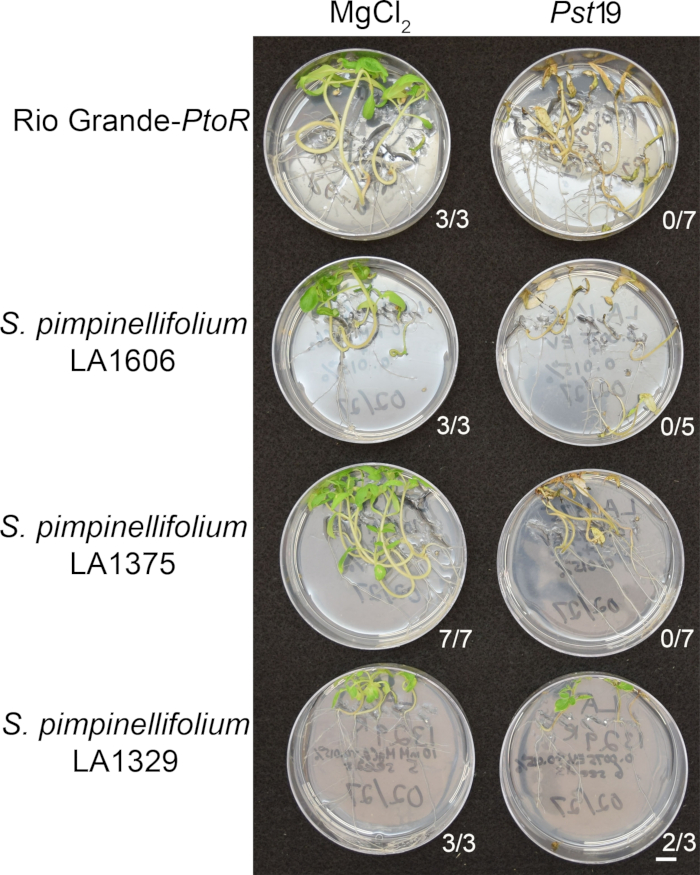
Figure 6: Phenotypic characterization of resistance or disease symptoms 10–14 days post-infection in wild accessions. Rio Grande-PtoR, S. pimpinellifolium LA1606, S. pimpinellifolium LA1375 and S. neorickii LA1329 tomato seedlings were grown on 0.5x MS plates for 10 days, and then flooded with Pst19 (OD600 = 0.0075) + 0.015% surfactant. The number of surviving seedlings for each wild accession out of the total number tested is shown. Scale bar = 1 cm. Please click here to view a larger version of this figure.
The third paragraph of the Representative Results section was updated from:
Quantitative assessment of bacterial growth using the seedling flood assay
To confirm that the observed resistance in LA1329 to PstT1 resulted in lower bacterial growth, bacterial growth assays were carried out in tomato seedlings. The level of PstT1 growth in Moneymaker-PtoS and S. neorickii LA1329 was determined 4 days post-infection. Moneymaker-PtoS is a near-isogenic line with consistent susceptibility among individual seedlings. Wild accessions such as S. neorickii LA1329 are often more genetically complex. LA1329 displays approximately 60% resistance to PstT1 across the population22. Because seedlings may drop their cotyledons after infection, one seedling was grown on each plate to correlate bacterial growth in the harvested cotyledon with overall seedling survival or death as determined phenotypically at least 10 days after flooding. The bacterial counts on day 4 for each seedling were normalized to 0.01 g of tissue and converted to log growth (CFU/0.01 g(log10)). Log growth for phenotypically resistant LA1329 seedlings (LA1329RES) or phenotypically susceptible seedlings (LA1329SUS) were separately pooled and compared to each other and the susceptible cultivar Moneymaker-PtoS. For example, there was a 1.7 log difference in bacterial growth between LA1329RES (log 6.3) and LA1329SUS (log 8.0), and a 1.6 log difference between LA1329RES (log 6.3) and Moneymaker-PtoS (log 7.9) (Figure 7). Therefore, phenotypic resistance correlated with quantitative resistance in the seedling assays.
to:
Quantitative assessment of bacterial growth using the seedling flood assay
To confirm that the observed resistance in LA1329 to Pst19 resulted in lower bacterial growth, bacterial growth assays were carried out in tomato seedlings. The level of Pst19 growth in Moneymaker-PtoS and S. neorickii LA1329 was determined 4 days post-infection. Moneymaker-PtoS is a near-isogenic line with consistent susceptibility among individual seedlings. Wild accessions such as S. neorickii LA1329 are often more genetically complex. LA1329 displays approximately 60% resistance to Pst19 across the population22. Because seedlings may drop their cotyledons after infection, one seedling was grown on each plate to correlate bacterial growth in the harvested cotyledon with overall seedling survival or death as determined phenotypically at least 10 days after flooding. The bacterial counts on day 4 for each seedling were normalized to 0.01 g of tissue and converted to log growth (CFU/0.01 g(log10)). Log growth for phenotypically resistant LA1329 seedlings (LA1329RES) or phenotypically susceptible seedlings (LA1329SUS) were separately pooled and compared to each other and the susceptible cultivar Moneymaker-PtoS. For example, there was a 1.7 log difference in bacterial growth between LA1329RES (log 6.3) and LA1329SUS (log 8.0), and a 1.6 log difference between LA1329RES (log 6.3) and Moneymaker-PtoS (log 7.9) (Figure 7). Therefore, phenotypic resistance correlated with quantitative resistance in the seedling assays.
Figure 7 in the Representative Results section was updated from:
x
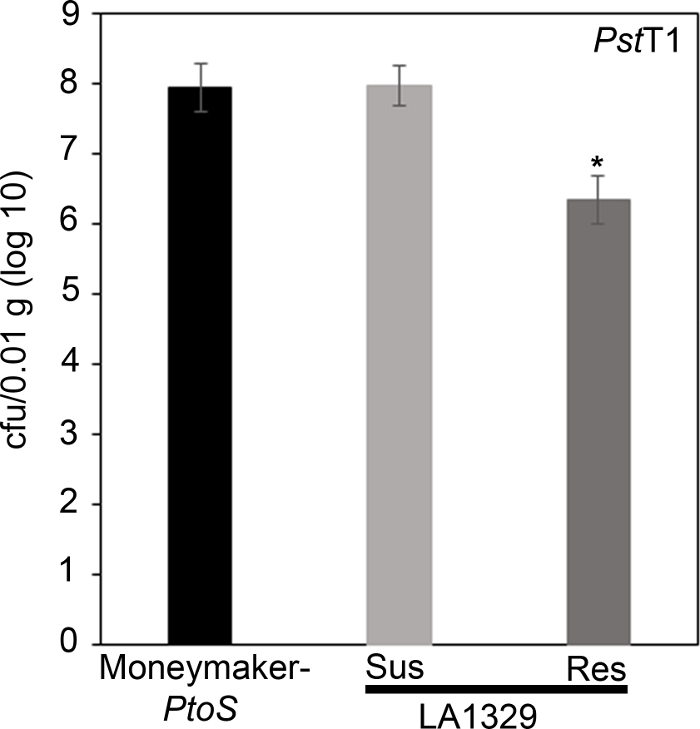
Figure 7: Resistant Solanum neorickii LA1329 seedlings support lower bacterial growth than Moneymaker-PtoS or susceptible S. neorickii LA1329. Bacterial counts were determined 4 days post-inoculation from S. neorickii LA1329 (n = 14) and Moneymaker-PtoS (n = 10) seedlings infected with PstT1 and normalization was performed to 0.01 g of tissue. For LA1329, the two phenotypic groups, susceptible (SUS) or resistant (RES), were observed and counted separately. Above the bar * = statistically significant difference determined by a one-factor analysis of variance. A general linear model procedure (p < 0.001) followed by a multiple comparison of means using Tukey's post hoc test was used. Error bars = standard error. The figure indicates one representative experiment. Please click here to view a larger version of this figure.
x
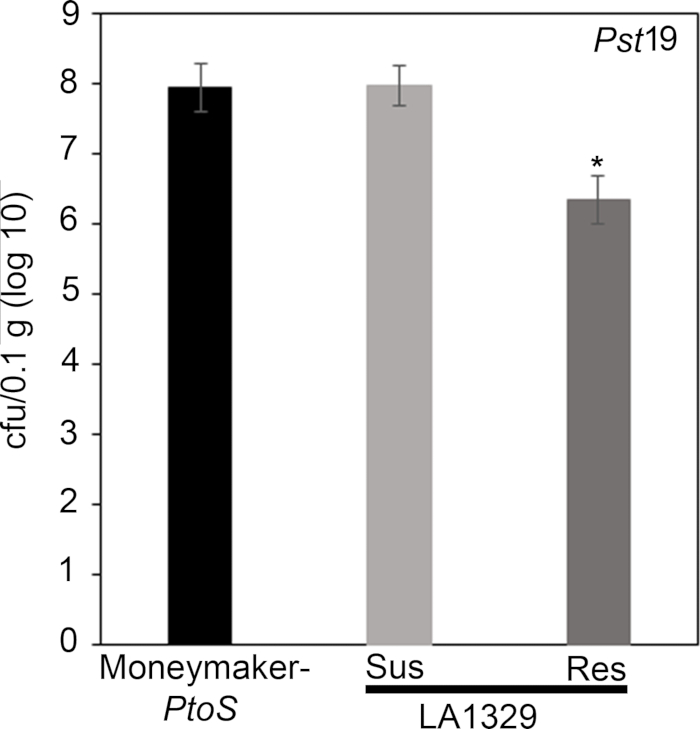
Figure 7: Resistant Solanum neorickii LA1329 seedlings support lower bacterial growth than Moneymaker-PtoS or susceptible S. neorickii LA1329. Bacterial counts were determined 4 days post-inoculation from S. neorickii LA1329 (n = 14) and Moneymaker-PtoS (n = 10) seedlings infected with Pst19 and normalization was performed to 0.1 g of tissue. For LA1329, the two phenotypic groups, susceptible (SUS) or resistant (RES), were observed and counted separately. Above the bar * = statistically significant difference determined by a one-factor analysis of variance. A general linear model procedure (p < 0.001) followed by a multiple comparison of means using Tukey's post hoc test was used. Error bars = standard error. The figure indicates one representative experiment. Please click here to view a larger version of this figure.
The first paragraph of the Discussion section was updated from:
A protocol for flood inoculation with PstDC3000 or PstT1 optimized to detect resistance to these bacterial strains in tomato seedlings is described. There are several critical parameters for optimal results in the seedling resistance assay, including bacterial concentration and surfactant concentration, which were empirically determined22. For PstDC3000, the optical density was optimized to achieve complete survival on a resistant cultivar containing the Pto/Prf cluster and complete death on a susceptible cultivar lacking the Pto/Prf cluster22. For a strain such as PstT1, where there are no known resistant varieties, the optical density was optimized to be the lowest possible for consistent and complete plant death22. Uppalapati et al.24 designed a tomato seedling assay to investigate the pathogenesis of PstDC3000 and the virulence function of coronatine. In this virulence assay, infections were performed using bacteria concentrated to an OD600 of 0.124, 20x higher than the optical density of strains used in our resistance assay. Recognition of PstDC3000 effectors AvrPto and AvrPtoB in tomato seedlings carrying the Pto/Prf gene cluster results in ETI and a macroscopic HR22. In the context of a strong immune response such as ETI, a lower bacterial titer was used for PstDC3000 to avoid overwhelming genetic resistance from the Pto/Prf gene cluster22. In addition, these results suggest that a high bacterial concentration could overwhelm weaker immune responses such as PTI or quantitative partial resistance, where multiple genes contribute to the overall phenotype. Surfactant is necessary for the bacteria to adhere to the leaf surface; however, high concentrations can cause chlorosis of the leaf22. We previously tested a range of surfactant concentrations to empirically determine the ideal concentration in 10-day-old tomato seedlings22. When testing new species that may differ in their sensitivity to surfactant, the surfactant concentration should be optimized to identify a concentration that does not cause damage or chlorosis in the absence of bacteria. Appropriate assay conditions will require optimization of a surfactant concentration that does not cause damage, and a bacterial concentration that causes disease in all susceptible controls.
to:
A protocol for flood inoculation with PstDC3000 or Pst19 optimized to detect resistance to these bacterial strains in tomato seedlings is described. There are several critical parameters for optimal results in the seedling resistance assay, including bacterial concentration and surfactant concentration, which were empirically determined22. For PstDC3000, the optical density was optimized to achieve complete survival on a resistant cultivar containing the Pto/Prf cluster and complete death on a susceptible cultivar lacking the Pto/Prf cluster22. For a strain such as Pst19, where there are no known resistant varieties, the optical density was optimized to be the lowest possible for consistent and complete plant death22. Uppalapati et al.24 designed a tomato seedling assay to investigate the pathogenesis of PstDC3000 and the virulence function of coronatine. In this virulence assay, infections were performed using bacteria concentrated to an OD600 of 0.124, 20x higher than the optical density of strains used in our resistance assay. Recognition of PstDC3000 effectors AvrPto and AvrPtoB in tomato seedlings carrying the Pto/Prf gene cluster results in ETI and a macroscopic HR22. In the context of a strong immune response such as ETI, a lower bacterial titer was used for PstDC3000 to avoid overwhelming genetic resistance from the Pto/Prf gene cluster22. In addition, these results suggest that a high bacterial concentration could overwhelm weaker immune responses such as PTI or quantitative partial resistance, where multiple genes contribute to the overall phenotype. Surfactant is necessary for the bacteria to adhere to the leaf surface; however, high concentrations can cause chlorosis of the leaf22. We previously tested a range of surfactant concentrations to empirically determine the ideal concentration in 10-day-old tomato seedlings22. When testing new species that may differ in their sensitivity to surfactant, the surfactant concentration should be optimized to identify a concentration that does not cause damage or chlorosis in the absence of bacteria. Appropriate assay conditions will require optimization of a surfactant concentration that does not cause damage, and a bacterial concentration that causes disease in all susceptible controls.
The third paragraph of the Discussion section was updated from:
Pst is a foliar pathogen that preferentially colonizes the aerial parts of tomato seedlings, including the cotyledons24 (Figure 3). Therefore, qualitative phenotyping in the seedling flood assay focuses on growth and disease symptoms in aerial portions of the seedling, and tissue for the bacterial growth assay is sampled from the cotyledons for quantitative analysis. After flood inoculation, seedlings may die within 7–10 days after inoculation with PstDC3000 or 10–14 days after inoculation with PstT1, as discussed in section 11. Seedling death is visualized by a brown apical meristem, arrested epicotyl elongation, and/or arrested vegetative growth. If different bacterial strains are used, the timing will have to be empirically determined. In addition, the progression of disease on control plants should be monitored daily after flooding until a consistent time frame from the onset of disease symptoms to seedling death can be identified. Depending on the genotypes and treatments used in the flood assay, seedling phenotypes can be recorded as binary phenotypes or on a disease spectrum (Figure 4). A broader spectrum of phenotypes may be observed when flood inoculating F2 mapping populations from wild tomato accessions crossed to susceptible cultivars (Figure 4C). It may be best to phenotype segregating populations on a disease spectrum depending on how quickly the seedling dies and the degree of new vegetative growth and branching (Figure 4C). The seedling flood assay can also be used in conjunction with the seedling bacterial growth assay to quantitatively assess levels of bacterial growth associated with qualitative phenotypes in individual seedlings (Figure 7). Very large reductions (i.e., ~log 3) in bacterial growth or strong resistance in resistant seedlings of a wild accession compared to a susceptible cultivar suggest that the underlying genetic basis of resistance may be due to ETI22. Smaller reductions in bacterial growth (i.e., ~log 1.7), as observed in LA1329 seedlings, may be due to the contribution of weaker resistance from quantitative trait loci and/or PTI. Thus, the seedling growth assay can be an important tool in further characterizing resistance in wild tomato lines.
to:
Pst is a foliar pathogen that preferentially colonizes the aerial parts of tomato seedlings, including the cotyledons24 (Figure 3). Therefore, qualitative phenotyping in the seedling flood assay focuses on growth and disease symptoms in aerial portions of the seedling, and tissue for the bacterial growth assay is sampled from the cotyledons for quantitative analysis. After flood inoculation, seedlings may die within 7–10 days after inoculation with PstDC3000 or 10–14 days after inoculation with Pst19, as discussed in section 11. Seedling death is visualized by a brown apical meristem, arrested epicotyl elongation, and/or arrested vegetative growth. If different bacterial strains are used, the timing will have to be empirically determined. In addition, the progression of disease on control plants should be monitored daily after flooding until a consistent time frame from the onset of disease symptoms to seedling death can be identified. Depending on the genotypes and treatments used in the flood assay, seedling phenotypes can be recorded as binary phenotypes or on a disease spectrum (Figure 4). A broader spectrum of phenotypes may be observed when flood inoculating F2 mapping populations from wild tomato accessions crossed to susceptible cultivars (Figure 4C). It may be best to phenotype segregating populations on a disease spectrum depending on how quickly the seedling dies and the degree of new vegetative growth and branching (Figure 4C). The seedling flood assay can also be used in conjunction with the seedling bacterial growth assay to quantitatively assess levels of bacterial growth associated with qualitative phenotypes in individual seedlings (Figure 7). Very large reductions (i.e., ~log 3) in bacterial growth or strong resistance in resistant seedlings of a wild accession compared to a susceptible cultivar suggest that the underlying genetic basis of resistance may be due to ETI22. Smaller reductions in bacterial growth (i.e., ~log 1.7), as observed in LA1329 seedlings, may be due to the contribution of weaker resistance from quantitative trait loci and/or PTI. Thus, the seedling growth assay can be an important tool in further characterizing resistance in wild tomato lines.
The fourth paragraph of the Discussion section was updated from:
Typically, genetic screens have been performed on four- to five-week-old adult tomato plants to identify the genetic basis of P. syringae resistance in wild accessions20,21. Adult tomato plants require much longer growth times, require more space in the growth chamber, and are much larger plants, which means that usually few individuals are screened for each line. The seedling flood assay provides a powerful, alternative approach in the identification of P. syringae resistance in wild tomato accessions. Screening at the seedling stage permits a large sample size to be tested which can be particularly advantageous in detecting resistance in genetically complex populations. Reduced growth chamber space requirements and growth time facilitate a high-throughput approach and rapid detection of natural resistance in wild accessions to emerging pathogens. Furthermore, P. syringae resistance that was identified at the seedling stage in this assay is not restricted to the developmental stage. S. neorickii LA1329 and S. habrochaites LA1253 were initially identified at the seedling stage and also display resistance to PstT1 in adult plants as previously described22.
to:
Typically, genetic screens have been performed on four- to five-week-old adult tomato plants to identify the genetic basis of P. syringae resistance in wild accessions20,21. Adult tomato plants require much longer growth times, require more space in the growth chamber, and are much larger plants, which means that usually few individuals are screened for each line. The seedling flood assay provides a powerful, alternative approach in the identification of P. syringae resistance in wild tomato accessions. Screening at the seedling stage permits a large sample size to be tested which can be particularly advantageous in detecting resistance in genetically complex populations. Reduced growth chamber space requirements and growth time facilitate a high-throughput approach and rapid detection of natural resistance in wild accessions to emerging pathogens. Furthermore, P. syringae resistance that was identified at the seedling stage in this assay is not restricted to the developmental stage. S. neorickii LA1329 and S. habrochaites LA1253 were initially identified at the seedling stage and also display resistance to Pst19 in adult plants as previously described22.
Перепечатки и разрешения
Запросить разрешение на использование текста или рисунков этого JoVE статьи
Запросить разрешениеСмотреть дополнительные статьи
This article has been published
Video Coming Soon
Авторские права © 2025 MyJoVE Corporation. Все права защищены