
כור פאזה נוזלית: היפוך סוכרוז
Overview
מקור: קרי מ. דולי ומייקל בנטון, המחלקה להנדסה כימית, אוניברסיטת לואיזיאנה סטייט, באטון רוז', לוס אנג'לס
הן אצווה והן כורים זרימה רציפה משמשים בתגובות קטליטיות. מיטות ארוזות, המשתמשות בזרזים מוצקים ובזרימה רציפה, הן התצורה הנפוצה ביותר. בהיעדר זרם מיחזור נרחב, כורי מיטה ארוזים כאלה מעוצבים בדרך כלל כ"זרימת תקע ". הכור הרציף הנפוץ ביותר השני הוא טנק מעורבב, אשר מניח להיות מעורב לחלוטין. 1 אחת הסיבות לשכיחותם של כורי מיטה ארוזים היא שבניגוד לרוב תכני הטנקים המעורבים, שטח קיר גדול לנפח הכור מקדם העברת חום מהירה יותר. עבור כמעט כל הכורים, יש להוסיף חום או לסגת כדי לשלוט בטמפרטורה עבור התגובה הרצויה להתרחש.
הקינטיקה של תגובות קטליטיות הן לעתים קרובות מורכבות יותר מאשר סדררחוב 1 פשוט, סדר2, וכו 'קינטיקה שנמצאת בספרי לימוד. שיעורי התגובה יכולים להיות מושפעים גם משיעורי העברת ההמונים - התגובה אינה יכולה להתרחש מהר יותר מהקצב שבו המגיבים מסופקים אל פני השטח או מהקצב שבו מסירים מוצרים - והעברת חום. מסיבות אלה, ניסויים הוא כמעט תמיד הכרחי כדי לקבוע את קינטיקה התגובה לפני תכנון ציוד בקנה מידה גדול. בניסוי זה, אנו בוחנים כיצד לבצע ניסויים כאלה וכיצד לפרש אותם על ידי מציאת ביטוי שיעור תגובה וקבוע קצב לכאורה.
ניסוי זה בוחן את השימוש בכור מיטה ארוז כדי לקבוע את הקינטיקה של היפוך סוכרוז. תגובה זו אופיינית לאלה המאופיינים בזרז מוצק עם מגיבים ומוצרים בשלב נוזלי.
סוכרוז → גלוקוז (דקסטרוז) + פרוקטוז(1)
כור מיטה ארוז יופעל בקצבי זרימה שונים כדי לשלוט בזמן החלל, הקשור לזמן המגורים והוא מקביל לזמן שחלף בכור אצווה. הזרז, חומצה מוצקה, יהיה מוכן תחילה על ידי החלפת פרוטונים עבור כל cations אחרים הנוכחי. לאחר מכן, הכור יהיה מחומם לטמפרטורה הרצויה (פעולה איזותרמית) עם זרימת המגיבים. כאשר הטמפרטורה השתוותה, דגימת המוצר תתחיל. הדגימות ינותחו על ידי polarimeter, אשר מודד סיבוב אופטי. הסיבוב האופטי של התערובת יכול להיות קשור להמרה של סוכרוז, אשר לאחר מכן ניתן להשתמש בו ניתוחי קינטיקה סטנדרטיים כדי לקבוע את סדר התגובה, ביחס סוכרוז מגיב, ואת קבוע הקצב לכאורה. ההשפעות של מכניקת נוזלים - אין ערבוב צירי (זרימת תקע) לעומת כמה ערבוב צירי (טנקים מעורבבים בסדרה) - על הקינטיקה ינותחו גם כן.
Procedure
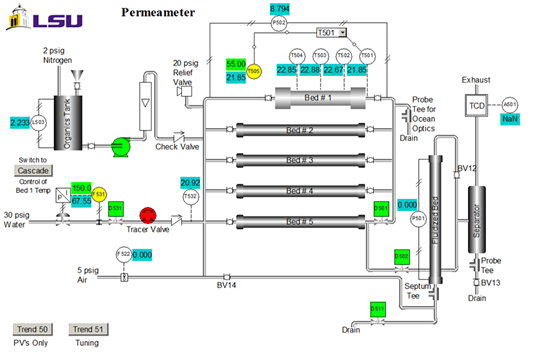
מאפייני זרז הם: גודל = 20 - 40 רשת שינוי; משקל = 223 גרם; תכולת מים = 30 wt. %; צפיפות לכאורה (בתפזורת) = 1.01 גרם/מ"ל; ריכוז אתר חומצה = 4.6 mmol חומצה אתרים / g משקל יבש; שטח פנים = 50 מ'2/g; macroporosity (נפח מקרופור/נפח כולל של חתול.) = 0.34; גודל מקרופור ממוצע = 80 ננומטר. דיאגרמת P&ID של היחידה מוצגת באיור 2. לניסוי זה, רק #1 המיטה, מיכל האורגני, המשאבה והרוטמטר משמשים. דגימות נאספות בניקוז העליון. T505 הוא בקר הטמפרטורה.
Results

Application and Summary
התגובה אינה מתנהגת בדיוק כצפוי מכיוון שההזמנה הנראית לעין n היא > 1. מכל התופעות שיכולות לגרום לחריגות כאלה בכורים אמיתיים, סטיות מהתנהגות PFR אידיאלית הנגרמת על ידי ערבוב צירי מוצעות על ידי העובדה כי התאמה לדגם טנקים בסדרה נותן רק מספר קטן של טנקים - עבור PFR מושלם, N צריך להיות לפחות 6. סטיות כא?...
References
- J. Sauer, N. Dahmen and E. Henrich. "Chemical Reactor Types." Ullman's Encycylopedia of Industrial Chemistry (2015). Web. 15 Oct. 2016.
- H.S. Fogler, "Elements of Chemical Reaction Engineering," 4th Ed., Prentice-Hall, Upper Saddle River, NJ, 2006, Ch. 2-4; O. Levenspiel, "Chemical Reaction Engineering," 3rd Ed., John Wiley, New York, 1999, Ch. 4-6; C.G. Hill, Jr. and T.W. Root, "Introduction to Chemical Engineering Kinetics and Reactor Design," 2nd Ed., John Wiley, New York, 2014, Ch. 8.
- N. Lifshutz and J. S. Dranoff, Ind. Eng. Chem. Proc. Des. Dev., 7, 266-269 (1968).
- E.R. Gilliland, H. J. Bixler, and J. E. O'Connell, Ind. Eng. Chem. Fundam., 10, 185-191 (1971).
- "Sulfuric Acid." The Essential Chemical Industry. Univ. of York, 2016. http://www.essentialchemicalindustry.org/chemicals/sulfuric-acid.html. Accessed 10/20/16.
- E. Lotero, Y. Liu, D.E. Lopez, K. Suwannakarn, D.A. Bruce and J.G. Goodwin, Jr., Ind. Eng. Chem. Res.,44, 5353-5363 (2005); A. Buasri, N. Chaiyut, V. Loryuenyong, C. Rodklum, T. Chaikwan, and N. Kumphan, Appl. Sci.2, 641-653 (2012); doi:10.3390/app2030641.
Tags
Skip to...
Videos from this collection:

Now Playing
כור פאזה נוזלית: היפוך סוכרוז
Chemical Engineering
9.7K Views

בדיקת יעילות העברת החום של מחליף חום פין-צינור
Chemical Engineering
17.9K Views

שימוש במייבש מגשים לחקר העברת חום קונבקטיבית ומוליכת
Chemical Engineering
44.0K Views

צמיגות של פרופילן גליקול פתרונות
Chemical Engineering
32.9K Views

פורוסימיטריה של אבקת סיליקה אלומינה
Chemical Engineering
9.6K Views

הדגמת מודל חוק הכוח באמצעות שחול
Chemical Engineering
10.2K Views

בולם גז
Chemical Engineering
36.8K Views

שיווי משקל נוזלי אדים
Chemical Engineering
89.3K Views

ההשפעה של יחס ריפלוקס על יעילות זיקוק מגש
Chemical Engineering
77.8K Views

יעילות של מיצוי נוזלי נוזלי
Chemical Engineering
48.5K Views

התגבשות חומצה סליצילית באמצעות שינוי כימי
Chemical Engineering
24.3K Views

זרימה חד-פאזית ותלת-פאזית בכור מיטה ארוז
Chemical Engineering
19.0K Views

קינטיקה של תוספת פילמור לפולידימתילסילוקסן
Chemical Engineering
16.1K Views

כור קטליטי: הידרוגנציה של אתילן
Chemical Engineering
30.4K Views

הערכת העברת החום של ספין וצינה
Chemical Engineering
7.4K Views
Copyright © 2025 MyJoVE Corporation. All rights reserved