
מיון תאים המופעל מגנטי (MACS): בידוד של לימפוציטים T תימיים
Overview
מקור: מונירסילבן 1,2,3, פרצ'טתיבו 1,2,3, סופינובולט 4, רחל גולוב1,2,3
יחידה אחת ללימפופוליס, המחלקה לאימונולוגיה, מכון פסטר, פריז, צרפת
2 INSERM U1223, פריז, צרפת
3 100é Paris Diderot, סורבון פריז סיטה, צ'רול פסטר, פריז, צרפת
4 פלטפרום ציטומטריה זרימה, ציטומטריה וסמנים ביולוגיים UtechS, המרכז למדע תרגום, מכון פסטר, פריז, צרפת
הגנה מפני פתוגנים תלויה במעקב של מערכת החיסון. מערכת זו מורכבת וכוללת סוגי תאים רבים, כל אחד עם פונקציות ספציפיות. הרכב מורכב זה מאפשר תגובות חיסוניות למגוון גדול של פתוגנים ופציעות. חסינות אדפטיבית מאפשרת תגובות ספציפיות נגד פתוגנים ספציפיים. רוב התאים האחראים לסוג זה של חסינות הם הלימפוציטים (תאי B ותאי T). בדרך כלל, תאי B מגיבים לזיהומים חוץ תאיים (כגון זיהומים חיידקיים), ותאי T מגיבים לזיהומים תאיים (כגון זיהומים ויראליים). סוגים שונים של תאים באוכלוסיות לימפוציטים יכולים להתאפיין בשילוב של חלבוני פני התא שהם מבטאים ו / או על ידי פאנל של ציטוקינים מופרשים.
מיון מגנטי מאפשר העשרה של אוכלוסיות תאים ממוקדות באמצעות תכונות מגנטיות וביטוי של חלבון אחד או כמה חלבונים על פני התא (1, 2). טכניקה זו מורכבת משלושה שלבים. ראשית, התאים הם דגירה עם חרוזים מגנטיים כי הם יחד עם נוגדנים אחד או כמה חד שבטיים ספציפיים. תאים המבטאים חלבוני שטח שנקשרים לנוגדנים אלה מתחברים חרוזים מגנטיים. לאחר מכן, אוכלוסיות התאים הממוקדות נלכדות עם מגנט. כדי לסיים, התאים הממוקדים נבחנים מהמגנט. בסוף מתקבלים שני מוצרי מיון, אחד המכיל תאים ללא תווית והשני המכיל את תאי היעד בשילוב עם החרוזים המגנטיים. עמודות ניתן להשתמש כדי לשפר את היעילות של מיון מגנטי. בעמודה, רכיב לא מגנטי מאריך את נתיב התא דרך העמודה. לפיכך, זרימת התא מואטת, מקלה על לכידת התא על ידי המגנט.
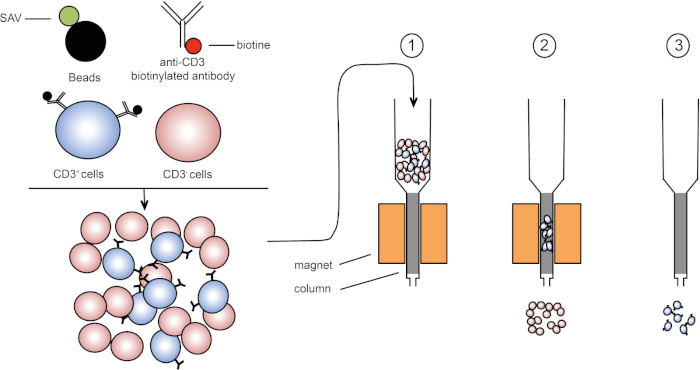
איור 1: ייצוג סכמטי של הפרדה מגנטית. לויקוציטים תימיים מוכתמים בנוגדנים ביוטינילים נגד CD3. לאחר הכביסה, סטרפטאבידין (SAV) חרוזים מצמידים במיוחד לתקן את הביוטין על נוגדנים נגד CD3. (1) תאים מועברים בעמודה. (2) המגנט אינו שומר על תאים ללא תווית, בעוד שתאים חיוביים CD3 נשארים בעמודה. לבסוף, העמודה מופרדת מהמגנט ו-(3) תאים חיוביים ל- CD3 נבחנים בינוניים. אנא לחץ כאן כדי להציג גירסה גדולה יותר של איור זה.
ישנם שני סוגים של מיון מגנטי (3). במיון חיובי, תאים מעניינים נלכדים עם החרוזים המגנטיים. במיון שלילי, תאים לא רצויים מוסרים על ידי לכידה עם החרוזים המגנטיים הנושאים את הנוגדנים המתאימים. טכניקת MACS זו מאפשרת העשרה טובה של תאים ממוקדים ומשפרת את אחוז התאים התאושש מ 1-20% ל 60-98% באיבר. לאחר המיון, יש צורך לאמת את טוהר התא ומיון לפי שיטות שונות (למשל cytometry זרימה). טכניקת MACS אידיאלית להעשרת אוכלוסיית יעד לניסויים אחרים כגון תרבית תאים או ניתוח מחזור תאים.
בתרגיל מעבדה זה, אנו מדגימים כיצד לבודד לויקוציטים תימיים ולאחר מכן להעשיר תאים חיוביים CD3 תימי מהתערובת באמצעות טכניקת מיון תאים מגנטיים.
Procedure
1. הכנה
- לפני שתתחילו, לבשו כפפות מעבדה וביגוד מגן מתאים.
- לשטוף את כל כלי הניתוח, תחילה עם חומר ניקוי ולאחר מכן עם 70% אתנול ולאחר מכן לייבש אותם עם מגבת נייר נקי.
- הכן 200 מ"ל של תמיסת המלח המאוזנת של האנק (HBSS) המכילה 2% סרום עגל עוברי (FCS).
2. ניתוח
- הצמד עכבר מורדם על צלחת ביתור בתנוחת עלון.
- באמצעות מספריים ומלקחיים לבצע לפרוסטומיה אורך כדי לגשת לחלל החזה.
- הסר את הלב כדי לקבל גישה התימוס, אשר ממוקם מעל הלב. לאחר מכן, לזהות את התימוס, אשר מורכב משתי אונות לבנות והוא ממוקם בחלל החזה מעל הלב.
- באמצעות מלקחיים לנתק בזהירות את התימוס ומניחים אותו על צלחת פטרי עם 5 מ"ל של HBSS 2% FCS.
3. בידוד תאי מערכת החיסון
- מניחים את התימוס על מסננת תא 40 מיקרומטר על אותה צלחת פטרי. למחוץ את התימוס עם בוכנה כדי לנתק אותו באותה מנה.
- מעבירים את התימוס הנותק ואת הנוזל לצינור צנטריפוגה של 15 מ"ל.
- לשטוף את צלחת פטרי עם 5 מ"ל של HBSS 2% FCS ולהעביר את המדיום שטוף גם לתוך אותו צינור צנטריפוגה.
- צנטריפוגות הצינור ב 370 x גרם במשך 7 דקות ב 20 מעלות צלזיוס ולהשליך את supernatant הימנעות הכדור.
- resuspend הכדור ב 2 מ"ל של אשלגן אצטט ליזה אריתרוציטים. המתן 2 דקות ולאחר מכן האיפור את עוצמת הקול עד 14 מ"ל באמצעות HBSS 2% FCS.
- צנטריפוגות הצינור שוב ב 370 x גרם במשך 7 דקות ב 20 מעלות צלזיוס. להשליך את supernatant ו resuspend הכדור ב 5 מ"ל של HBSS 2% FCS.
- להעריך את ריכוז התא באמצעות בדיקות כתמים כחול טריפן ולהתאים את ריכוז התא הסופי ל 107 תאים / מ"ל באמצעות נפח מתאים של HBSS 2% FCS.
4. תיוג מגנטי של תאי מערכת החיסון
- קח שני צינורות FACS. סמן צינור אחד, "תאי T לא מועשרים", והצינור השני, "תאי T מועשרים" - שיופרדו באמצעות תיוג מגנטי.
- הפצת פתרון תא לכל אחד משני צינורות ה- FACS.
- צנטריפוגה צינור "תאי T מועשרים" ב 370 x גרם במשך 3 דקות ב 20 מעלות צלזיוס ולהשליך את supernatant הימנעות הכדור.
- resuspend הכדור ב 250 μL של נוגדנים ביוטינילאט אנטי CD3 לערבב (טבלה 1, לערבב 1).
| לערבב | תיוג ריאגנטים | דילול |
| 1 | נוגדן ביוטינילאט נגד CD3 | 1/400 (ב- HBSS 2% FCS) |
| 2 | סטרפטאבידין חרוזים מצמידים | 1/5 (ב- HBSS 2% FCS) |
| 3 | אנטי CD3 BV421 | 1/200 (ב- HBSS 2% FCS) |
טבלה 1: קומפוזיציה לערבב נוגדנים. תערובות 1 ו-2 משמשות להפרדה מגנטית. תערובת 3 משמשת להערכת העשרת התא לאחר הפרדה מגנטית.
- לדגור על תערובת ההשעיה-נוגדנים של התא במשך 15 דקות ב-4 מעלות צלזיוס בחושך.
- הוסף 3 מ"ל של HBSS 2% FCS הן לצינורות וצנטריפוגה אותם שוב ב 370 x g במשך 3 דקות ב 20 מעלות צלזיוס.
- השליכו את הסופר-נט והדביקו מחדש את הכדור ב-250 חרוזים מצמידי סטרפטאבין (טבלה 1, ערבוב 2).
- לדגור על תערובת התאים והחרוזים במשך 20 דקות על קרח.
- לאחר מכן, להוסיף 3 מ"ל של HBSS 2% FCS ולערבב היטב צנטריפוגה שוב ב 370 x g במשך 3 דקות ב 20 מעלות צלזיוס.
- resuspend הכדור ב 2 מ"ל של HBSS 2% FCS.
5. הפרדה מגנטית של תאים חיוביים CD3
- מקם את העמודה על המגנט והוסף 3 מ"ל של HBSS 2% FCS כדי לח את המערכת. חכה 5 דקות.
- לאחר מכן, הזרם את התאים המסומנים בתווית לתוך העמודה.
- לאחר התליית התא עובר דרך העמודה, לשטוף את העמודה X3 פעמים עם 3 מ"ל של HBSS 2% FCS.
- לאחר מכן, הסר את העמודה מהמגנט והנח אותו בצינור איסוף של 15 מ"ל.
- כדי לחמוק מתאי היעד, הוסף 5 מ"ל של HBSS 2% FCS לעמודה ורוקן את העמודה עם הבוכנה.
- חזור על שלב ההתחמקות עם עוד 5 מ"ל של HBSS 2% FCS.
6. הערכת העשרת תאי יעד לפי ציטומטריית זרימה
- העבר 500 μL של השעיית תא eluted לצינור FACS שכותרתו "תאי T מועשרים". העבר 200 μL של השעיית "תאי T לא מועשרים" ל- FACS שני.
- לאחר מכן, צנטריפוגה שני הצינורות ב 370 x g במשך 7 דקות ב 20 מעלות צלזיוס.
- השלך את supernatant, ולאחר מכן להוסיף 100 μL של נוגדן פלואורסצנטי לערבב 3 (ראה טבלה 1) לשני הצינורות.
- לדגור על שני הצינורות במשך 20 דקות ב 4°C בחושך.
- לאחר מכן, להוסיף 3 מ"ל של HBSS 2% FCS צינורות צנטריפוגה אותם ב 370 x g במשך 3 דקות ב 20 מעלות צלזיוס.
- להשליך את supernatant, ולאחר מכן resuspend כל צינור ב 250 μL של HBSS 2% FCS.
- עכשיו, להעריך את קצב העשרת התאים CD3 חיובי על ידי ציטומטריית זרימה.
7. ניתוח נתונים
- פתח את סמל 'FlowJo' וגרור את הקבצים עבור כל צינור בחלון "כל הדוגמה".
- לחץ פעמיים על קובץ "תאי T מועשרים" כדי להציג את התוויית הנקודות המציגה פיזור קדימה (FSC-A) בציר X ופיזור הצד (SSC-A) בציר ה- Y.
- לחץ על "מצולע" כדי להקיף את אוכלוסיות הלימפוציטים.
- לאחר מכן, לחץ פעמיים על האוכלוסייה המקיפה כדי ליצור חלון חדש.
- בחר "FSC-W" בציר Y ו - "FSC-A" בציר X והקף את התאים השליליים FSA-W. בחלון "זיהוי אוכלוסין משנה", תן שם לאוכלוסיית התאים "תאים בודדים".
- לחץ פעמיים על האוכלוסייה המקיפה כדי ליצור חלון חדש. בחר "CD3" בציר Y והקף את התאים החיוביים ל- CD3. בחלון "זיהוי אוכלוסין משנה" קוראים לאוכלוסיית התאים שלך "תאי T".
- חזור על הפעולה עם "תאי T לא מועשרים".
- כדי להציג באופן חזותי את אוכלוסיית התאים, לחץ על "עורך הפריסה" וגרור את האוכלוסייה "תאי T" מקבצים "תאי T מועשרים" ו " תאי T שאינם מועשרים "לתוך הכרטיסיה.
- חלקות נקודה המייצגות לימפוציטים CD3+ יופיעו. תאי CD3+ אמורים להופיע רק באוכלוסיית העניין בצינור המועשר CD3+ בלבד.
- כדי להעריך את ההעשרה של לימפוציטים CD3+ בתאים ממוינים, לחץ על "עורך טבלאות"ולאחר מכן גרור את האוכלוסייה "תאי T" מקבצים "תאי T מועשרים" ו " תאי T לא מועשרים "לטבלה.
- בתפריט "סטטיסטיקה", בחר "תדירות הלימפוציטים" תאים כדי לבדוק את אחוז תאי CD3 + בכל הלימפוציטים ולאחר מכן לחץ על "צור טבלה".
- ערכי פרמטר יופיעו בטבלה חדשה. עבור "תאי T מועשרים", התדירות של תאי CD3+ צריכה להיות סביב 80%.
Results
בפרוטוקול זה, תאים חיוביים CD3 הועשרו מלוקוציטים תימיים באמצעות מיון תאים מגנטיים (איור 1). לפני העשרת תאים מגנטיים CD3 תאים חיוביים ייצגו 53.6% מכלל התאים התימין (איור 2, לוחות עליונים). לאחר העשרת התא המגנטי, אחוז התאים החיוביים ל-CD3 עלה ל-95% (איור 2, החלוניות התחתונות). לכן, MACS היא טכניקה פשוטה, מהירה ויעילה העשרת תאים כדי להעשיר את אוכלוסיות התא הרצוי מתערובת השעיית תאים.

איור 2: אסטרטגיית גיטינג ומיון מבחן טוהרה. התאים מגודרים תחילה על סמך המורפולוגיה שלהם (משמאל: FSC-A, SSC-A), ולאחר מכן תאים מסוממים נגד CD3 (מימין: CD3, SSC-A). החלונית העליונה מייצגת את השעיית תאי התימוס לפני העשרת התא. החלונית התחתונה מייצגת השעיית תאי תימוס לאחר מיון תאים מגנטיים. אנא לחץ כאן כדי להציג גירסה גדולה יותר של איור זה.
Application and Summary
טכנולוגיית הפרדה מגנטית היא שיטה נפוצה למיין בקלות ובמהירות אוכלוסיית תאי יעד. באמצעות תאי T נוגדנים ספציפיים וחרוזים מגנטיים העשרנו את תדירות תאי ה- T במדגם שלנו. שיעור הטוהר בסוף הניסוי תלוי באחוז תאי היעד בהשעיית התא הראשונית. תאים המתקבלים לאחר מיון תאים מגנטיים יכולים לשמש למטרות שונות כגון - העברת תאים או ניתוח מחזור התא. שיטת מיון נוספת, באמצעות ציטומטריית זרימה, יכולה לשמש להעשרת תאים. טכניקה זו מניבה יש שיעור טוהר גבוה מאוד לאחר מיון התא אולם זה דורש צעדים נוספים ולוקח יותר זמן.
References
- Owen, C. S. and Sykes, N. L. Magnetic labeling and cell sorting. Journal of Immunological Methods. 73 (1), 41-48 (1984).
- Miltenyi, S., Müller, W., Weichel, W. and Radbruch, A. High gradient magnetic cell separation with MACS. Cytometry. 11 (2), 231-238 (1990).
- Plouffe, B. D., Murthy, S. K. and Lewis, L. H. Fundamentals and application of magnetic particles in cell isolation and enrichment: a review. Reports on Progress in Physics. 78 (1), (2014).
Tags
Skip to...
Videos from this collection:

Now Playing
מיון תאים המופעל מגנטי (MACS): בידוד של לימפוציטים T תימיים
Immunology
22.9K Views

ציטומטריית זרימה ומיון תאים המופעלים על-ידי פלואורסצנטיות (FACS): בידוד של לימפוציטים מסוג Splenic B
Immunology
93.1K Views

אליסה אסייס: עקיפה, כריך ותחרותי
Immunology
238.8K Views

אליספוט אסאי: זיהוי של IFN-γ הפרשת טחול
Immunology
28.5K Views

אימונוהיסטוכימיה ואימונוציטוכימיה: הדמיית רקמות באמצעות מיקרוסקופיה קלה
Immunology
79.0K Views

יצירת נוגדנים: ייצור נוגדנים חד שבטיים באמצעות היברידיות
Immunology
43.6K Views

מיקרוסקופיה חיסונית: כתמי אימונופלואורסצנטיות של מקטעי רקמות משובצים בפרפין
Immunology
53.9K Views

מיקרוסקופיית פלואורסצנטיות קונפוקלית: טכניקה לקביעת לוקליזציה של חלבונים בפיברובלסטים של עכברים
Immunology
43.2K Views

טכניקות מבוססות אימונופרציפיטציה: טיהור חלבונים אנדוגניים באמצעות חרוזי אגרוז
Immunology
87.8K Views

ניתוח מחזור התא: הערכת התפשטות תאי CD4 ו- CD8 T לאחר גירוי באמצעות כתמי CFSE וציטומטריית זרימה
Immunology
24.3K Views

העברת תאים מאמצת: הצגת טחול עכבר תורם לעכבר מארח והערכה של הצלחה באמצעות FACS
Immunology
22.5K Views

ת לבדיקת מוות בתא: כרום שחרר את ההסתה של היכולת הציטוטוקסית
Immunology
151.4K Views
Copyright © 2025 MyJoVE Corporation. All rights reserved