
Spettroscopia infrarossa
Panoramica
Fonte: Vy M. Dong e Zhiwei Chen, Dipartimento di Chimica, Università della California, Irvine, CA
Questo esperimento dimostrerà l'uso della spettroscopia infrarossa (IR) (nota anche come spettroscopia vibrazionale) per chiarire l'identità di un composto sconosciuto identificando i gruppi funzionali presenti. Gli spettri IR saranno ottenuti su uno spettrometro IR utilizzando la tecnica di campionamento a riflessione totale attenuata (ATR) con un campione pulito dell'ignoto.
Principi
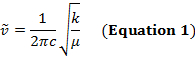
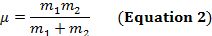
Un legame covalente tra due atomi può essere pensato come due oggetti con masse m1 e m2 che sono collegati con una molla. Naturalmente, questo legame si allunga e si comprime con una certa frequenza vibrazionale. Questa frequenza  è data dall'equazione 1, dove k è la costante di forza della molla, c è la velocità della luce e μ è la massa ridotta (Equazione 2). La frequenza è tipicamente misurata in numeri d'onda, che sono espressi in centimetri inversi (cm-1).
Dall'equazione 1, la frequenza è proporzionale alla forza della molla e inversamente proporzionale alle masse degli oggetti. Pertanto, i legami C-H, N-H e O-H hanno frequenze di allungamento più elevate rispetto ai legami C-C e C-O, poiché l'idrogeno è un atomo leggero. I legami doppi e tripli possono essere considerati come molle più forti, quindi un doppio legame C-O ha una frequenza di allungamento più elevata rispetto a un legame singolo C-O. La luce infrarossa è una radiazione elettromagnetica con lunghezze d'onda che vanno da 700 nm a 1 mm, che è coerente con le forze di legame relative. Quando una molecola assorbe la luce infrarossa con una frequenza che equivale alla frequenza vibrazionale naturale di un legame covalente, l'energia della radiazione produce un aumento dell'ampiezza della vibrazione del legame. Se le elettronegatività (la tendenza ad attrarre elettroni) dei due atomi in un legame covalente sono molto diverse, si verifica una separazione di carica che si traduce in un momento di dipolo. Ad esempio, in un doppio legame C-O (un gruppo carbonilico), gli elettroni trascorrono più tempo intorno all'atomo di ossigeno rispetto all'atomo di carbonio perché l'ossigeno è più elettronegativo del carbonio. Quindi, c'è un momento di dipolo netto che risulta in una carica parzialmente negativa sull'ossigeno e una carica parzialmente positiva sul carbonio. D'altra parte, un alchino simmetrico non ha un momento di dipolo netto perché i due singoli momenti di dipolo su ciascun lato si annullano a vicenda. L'intensità dell'assorbimento infrarosso è proporzionale al cambiamento del momento di dipolo quando il legame si allunga o si comprime. Quindi, un allungamento del gruppo carbonilico mostrerà una banda intensa nell'IR, e un alchino interno simmetrico mostrerà una piccola, se non invisibile, banda per lo stiramento del triplo legame C-C (Figura 1). La tabella 1 mostra alcune frequenze di assorbimento caratteristiche. La Figura 2 mostra lo spettro IR di un estere di Hantzsch. Si noti il picco a 3.343 cm-1 per il legame singolo N-H e il picco a 1.695 cm-1 per i gruppi carbonilici. In questo esperimento, viene utilizzata la tecnica di campionamento ATR, in cui la luce infrarossa si riflette sul campione che è in contatto con un cristallo ATR più volte. Tipicamente, vengono utilizzati materiali con un alto indice di rifrazione, come il germanio e il seleniuro di zinco. Questo metodo consente di esaminare direttamente gli analiti solidi o liquidi senza ulteriore preparazione.
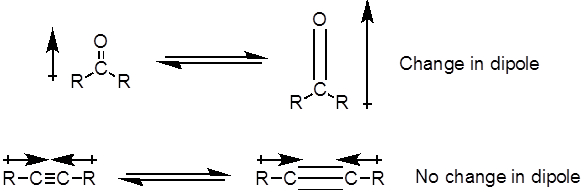
Figura 1. Diagramma che mostraC-O doppioe C-C triplo legame si allunga e il conseguente cambiamento nel momento di dipolo.
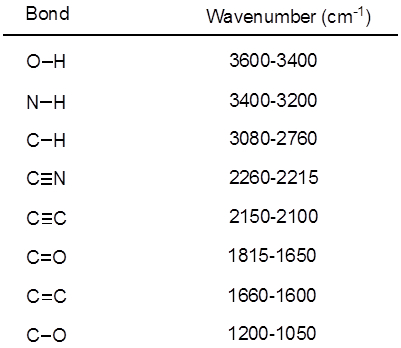
Tabella 1. Frequenze IR caratteristiche dei legami covalenti presenti nelle molecole organiche.
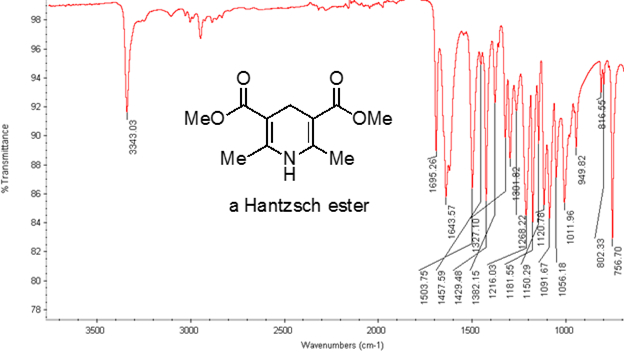
Figura 2. Spettro IR di un estere di Hantzsch.
Procedura
- Accendere lo spettrometro IR e lasciarlo riscaldare.
- Ottenere un campione sconosciuto dall'istruttore e registrare la lettera e l'aspetto del campione.
- Raccogli uno spettro di sfondo.
- Usando una spatola metallica, posizionare una piccola quantità di campione sotto la sonda.
- Ruotare la sonda fino a quando non si blocca in posizione.
- Registrare lo spettro IR del campione sconosciuto.
- Ripetere se necessario per ottenere uno spettro di buona qualità.
- Registrare le frequenze di assorbimento indicative dei gruppi funzionali presenti.
- Pulire la sonda con acetone.
- Spegnere lo spettrometro.
- Analizzare lo spettro ottenuto. La Figura 3 mostra i possibili candidati per il campione sconosciuto. Indicare la probabile identificazione del campione sconosciuto.

Figura 3. Diagramma che mostra le possibili identità dell'ignoto.
Risultati
Tabella 2: Aspetto e frequenze IR osservate dei composti elencati nella Figura 3.
| Numero composto | 1 | 2 | 3 | 4 | 5 | 6 | 7 | 8 | 9 | 10 |
| Apparenza | liquido trasparente | solido bianco | liquido trasparente | liquido trasparente | liquido trasparente | liquido trasparente | liquido giallo | solido bianco | solido bianco | liquido trasparente |
| Frequenze osservate (cm-1) | 1691, 1601, 1450, 1368, 1266 |
2773, 2730, 1713, 1591, 1576 |
2940, 2867, 1717, 1422, 1347 |
3026, 2948, 2920, 1605, 1496 |
2928, 2853, 1450, 904, 852 |
3926, 3315, 2959, 2120, 1461 |
3623, 3429, 3354, 2904, 1601 |
3408, 3384, 3087, 1596, 1496 |
3226, 2966, 1598, 1474, 1238 |
3340, 2959, 2861, 1468, 1460 |
Applicazione e Riepilogo
In questo esperimento, abbiamo dimostrato come identificare un campione sconosciuto in base al suo caratteristico spettro IR. Diversi gruppi funzionali danno diverse frequenze di stretching, che permettono l'identificazione dei gruppi funzionali presenti.
Come mostrato in questo esperimento, la spettroscopia IR è uno strumento utile per il chimico organico per identificare e caratterizzare una molecola. Oltre alla chimica organica, la spettroscopia IR ha applicazioni utili in altri settori. Nell'industria farmaceutica, questa tecnica viene utilizzata per l'analisi quantitativa e qualitativa dei farmaci. Nella scienza dell'alimentazione, la spettroscopia IR viene utilizzata per studiare grassi e oli. Infine, la spettroscopia IR viene utilizzata per misurare la composizione dei gas serra, cioèCO2,CO, CH4e N2O negli sforzi per comprendere i cambiamenti climatici globali.
Vai a...
Video da questa raccolta:

Now Playing
Spettroscopia infrarossa
Organic Chemistry II
215.3K Visualizzazioni

Pulizia della vetreria
Organic Chemistry II
123.7K Visualizzazioni

Sostituzione nucleofila
Organic Chemistry II
99.6K Visualizzazioni

Agenti riducenti
Organic Chemistry II
43.1K Visualizzazioni

Reazione di Grignard
Organic Chemistry II
149.1K Visualizzazioni

Titolazione di n-butillitio
Organic Chemistry II
48.0K Visualizzazioni

Dispositivo di Dean Stark
Organic Chemistry II
100.6K Visualizzazioni

Ozonolisi degli alcheni
Organic Chemistry II
67.1K Visualizzazioni

Organocatalisi
Organic Chemistry II
16.9K Visualizzazioni

Reazione di accoppiamento catalizzata da palladio
Organic Chemistry II
34.5K Visualizzazioni

Sintesi in fase solida
Organic Chemistry II
41.1K Visualizzazioni

Idrogenazione
Organic Chemistry II
49.6K Visualizzazioni

Polimerizzazione
Organic Chemistry II
94.4K Visualizzazioni

Punto di fusione
Organic Chemistry II
150.0K Visualizzazioni

Polarimetro
Organic Chemistry II
100.1K Visualizzazioni
Personale delle biblioteche
Copyright © 2025 MyJoVE Corporation. Tutti i diritti riservati