Method Article
生きた酵母細胞におけるミトコンドリア過酸化物のレシオメトリックバイオセンサーmtHyPer7のイメージング
要約
過酸化水素(H2O2)は、酸化的損傷の原因であり、シグナル伝達分子でもあります。このプロトコルは生きているイーストのミトコンドリア目標とされたHyPer7 (mtHyPer7)の遺伝的にコードされたratiometricバイオセンサーを使用してミトコンドリアH2O2 を測定する方法を記述する。イメージング条件を最適化し、無料で入手できるソフトウェアを使用して定量的な細胞および細胞内解析を実行する方法について詳しく説明します。
要約
ミトコンドリアの機能不全、または機能変化は、神経変性障害や筋骨格系障害、癌、正常な老化など、多くの疾患や症状に見られます。ここでは、遺伝的にコードされた低侵襲レシオメトリックバイオセンサーを使用して、生きた酵母細胞のミトコンドリア機能を細胞および細胞内の解像度で評価するアプローチについて説明します。バイオセンサーであるミトコンドリア標的HyPer7(mtHyPer7)は、ミトコンドリア中の過酸化水素(H2O2)を検出します。これは、環状に置換された蛍光タンパク質および細菌OxyRタンパク質のH2O2応答性ドメインに融合したミトコンドリアシグナル配列からなる。このバイオセンサーは、プラスミド由来のコンストラクトと比較してより一貫した発現のために、CRISPR-Cas9マーカーフリーシステムを使用して生成され、酵母ゲノムに組み込まれます。
mtHyPer7は、ミトコンドリアを定量的に標的とし、酵母の増殖速度またはミトコンドリア形態に検出可能な影響を及ぼさず、通常の増殖条件下および酸化ストレスへの曝露時に、ミトコンドリアH2O2の定量的読み出しを提供する。このプロトコルでは、スピニングディスク共焦点顕微鏡システムを使用してイメージング条件を最適化し、無料で入手できるソフトウェアを使用して定量分析を行う方法について説明します。これらのツールにより、細胞内および集団内の細胞間のミトコンドリアに関する豊富な時空間情報を収集することができます。さらに、ここで説明するワークフローは、他のバイオセンサーの検証にも使用できます。
概要
ミトコンドリアは真核生物の必須細胞小器官であり、酸化的リン酸化と電子輸送によってATPを産生する機能でよく知られています1。さらに、ミトコンドリアはカルシウム貯蔵、脂質、アミノ酸、脂肪酸、鉄硫黄クラスターの合成、およびシグナル伝達の部位です2,3。細胞内では、ミトコンドリアは細胞の種類や代謝状態に応じて変化する特徴的な形態と分布を持つ動的ネットワークを形成しています。さらに、ミトコンドリアは融合して分裂することができますが、細胞内のすべてのミトコンドリアが同等であるとは限りません。多くの研究により、膜電位や酸化状態などの属性における個々の細胞内のミトコンドリアの機能的不均一性が文書化されています4,5,6。このミトコンドリア機能の変動は、mtDNAの突然変異(核DNAよりも高い割合で発生する)によるオルガネラの損傷と、オルガネラの内外で発生する活性酸素種(ROS)による酸化的損傷に一部起因している7,8,9。オルガネラへの損傷は、損傷を修復するか、修復できないほど損傷したミトコンドリアを排除するミトコンドリア品質管理メカニズムによって軽減されます10。
過酸化水素(H2O2)は、細胞タンパク質、核酸、および脂質に対する酸化的損傷の原因である活性酸素種である。しかしながら、H2O2は、標的タンパク質中のチオールの可逆的酸化を介して細胞活動を調節するシグナル伝達分子としても機能する11,12。H2O2は、ミトコンドリアの電子伝達鎖から漏れる電子から、およびNADPHオキシダーゼおよびモノアミンオキシダーゼ13、14、15、16、17、18、19、20などの特定の酵素によって生成される。また、チオレドキシンやグルタチオン21,22,23に基づくものを含む抗酸化システムによっても不活性化されます。したがって、ミトコンドリアH2O2レベルの分析は、正常なミトコンドリアおよび細胞機能におけるこの代謝産物の役割を理解するため、ならびに酸化ストレス条件下で重要である。
このプロトコルの全体的な目標は、細胞小器官(mtHyPer7)を標的とする遺伝的にコードされたレシオメトリックH2O2バイオセンサー、HyPer7を使用してミトコンドリアH2O2を検出することである。mtHyPer7は、ATP9由来のミトコンドリアシグナル配列(Su9前配列)、環状に置換された緑色蛍光タンパク質(GFP)、および髄膜炎菌由来のOxyRタンパク質のH2O2結合ドメインからなるキメラです24(図1)。環状に置換されたGFPでは、天然GFPのN末端とC末端が融合し、発色団の近くに新しい末端が形成され、天然GFP25と比較して、タンパク質への移動度が高く、スペクトル特性の不安定性が向上します。mtHyPer7のOxyRドメインとH2O2との相互作用は、親和性が高く、H2O2選択的であり、保存されたシステイン残基の可逆的な酸化およびジスルフィド架橋形成をもたらす。OxyRの酸化に伴う立体配座変化は、mtHyPer7の環状に置換されたGFPに転移し、その結果、mtHyPer7発色団の励起最大値が還元状態の405nmからH2O2酸化状態の488nmにスペクトルシフトする26。したがって、488nm対405nmでの励起に応答したmtHyPer7からの蛍光の比は、H2O2によるプローブの酸化を反映している。
理想的には、バイオセンサーは、標的分子のリアルタイム、絶対的、定量的な読み取りを提供する必要があります。しかし、残念ながら、これは実際の測定では必ずしも可能ではありません。mtHyPer7などの酸化センサーの場合、リアルタイム読み出しはジスルフィド架橋の減少率の影響を受けます。ROSバイオセンサーで使用される還元系は異なり、チオレドキシン系によって還元されたHyPer7と、酵母細胞質中のグルタチオンによって還元されたroGFP2-Tsa2ΔCRの比較によって示されるように、これらはプローブ応答のダイナミクスを劇的に変化させる可能性があります27。したがって、mtHyPer7比から相対的なH2O 2濃度について結論を導き出すには、還元システムが実験中に一定の容量を維持すると仮定する必要があります。これらの考察にもかかわらず、HyPer7および関連プローブは、生細胞25、28、29におけるH2O2に関する情報を得るために、様々な状況で用いられてきた。
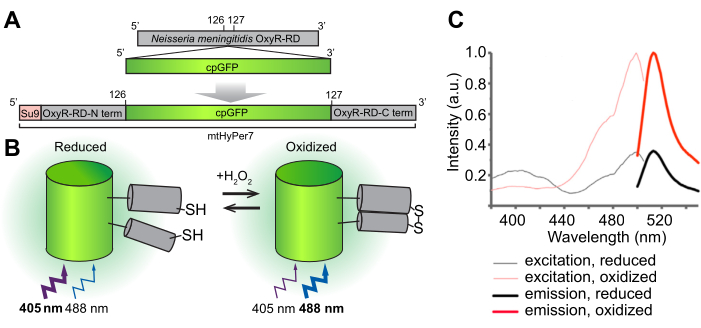
図1:H2O2バイオセンサーmtHyPer7の設計、分子メカニズム、および励起/発光スペクトル。 (A)mtHyPer7プローブは、髄膜炎菌由来のOxyR-RDドメインに環状に置換されたGFPを挿入することによって得られます。Neurospora crassa(Su9)由来のATP合成酵素のサブユニット9由来のミトコンドリア標的配列が含まれています。 (b)mtHyPer7のH2O2感知機構の説明図。RDドメインにおけるシステイン酸化は、488 nmでの励起による蛍光発光を増加させ、405 nmでの励起による発光を減少させます。(C)酸化型および還元型におけるHyPer7の励起および発光スペクトル。この図は、Pak et al.24の許可を得て転載したものです。略語:GFP =緑色蛍光タンパク質;cpGFP = 循環順列GFP。この図の拡大版をご覧になるには、ここをクリックしてください。
mtHyPer7のこのレシオメトリックイメージングは、ミトコンドリアH2O 2定量に重要な利点を提供します24,27;プローブ濃度の内部制御を提供します。さらに、H2O2曝露によって生じる励起ピークのシフトは、H 2 O2の飽和濃度においてさえ完全ではない。したがって、レシオイメージングは、分析に2つのスペクトルポイントを組み込むことで感度を高めることができます。
ここで用いるmtHyPer7プローブは、H2O2に対して非常に高い親和性を有し、pH24に対する感度が比較的低く、Caenorhabditis elegansミトコンドリア30を首尾よく標的としている。このタンパク質は酵母でも使用されています27,31。しかし、以前の研究では、mtHyPer7のプラスミド媒介発現に依存していたため、プローブ発現に細胞間のばらつきが生じていました27。さらに、このプロトコルで記述されている構成物はマーカーのない統合のためのCRISPRベースのアプローチを使用して染色体X32の保存された、遺伝子のない領域に統合された。統合されたバイオセンサー遺伝子の発現は、強力な構成的TEF1プロモーターによっても制御されます(図2)。その結果、酵母細胞集団におけるバイオセンサーの発現は、プラスミド由来バイオセンサーの発現を用いて観察されたものと比較して、より安定で一貫したものであり、バイオセンサーを有する細胞は、選択的培地を必要とせずに増殖することができる。
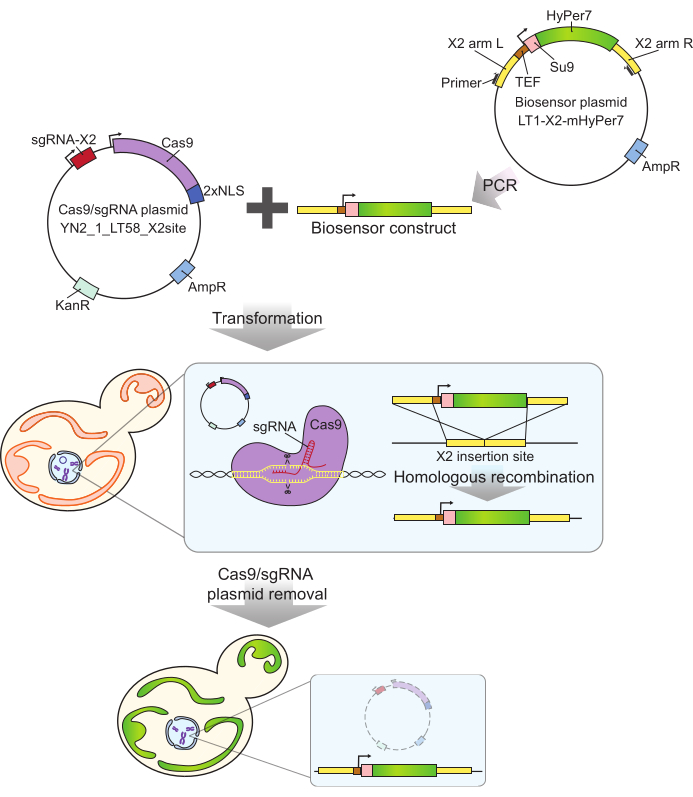
図2:CRISPRによるmtHyPer7発現細胞の作製。 Cas9およびsgRNA含有プラスミド(YN2_1_LT58_X2site)およびPCR増幅mtHyPer7含有バイオセンサーコンストラクトは、酢酸リチウム変換によって出芽酵母細胞に導入されます。X染色体(X2)上の無遺伝子挿入部位は、sgRNAを持つCas9タンパク質によって認識・切断され、相同組換えによりバイオセンサーがゲノムに組み込まれます。顕微鏡スクリーニング、コロニーPCR、およびシーケンシングによって成功した形質転換体を同定した後、Cas9プラスミドを非選択的培地中で増殖させることで除去(硬化)します。略語: sgRNA = single guide RNA;TEF = 転写エンハンサー因子。 この図の拡大版をご覧になるには、ここをクリックしてください。
最後に、mtHyPer7は他のROSバイオセンサーよりも優れています。例えば、活性酸素の検出に使用される有機色素(ジヒドロエチジウム[DHE]2やMitoSOX3など)は、不均一または非特異的な染色を引き起こす可能性があり、多くの場合、エタノールやジメチルスルホキシドなどの溶媒で送液されるため、溶媒効果に対する追加の制御が必要です。ROSバイオセンサーの別のクラスは、蛍光共鳴エネルギー移動(FRET)ベースのバイオセンサー(例えば、細胞酸化還元状態4用のレドックス蛍光、および過酸化物センサーHSP-FRET5、OxyFRET6、およびPerFRET6)です。これらのプローブは遺伝的にコードされており、原理的に高感度であり、十分に特徴付けられたミトコンドリアシグナル配列を使用してミトコンドリアを定量的に標的にすることができます。しかし、FRETベースのプローブの使用には、交差励起やブリードスルーによるバックグラウンド、FRETが起こるための蛍光色素の近接性や配向に関する厳しい要件など、課題があります33,34。さらに、FRETプローブは2つの蛍光タンパク質で構成されており、スペクトルシフトプローブと比較して、目的の細胞での発現にはより大きなコンストラクトが必要です。ここで説明するプロトコルは、HyPer7ベースのバイオセンサーの強みを活用し、このコンパクトでレシオメトリック、高親和性、遺伝的にコードされたプローブを使用して、生きた酵母のミトコンドリア中の過酸化物の定量的イメージングに使用するために開発されました。
プロトコル
1. バイオセンサープラスミドの作製、酵母ゲノムへの組み込み、ミトコンドリアへのmtHyPer7の標的化とミトコンドリア形態、細胞増殖速度、酸化ストレス感受性への影響の評価
注:バイオセンサーの構築と特性評価に使用されるバイオセンサープラスミドの構築、株、プラスミド、およびプライマーについては、それぞれ補足ファイル1、補足表S1、補足表S2、および補足表S3を参照してください。このプロトコルで使用されるすべての材料、試薬、および機器に関連する詳細については、材料表を参照してください。
- プライマーY290およびY291(図2)を用いて、ポリメラーゼ連鎖反応(PCR)により、バイオセンサープラスミドからバイオセンサーコンストラクトを増幅します。
- 500 ng の Cas9/ガイド RNA プラスミド (YN2_1_LT58_X2site32) をステップ 1.1 の PCR 産物 50 μL (バイオセンサーコンストラクト) と混合します。 酢酸リチウム法35 を使用して混合物を出芽酵母に変換し、200 mg/mL G418 を含む YPD プレート上で形質転換体を選択します。
- プライマーY292およびY293を用いたゲノムDNAのPCR増幅により、候補形質転換体をスクリーニングします。予想されるサイズ(正:3.5 kb、負:0.3 kb)のインサートを持つ形質転換体については、さらに検証するために挿入領域を配列決定します。
- バイオセンサーが成長とミトコンドリア機能に及ぼす影響を評価します(図3)。バイオセンサーが細胞やミトコンドリアの機能に影響を及ぼしていると思われる場合は、プロモーター、統合部位、または親株を変更することで、その影響を最小限に抑えるようにしてください。
- 前述のように、酸化ストレッサー(例えば、パラコート)の存在下および非存在下での成長率に対するバイオセンサー構築物の影響を決定する36。
- 中対数期の細胞を、処理の有無にかかわらず、対応する培地 200 μL 中で 600 nm の光学密度(OD600)0.0035 に希釈し、96 ウェル平底プレートの各ウェルに入れます。プレートリーダーを使用して、培養物の光学濃度を20分ごとに72時間測定します。最大成長率(傾き)は、72時間のコース中の240分間隔でのODの最大変化として計算します。
- 蛍光顕微鏡で細胞を可視化し、前述のように明るさとミトコンドリアの形態を評価します37。
- 細胞を中対数期まで増殖させ、ミトコンドリアを 250 nM MitoTracker Red で 30 分間染色し、2 回洗浄してからイメージングします。広視野蛍光顕微鏡または共焦点蛍光顕微鏡で0.3μm間隔で深さ6μmのZスタックを捕捉し、目視検査します。細長い管状構造を形成するミトコンドリアを探します。
- 前述のように、酸化ストレッサー(例えば、パラコート)の存在下および非存在下での成長率に対するバイオセンサー構築物の影響を決定する36。
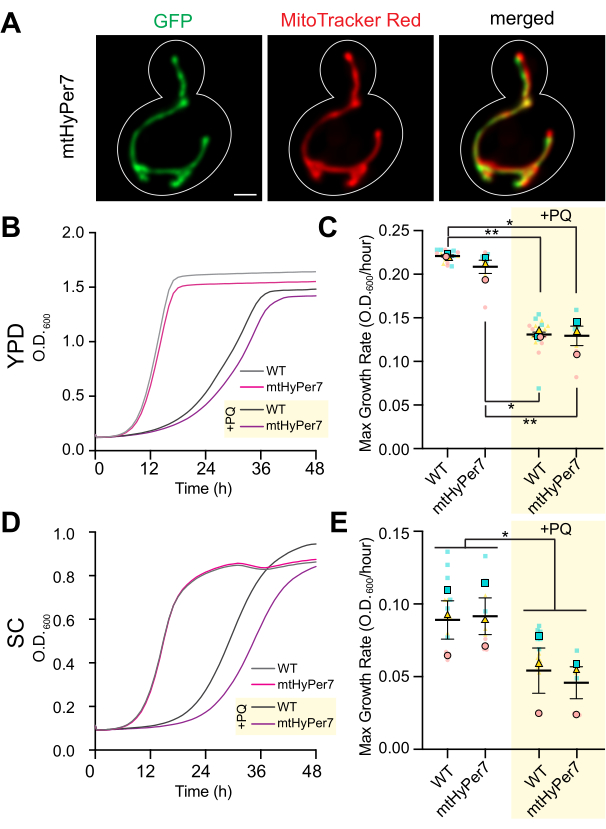
図3:mtHyPer7はミトコンドリアを標的としており、ミトコンドリアの形態、細胞増殖、酸化ストレスに対する感受性に影響を与えません 。 (A)mtHyPer7を発現する生きた酵母細胞のミトコンドリア形態。左パネル:488 nm励起で可視化したmtHyPer7。中央のパネル:250 nM MitoTracker Redで標識したミトコンドリア。右パネル:マージされた画像。最大強度の予測が表示されます。セルのアウトラインは白で表示されます。スケールバー = 1 μm。 (B、C)YPD培地中の2.5 mMパラコートの存在下(+PQ)または非存在下で増殖させた野生型細胞およびmtHyPer7を発現する細胞の増殖曲線と最大増殖速度。(D、E)SC培地中の2.5 mMパラコートの存在下(+PQ)または非存在下で増殖した野生型およびmtHyPer7発現細胞の増殖曲線と最大増殖速度。すべての成長曲線は、3つの独立した反復の平均です。最大成長率は、平均±平均の標準誤差(SEM)として表されます。増殖曲線解析は、中対数期の細胞を 200 μL の対応する培地中で OD600 0.0035 に希釈し、96 ウェル平底プレートの各ウェルに注入して行いました。培養物のODは、プレートリーダーを用いて72時間、20分ごとに測定した。各菌株/条件を3重に播種し、平均成長率をプロットしました。最大成長率(傾き)は、72時間にわたる240分間隔のODの変化を使用して計算されました。略語:WT =野生型;PQ = パラコート。 この図の拡大版をご覧になるには、ここをクリックしてください。
2. 細胞培養とイメージングの準備(図4)
- 合成培地中の細胞をイメージングのために中対数相まで増殖させます。5 mLのミッドログ期培養では、4枚または5枚のスライドに十分な細胞と、合計>100個の芽細胞を分析できます。
- 実験前日の朝、酵母細胞のコロニーを1つ入れた50mLの円錐底チューブに5 mLの合成完全(SC)培地を接種し、液体前培養を調製します。
- 前培養をオービタルシェーカーで200rpmおよび30°Cで6〜8時間インキュベートします。前培養のOD600 を測定し、中期に対数期にある必要があります:~0.5-1 × 10⁷ cells/mL、OD600 ~0.1-0.3。
- 翌日のイメージングのために前培養を使用して中対数期の培養を調製します。一晩の成長(8〜16時間)後の中対数期の培養に必要な前培養の量を計算します。細胞をSC培地で増殖させる場合、倍加時間は~2時間です。したがって、5mLの一晩培養液を接種するための前培養液の容量(V)は、式(1)を用いて計算される:
 (1)
(1) - 50 mLの円錐底チューブに5 mLのSC培地に、ステップ2.1.3で計算した前培養量を接種します。オービタルシェーカーで200rpm、30°Cで8〜16時間成長させます。
- 撮影当日は、ステップ2.1.4で生成した培養物が中対数期(OD600 ~0.1-0.3)であることを確認します。中対数期培養液1 mLから、6,000 × g で30秒間遠心分離することにより、細胞を濃縮します。上澄み液を除去し、チューブ内に10〜20μLの上清を残します。マイクロピペットを使用して残留培地と穏やかに混合することにより、細胞ペレットを再懸濁します。
- 送風機または糸くずの出ないティッシュを使用して、ガラス顕微鏡スライドからほこりを取り除き、1.8 μLの細胞懸濁液をスライドに加えます。セルを#1.5(厚さ170μm)のガラスカバーガラスで覆い、気泡が入らないようにカバーガラスを斜めにゆっくりと下げます。
- すぐに画像化し、10分間のイメージング後にスライドを廃棄します。
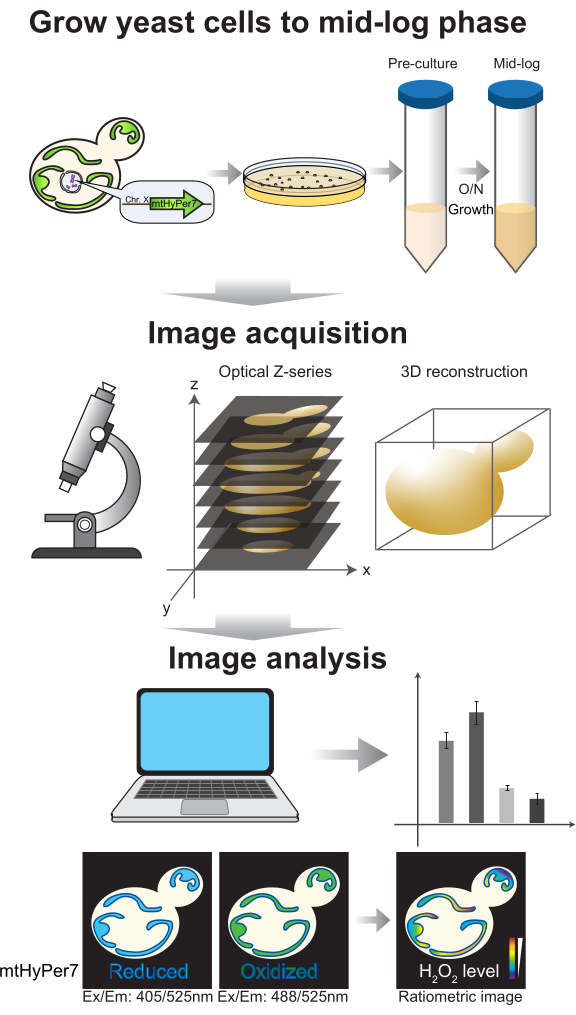
図4:細胞増殖とイメージング。 mtHyPer7を発現する出芽酵母細胞は、中期対数期まで増殖します。Zシリーズの画像は、スピニングディスク共焦点顕微鏡で収集され、3D再構成および分析にかけられます。プロトコルのセクション 2-3 を参照してください。 この図の拡大版をご覧になるには、ここをクリックしてください。
3. 撮影条件の最適化と画像収集(図5)
- イメージングモードを選択します。後処理を伴わない光学セクショニングには、スピニングディスク共焦点装置が好ましい。ただし、信号が低い場合、またはこの機器が利用できない場合は、広視野イメージングを使用し、前述のように、広視野画像がデコンボリューションされて焦点の合っていないぼやけが除去されるようにします38。
- 光学系を選択します。100倍/1.45プランアポクロマートなどの高開口数油浸レンズを使用してください。
- 励起波長と発光波長を選択します。スピニングディスク共焦点イメージングには、405 nmおよび488 nmのレーザー励起と標準GFP発光フィルターを使用します。広視野イメージングには、発光ダイオード(LED)またはランプ励起を使用しますが、標準のGFPフィルターに発光を通す間、励起の変動を許容するフィルター設定を確認してください。
注:これは、たとえば、GFPキューブから励起フィルターを取り外し、LEDまたはフィルターホイールを使用して励起を選択することで実現できます。 - 露光時間と照度を選択します。
- 各蛍光チャンネルで容易に検出可能なシグナルと許容可能な分解能が得られるような取得条件を確立します。たとえば、sCMOSカメラを備えたスピニングディスク共焦点顕微鏡では、2 x 2ビニング、20〜40%のレーザー出力、および200〜600ミリ秒の露光を使用します。
- イメージのヒストグラムを調べます。 12ビット画像(4,096のグレーレベル)では、ピクセル値の合計ダイナミックレンジが彩度なしで少なくとも数百のグレーレベルであることを確認してください(図5A)。さらに、範囲がノイズレベルよりも1桁高いことを確認してください。ノイズレベルは、手順4.1.3.1の説明に従って測定された、画像のセルフリー領域のピクセル値の標準偏差として計算します。
- 選択したイメージング条件下で、光退色またはイメージングによるミトコンドリアストレスをテストします。過度の光退色またはミトコンドリアH2O2の増加が観察される場合は、レーザー出力を下げ、露光またはビニングを増加させる。
- 取得間の遅延のないタイムラプス一連の画像を収集し、イメージング条件がミトコンドリアのシグナル安定性と酸化ストレスに及ぼす影響を評価します。顕微鏡取得ソフトウェアまたはImageJを使用して、各蛍光チャンネル の平均ピクセル値 を測定し、シグナルの安定性(<5%変化; 図5B)。実験にタイムラプスイメージングを伴わない場合は、2〜3回のZスタックの繰り返し(25〜35回の露光)で蛍光が安定していることを確認してください。
注:両方のチャンネルの蛍光の減少は、光退色を示している可能性があります。しかしながら、488nm励起チャネルの増加を伴う405nm励起蛍光の減少は、オルガネラにおけるミトコンドリアH2O2およびイメージング誘発酸化ストレスの増加を示し得る。
- 取得間の遅延のないタイムラプス一連の画像を収集し、イメージング条件がミトコンドリアのシグナル安定性と酸化ストレスに及ぼす影響を評価します。顕微鏡取得ソフトウェアまたはImageJを使用して、各蛍光チャンネル の平均ピクセル値 を測定し、シグナルの安定性(<5%変化; 図5B)。実験にタイムラプスイメージングを伴わない場合は、2〜3回のZスタックの繰り返し(25〜35回の露光)で蛍光が安定していることを確認してください。
- 画像を取得します。Z スタックを収集する場合は、データセット内のすべての画像で Z 間隔が同じであることを確認し、セル全体を含めます。出芽酵母の場合、Z間隔0.5μm、総スタック深さ6μmで画像化します。透過光画像を取得して、細胞の境界を記録します。
- ImageJ39のフィジーディストリビューションと統計ソフトウェアRを使用して、補足ファイル2および https://github.com/theresaswayne/biosensor で利用可能なスクリプトを介して、手動または半自動で画像を解析します(図6)。ソフトウェアの説明では、階層メニューコマンドは太字で「|」で示され、メニュー選択のシーケンスを示します。オプションとボタンは太字で示しています。
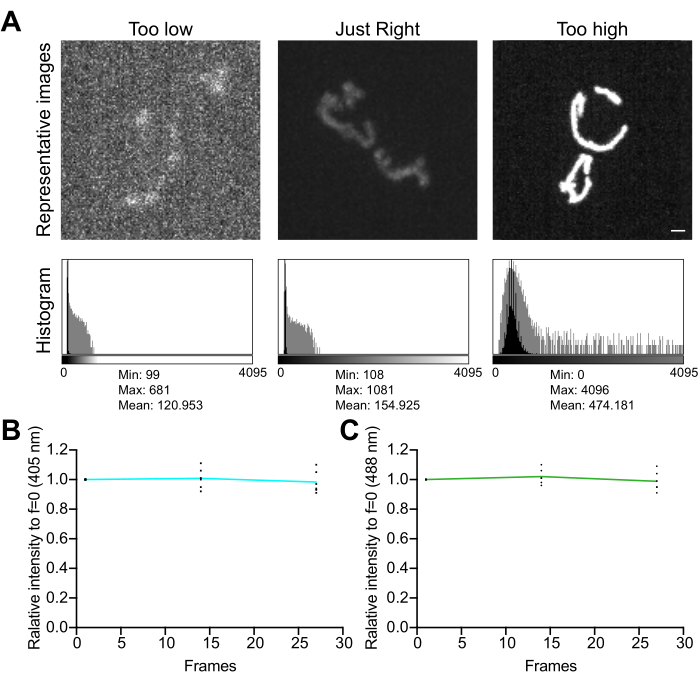
図5:イメージングの最適化 。 (A)正しい強度範囲の画像とヒストグラムの評価。スピニングディスク共焦点像の最大強度投影を示す。ヒストグラムは、画像のダイナミック レンジを示すために、線形の Y 軸 (黒) と対数スケールの Y 軸 (灰色) の両方で表示されます。左のパネル:低強度でダイナミックレンジのノイズの多い画像。センターパネル:許容可能なダイナミックレンジ(~1,000グレーレベル)と強度を持つ画像。右のパネル:コントラストが不適切に強調され、過度の彩度が生じている画像。スケールバー = 1 μm。 (B,C) mtHyPer7の光退色解析連続したZスタックを遅延なく収集し、Zスタックを合計し、ミトコンドリアの平均強度を測定し、最初の時点に正規化しました。最初の 3 つの時点 (27 回の露出) の結果が表示されます。(B)励起波長:405nm。(C)励起波長:488nm。示されている値は、3 つの独立した試行のそれぞれから得られた 3 つのセルの平均です。 この図の拡大版をご覧になるには、ここをクリックしてください。
4. スクリプトによる半自動解析
- バイオセンサー解析スクリプト(例:biosensor.ijmまたはbiosensor-image-subtraction.ijm)を使用して、比率画像を生成および測定します。
- 使用するスクリプトを選択します。各スクリプトを使用するためのプロトコルは似ています。相違点がある場合は、本文中に明記します。
- biosensor.ijm: このスクリプトでは、背景とノイズは、ユーザーが選択した画像領域、固定値、または減算なしで補正されます。背景とノイズの補正方法を個別に選択します。
- biosensor-image-subtraction.ijm: このスクリプトでは、背景とノイズの両方が、空白の画像、画像内のユーザーが選択した領域、固定値、または補正なしのいずれかの同じユーザーが選択した方法で処理されます。
- フィジーで、手順3.5で取得したマルチチャンネルZスタックイメージを開きます。目的のバイオセンサー解析スクリプトファイルを開きます。スクリプト エディタ(Script Editor)ウィンドウで実行(Run)をクリックして、スクリプトを実行します。 表示されるダイアログウィンドウで、必要な情報を入力します。
- 比率計算用の分子と分母の チャンネル番号 を選択します。 mtHyPer7の場合、分子は 488 nmで励起されたチャネル、分母は 405 nmで励起されたチャネルです。透過光画像が存在する場合はチャネル 番号 を選択し、存在しない場合は 0 を選択します。
- 次の4つのオプションから目的の背景減算方法を選択します。背景が比較的均一な場合は、[ 画像領域の選択] を選択すると、画像の背景レベルを直接測定できます。背景が圃場によって大きく異なる場合は、biosensor-image-subtraction.ijmスクリプトを使用して、ブランク画像を選択します(補正のために ブランク 画像を収集するには、無細胞視野で同一の取得条件でマルチチャンネルZスタックをキャプチャするか、無細胞増殖培地で作成したスライドからキャプチャします)。 固定値では 、以前に測定されたバックグラウンド値を入力できます。 「なし」を選択すると 、バックグラウンドは補正されませんが、測定の精度が低下する可能性があります。
- 目的のノイズ減算方法を選択します。ノイズ値は、バックグラウンドを差し引いてマスクされたチャンネル画像の下限しきい値として使用され、検出器の読み出しにおけるランダムな変動の影響を低減します。[ 画像領域の選択 ]または [固定値 ]を選択すると、以前に測定されたノイズレベルを入力できますが、イメージング条件が一定に保たれていれば、ノイズレベルが一定であるため、通常はうまく機能します。または、「 なし 」を選択し、値 1 を下限しきい値として使用すると、測定値のばらつきが大きくなる可能性があります。
- ミトコンドリアを正確かつ一貫して検出するためのしきい値アルゴリズムを選択します。 Otsu または MaxEntropy を推奨します。理想的には、実験のすべての画像に同じアルゴリズムを使用しますが、ミトコンドリアの正確な認識を確実にします。実験中に形態に変化がある場合は、別の閾値法を使用します。
- セルごとの関心領域 (ROI) の数を選択します。たとえば、 母芽の差を測定する場合は、 2を選択します。
- 測定値と比率の画像を保存する出力フォルダーを選択します。
- プロンプトに従って、背景とノイズを補正します。
- 領域の選択(該当する場合):背景またはノイズの測定に 画像領域を選択 を選択した場合は、プロンプトに従って、 長方形ROIツールを使用して背景領域(細胞または蛍光アーチファクトの外側)を描画します。領域を描画したら、[ OK] をクリックします。
- 固定値入力(該当する場合):バックグラウンドまたはノイズ測定に 固定値 を選択した場合は、プロンプトに従って、各蛍光チャンネルの バックグラウンド 値または ノイズ値 を入力します。
- 空白の参照画像(該当する場合):biosensor-image-subtraction.ijmスクリプトで、背景またはノイズの補正に空白の画像を選択した場合は、プロンプトに従って 空白 の 画像ファイルを選択します。
- 測定のためにROIをマークします。中期対数期の培養では、分析を出芽細胞に限定します。
- 明視野イメージに基づいて、個々の細胞または細胞内領域に対応する ROI を描画します。ROI内の閾値ミトコンドリアのみが測定されるため、ROIは細胞の輪郭と正確に一致する必要はありません。または、以前に保存したROIセットを開きます:ROIマネージャーで 詳細をクリックし、ROIファイルを選択します。
- 各 ROI の作成後に T キーを押して、選択した ROI を ROI マネージャーに追加します。ROIマネージャーで、[ すべて表示] をオンにして、マークされたセルを文書化します。追加された各領域は、ROIマネージャーリストに番号付きの項目として表示されます。1つの細胞(母細胞とつぼみなど)を複数のROIで解析する場合は、解析した細胞ごとに同じ順序でROIをマークします。
- 必要なすべての ROI が ROI マネージャーに追加されたら、[セルをマーク] ダイアログ ウィンドウで [OK] をクリックします。
- 測定表の形式を選択します。表示される [MultiMeasure] ダイアログ ウィンドウで、[Measure all slices] をオンにします。[スライスごとに 1 行] オプションをオンにして、目的の形式のテーブルを生成します。process_multiROI_tablesを使用します。[スライスごとに 1 行] オプションで作成されたテーブルを処理する R スクリプト。[結果の追加] はオンにしないでください。この手順を3回繰り返します(分子[488]、分母[405]、および比率[488/405]画像の測定用)。
- スクリプトは、手順4.1.2.6で選択したフォルダーに出力ファイルを保存します。
- 使用するスクリプトを選択します。各スクリプトを使用するためのプロトコルは似ています。相違点がある場合は、本文中に明記します。
- 各領域またはセルの加重平均比の計算
- 前のステップで得られた結果を使用して、式(2)を使用して各領域またはセルの加重平均比を計算します。「ピクセル単位」または「領域単位」の比率を計算します(詳細については、説明を参照してください)。
 (2)
(2)
注:面積密度と積分密度(IntDen)の値には、閾値ミトコンドリア内のピクセルのみが含まれます。この計算は、process_multiROI_tablesを使用して自動化できます。R スクリプトと R 統計ソフトウェア。
- 前のステップで得られた結果を使用して、式(2)を使用して各領域またはセルの加重平均比を計算します。「ピクセル単位」または「領域単位」の比率を計算します(詳細については、説明を参照してください)。
- カラー化された比率画像を生成します。色相 (色) の変化は強度の変化よりも人間の目には明白であるため、比率値をカラー スケールに変換して視覚的に解釈しやすくします。colorize_ratio_image.ijmスクリプトは、マスクされた比率の画像を色付けします。
- フィジーで、手順4.1.6で生成した比率Zスタックイメージを開きます。colorize_ratio_image.ijm スクリプト ファイルを開きます。スクリプト エディタ(Script Editor)ウィンドウで実行(Run)をクリックして、スクリプトを実行します。 表示されるダイアログウィンドウで、必要な情報を入力します。
- カラー化方法: 「 変調なし 」オプションでは、すべてのミトコンドリアピクセルが同じ明るさで表示されます。ただし、一部の画像では、暗いピクセルと明るいピクセルの両方が比率画像に寄与するため、ノイズが多く見える場合があります。この影響を軽減するには、「 強度変調 」オプションを使用します。
- 最小値と最大表示値: これらの値は、色付けされる比率値の範囲を制御します。実験で観測された平均の最小値と最大値に近い値を選択します(手順4.2.1で計算した加重平均比に基づく)。実験では、必ず同一の撮影条件ですべての画像を取得し、同じ最小値と最大値を持つすべての画像を表示してください。
- 投影モード:Zスタックは、ミトコンドリア集団全体を示す投影として表示されます。投影は、色付けの前に作成されます。最大強度投影(最大比と強度値を保持)には最大( Max )を、平均強度投影(平均)には平均( Average )を選択します。
- 出力フォルダ:カラー化された画像を保存するフォルダを選択します。
- [ 変調なし ] オプションを選択した場合は、配色 (ルックアップ テーブル;LUT)が表示されます。Fiji に組み込まれている Fire または Rainbow RGB LUT、または ImageJ の .lut 形式の任意の LUT を使用します (LUT ファイルからインポート)。 Rainbow Smooth40 LUTを推奨します( 補足ファイル2 とGitHubに含まれています)。
- スクリプトは、手順4.3.1.4で選択したフォルダーに出力ファイルを保存します。これらには、カラー化比画像(Color_RGB.tif)と、比値と画像色との対応を示すキャリブレーションバー付きカラー化比画像(Color_with_bar.tif)が含まれる。
- フィジーで、手順4.1.6で生成した比率Zスタックイメージを開きます。colorize_ratio_image.ijm スクリプト ファイルを開きます。スクリプト エディタ(Script Editor)ウィンドウで実行(Run)をクリックして、スクリプトを実行します。 表示されるダイアログウィンドウで、必要な情報を入力します。
5. 手動分析
注: このアプローチでは時間がかかりますが、前処理としきい値の設定に柔軟性を持たせることができます。
- 背景を修正します。
- フィジーでオプションを設定します。
- [ 分析] |測定値を設定します。表示されるダイアログ ウィンドウで、[Area]、[ Mean]、[StdDev]、[IntDen]、および [表示ラベル] のチェックボックスをオンにします。小数点以下の桁数を 3 に設定します。
- [ 編集] |オプション |入力/出力。表示されるダイアログウィンドウで、[ 行番号 を保存]と [列ヘッダーを保存]のチェックボックスをオンにします。
- 比計算の感度を上げるには、各蛍光チャンネルからバックグラウンドを差し引きます。背景が比較的均一な場合は、画像内の無細胞領域の平均強度を測定し、画像全体からこの値を減算します(手順5.1.2.1)。または、フィールド全体で背景が大きく異なる場合は、空白の画像を使用して修正します(手順5.1.2.2)。
- ユーザーが選択した領域を差し引くには、[画像] |カラー |チャンネルを分割し、後で必要になるため、すべてのチャンネル画像を開いたままにしておきます。蛍光チャンネルごとに、背景(セルの外側)にROIを描画し、[分析]をクリックします。計測、またはスタックの場合は、[イメージ |スタック |[スタックを測定]をクリックします。結果表に表示されるROIの平均値を確認します。[編集] |[なし] を選択し、次に [プロセス] |数学 |引き算。表示されるダイアログウィンドウで、測定された平均バックグラウンド値を最も近い整数に丸めて入力します。
注: 丸めにより、後の二項演算でのエラーが防止されます。 - データファイルから空白の画像を差し引くには、完全に無細胞の視野から、または無細胞増殖培地で調製したスライドから空白の画像を収集します。 [プロセス] |画像計算機。表示されるダイアログ ウィンドウで、操作を [減算] に設定し、Image1 と Image2 をそれぞれセル イメージと空白イメージに設定します。[ Create New Window and 32-bit Result] にチェックを入れます。
- ユーザーが選択した領域を差し引くには、[画像] |カラー |チャンネルを分割し、後で必要になるため、すべてのチャンネル画像を開いたままにしておきます。蛍光チャンネルごとに、背景(セルの外側)にROIを描画し、[分析]をクリックします。計測、またはスタックの場合は、[イメージ |スタック |[スタックを測定]をクリックします。結果表に表示されるROIの平均値を確認します。[編集] |[なし] を選択し、次に [プロセス] |数学 |引き算。表示されるダイアログウィンドウで、測定された平均バックグラウンド値を最も近い整数に丸めて入力します。
- フィジーでオプションを設定します。
- 分析をミトコンドリアに限定するには、セグメンテーションを実行します。各チャネルはバイオセンサーの状態に応じて強度が変化する可能性があるため、2つのチャネルの合計を使用して、ミトコンドリアの面積を一貫して定義します。
- 合計画像を作成するには、[ プロセス] |画像計算機。表示されるダイアログウィンドウで、操作を 「追加」に設定し、Image1 と Image2 を任意の順序で背景を差し引いた 2 つの蛍光チャンネルに設定します。[ 新しいウィンドウの作成 ] と [32 ビットの結果 ] をオンにして、合計画像が表示されるのを待ちます。
- 合計画像上のミトコンドリアを定義するしきい値を設定します。
- 画像をクリック |調整 |しきい値。表示される [Threshold ] ウィンドウで、[ Dark Background ] と [Stack Histogram] をオンにします。[ メソッド ] を目的のアルゴリズム ( Otsu や MaxEntropy など) に設定します。再現性を高めるために自動しきい値を使用しますが、適切な自動メソッドがない場合は、しきい値を手動で調整します。
注:理想的には、実験のすべての画像に同じアルゴリズムを使用する必要がありますが、実験中の形態の変化により、条件によっては異なるしきい値処理方法が必要になる場合があります。 - しきい値が満足のいく場合は、「 適用」をクリックします。表示されるダイアログウィンドウで、「 マスクに変換」を選択します。表示されるダイアログウィンドウで、[ 黒い背景 ]をオンにし、他のチェックボックスはオフのままにします。セグメンテーション精度を評価するために、結果のマスク イメージを保存します。
- 画像をクリック |調整 |しきい値。表示される [Threshold ] ウィンドウで、[ Dark Background ] と [Stack Histogram] をオンにします。[ メソッド ] を目的のアルゴリズム ( Otsu や MaxEntropy など) に設定します。再現性を高めるために自動しきい値を使用しますが、適切な自動メソッドがない場合は、しきい値を手動で調整します。
- マスク値を 0 と 255 から 0 と 1 にそれぞれ変換するには、[ プロセス |数学 |除算します。値を 255 に設定し、プロンプトが表示されたら、すべての画像を処理するオプションを選択します。
- バックグラウンド減算蛍光チャンネルにマスクを適用するには、[ Process |画像計算機。表示されるダイアログウィンドウで、操作を [乗算]に設定します。Image1 と Image2 をそれぞれ分子チャネルとマスクに設定します。[ 新しいウィンドウの作成 ] と [32 ビットの結果] をオンにします。分母チャネルでマスク乗算を繰り返します。
- 背景ピクセルを NaN ("not a number") に設定して、比率計算用にマスクされた各チャネルを準備します。
- マスクされた分子チャネルを選択し、[ 画像 |調整 |しきい値。 [しきい値 ] ウィンドウで [設定] をクリックし、表示されるダイアログ ウィンドウで、 最小 値を 計算されたノイズ レベル または 1 に設定し、 最大値はそのままにします。
- 「しきい値」ウィンドウで、「適用」をクリックします。次のダイアログボックスで、[Set to NaN] を選択します。マスクされた分母チャネルに対して繰り返します。
- 比率イメージを生成します。
- [プロセス] |画像計算機。表示されるダイアログウィンドウで、操作を分割に設定します。Image1 と Image2 をそれぞれ、背景から減算されたマスクされた分子と分母のチャネルに設定します。mtHyPer7の場合、分子は488 nmで励起された酸化型、分母は405 nmで励起された還元型です。したがって、比率が高いほど、H2O2が高いことを示します。
- [ Create New Window and 32-bit Result] にチェックを入れます。解析のために比率画像を保存します。
- 関心のある領域をマークして定量化します。各細胞または細胞内領域が選択され、ROI マネージャーに ROI として格納されます。ROIは、マスクされたミトコンドリア領域のみが測定されるため、細胞の輪郭と完全に一致する必要はありません。
- 透過光画像を使用してバイアスを防止し、個々の細胞(または細胞内領域)に対応するROIを作成します。中対数期の培養では、細胞分裂に活発に関与している芽を持つ酵母細胞に分析を限定します。各 ROI を作成した後 に T キーを押して、ROI マネージャーに追加します。[ すべて表示 ] をオンにして、マークされたセルを文書化します。
- 上記で作成した比率の画像をクリックし、ROI Managerで[その他...] |マルチメジャー。表示されるダイアログウィンドウで、[すべてのスライスを測定]をオンにします。[結果の追加] はオンにしないでください。[スライスごとに 1 行] オプションをオンにして、目的の形式のテーブルを生成します。process_multiROI_tables。R スクリプトは、R 統計ソフトウェアの [スライスごとに 1 行] オプションで作成されたテーブルを処理します。
- 結果を保存します。[ 結果 ] ウィンドウをクリックし、[ ファイル] |結果テーブルを .csv または .xls 形式で保存します。ファイル名をイメージ名と一致するように設定します。
- ROI を保存します。ROI マネージャーで、まず ROI が選択されていないことを確認します: [ 選択解除]、[ その他] |保存します。保存したROIを元の画像とともにフィジーで開き、測定値と画像を相互参照します。
- 前の手順で得られた結果と式 (3) を使用して、セルまたは領域ごとの加重平均比を計算します。「ピクセル単位」または「領域単位」の比率を計算します(詳細については、説明を参照してください)。
 (3)
(3)
注:面積と積分密度の値には、閾値ミトコンドリア内のピクセルのみが含まれます。この計算は、process_multiROI_tablesを使用して自動化できます。R 統計ソフトウェアの R スクリプト。 - カラー化された比率画像を生成します。
注:カラー化された画像は、すべてのミトコンドリアピクセルが同じ明るさで表示される非変調、または元の画像のピクセル強度を使用してカラー化された画像の強度を設定する強度変調にすることができます。- 変調されていないカラー化された画像を生成するには:
- 上記で生成した比率画像を開きます。画像をクリック |「複製 」をクリックして画像のコピーを生成し、元の画像を閉じます。
- 画像が Z スタックの場合は、スライスを 1 つ選択するか、Z 投影を生成してすべてのミトコンドリアを表示します。最大強度 (各 XY ピクセル座標の最大比率と強度値を保持) または平均強度投影法を使用します。
- 画像をクリック |ルックアップテーブルを選択し、LUTを目的の配色(例:Rainbow RGBまたはFire[ImageJでデフォルトで利用可能])に設定します。または、[ファイル] |LUT をインポートし、Rainbow Smooth40 (補足ファイル 2 と GitHub に含まれています) など、ImageJ の .lut 形式で任意の LUT を選択します。LUT の 0 値に暗い色が割り当てられていることを確認します。
- 表示のコントラストを設定するには、[ 画像] |調整 |明るさ/コントラスト。 「明るさ/コントラスト」ウィンドウで「 設定」をクリックし、表示されるダイアログ・ウィンドウで、「 最小 値」と 「最大 値」の表示値に必要な値を入力します。観察される色差を最大化するには、すべてのイメージで取得された最小値と最大値をほぼ設定します。実験のすべての画像を同じコントラスト レベルに設定します。
注: [適用] をクリックすると、ピクセル値が変更され、次の手順で正確なキャリブレーション バーが生成されなくなるため、クリックしないでください。 - カラーキャリブレーションバーを追加するには、[ 分析] |ツール |キャリブレーションバー。 表示されるダイアログウィンドウで、[ オーバーレイ ]オプションをオンにして、必要に応じて[ 画像|オーバーレイ |オーバーレイを削除します。
- 必要に応じて、[ 分析] |ツール |縮尺記号。表示されるダイアログウィンドウで、バーのサイズ、位置、色を設定します。[ オーバーレイ ]オプションをオンにすると、使用するLUTに関係なくバーの色が維持されます。
- 公開用のRGB画像を生成するには、[ 画像] |オーバーレイ |平坦化します。結果の画像を保存します。
注:この画像は、プレゼンテーションまたは公開のみを目的としています。強度値は変化するため、測定できません。また、バーは画像上で永続的に焼き付けられます。
- 強度変調画像を作成するには:
- 画像をクリック |「複製 」をクリックして画像のコピーを生成し、元の画像を閉じます。
- 画像が Z スタックの場合は、スライスを 1 つ選択するか、Z 投影を生成してすべてのミトコンドリアを表示します。
- 比率画像の表示コントラストを設定するには、[ 画像 |調整 |[明るさ/コントラスト] をクリックし、[明るさ/コントラスト] ウィンドウで [設定] をクリックします。表示されるダイアログ ウィンドウで、[ 最小 値] と [ 最大 値] の表示値に必要な値を入力します。観察される色差を最大化するには、これらをすべての画像で得られた最小値と最大値に近似値に設定し、実験のすべての画像を同じコントラスト レベルに設定します。[ 適用 ] をクリックして、ピクセル値を再スケールします。
- キャリブレーション バーを作成するには、この拡張画像を複製し、[ 分析] |ツール |キャリブレーションバー。画像とオーバーレイをRGB形式に変換するには、[ 画像|オーバーレイ |平坦化します。必要に応じて、このバーをステップ5.6.2.12で取得した強度変調RGB画像に貼り付けて、プレゼンテーションまたは公開します。
- [ ファイル] |新規 |画像....開いたダイアログウィンドウで、パラメータを次のように設定 します。 タイプ:RGB; 塗りつぶし:黒; 幅 と 高さ: 9画像の幅と高さ); スライス:1。
- 新しいスタックをHSB(色相、彩度、明るさ)画像スタックに変換するには、[ 画像 |種類 |HSB スタック。
- コントラストを調整した比率の画像をクリックして、[編集] |[すべて] を選択し、次に [編集] |[コピー] をクリックします。次に、HSB スタックをクリックし、最初のスライス (色相) を選択して、[編集] |貼り付けて比率値を転送します。
- HSB スタックのスライス 2 (彩度) を選択します。前景色を白に設定するには、[編集] |オプション |色。[編集] |[すべて] を選択し、次に [編集] |[塗りつぶし] をクリックし、開いたダイアログ ウィンドウで [いいえ] を選択して、現在のスライスのみを白で塗りつぶします。
- 生データ画像を開き、[ 画像] |カラー |チャンネルを分割します。
- Image Calculator を使用して 2 つの比率チャネルの平均を生成し、[プロセス] |画像計算機。表示されるダイアログ ウィンドウで、操作を [平均] に設定し、Image1 と Image2 をそれぞれ分子と分母の画像に設定します。[新しいウィンドウの作成] をオンにします。
- 上記で作成した平均画像をクリックして、[編集] |[すべて] を選択し、次に [編集] |[コピー] をクリックします。次に、HSB スタックをクリックし、3 番目のスライス (値) を選択して、[編集] |強度値を転送するには貼り付けます。
- HSBスタックをRGB色空間に変換するには、[ 画像] |種類 |RGBカラー。結果の画像を保存します。
- 変調されていないカラー化された画像を生成するには:
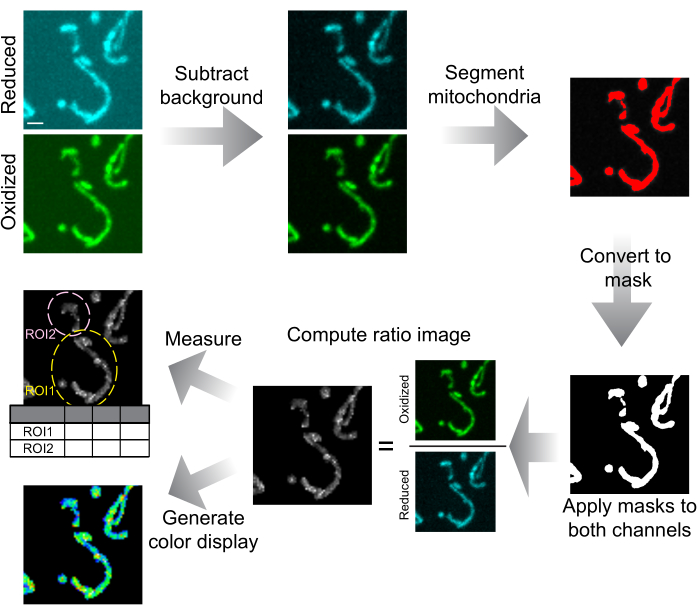
図6:画像解析とプレゼンテーションの概略図。回転する円盤の共焦点画像は、最初に背景が減算されます。ミトコンドリアは閾値によってセグメント化され、スライスごとにマスクに変換されます。これらのマスクは両方のチャンネルに適用され、マスクされた画像は比率画像の計算に使用されます。ROIは、細胞または細胞内領域におけるmtHyPer7比を測定するために描画されます。また、データ表示のためにカラー化された比率画像を生成することもできます。スケールバー = 1 μm。略語:ROI = 関心領域。この図の拡大版をご覧になるには、ここをクリックしてください。
結果
mtHyPer7がミトコンドリアH2O2を評価するのに適したプローブであることを確認するために、mtHyPer7の局在および酵母のミトコンドリアおよび細胞の健康に対するその影響を評価した。mtHyPer7の標的を評価するために、ミトコンドリアを重要なミトコンドリア特異的色素MitoTracker Redで染色し、mtHyPer7を発現する対照酵母細胞および酵母で染色しました。MitoTracker Red染色を用いて、ミトコンドリアを母芽軸に沿って整列し、芽の先端および芽の遠位にある母細胞の先端に蓄積する長い管状構造として分離した41。ミトコンドリアの形態は、対照細胞とmtHyPer7発現細胞で類似していた。さらに、mtHyPer7はMitoTrackerの赤色染色ミトコンドリアと共局在しました(図3A)。したがって、mtHyPer7は、正常なミトコンドリアの形態や分布に影響を与えることなく、効率的かつ定量的にミトコンドリアを標的としました。
次に、ミトコンドリアの細胞適応度および酸化ストレスに対する感受性に対するmtHyPer7の効果を評価するために、追加の検証実験を実施しました。リッチまたは合成グルコースベースの培地(それぞれYPDまたはSC)におけるmtHyPer7発現細胞の増殖速度は、形質転換されていない野生型細胞の増殖速度と同様です(図3B、D)。ミトコンドリアの酸化ストレスに対する可能性のある影響を評価するために、対照酵母とmtHyPer7発現酵母を、ミトコンドリアに蓄積し、オルガネラのスーパーオキシドレベルを上昇させる酸化還元活性小分子である低レベルのパラコートで処理しました24,27。mtHyPer7発現がミトコンドリアに酸化ストレスを誘発するか、ミトコンドリアを酸化ストレスから保護する場合、mtHyPer7発現細胞は、それぞれパラコート処理に対する感受性の増加または低下を示すはずです。低レベルのパラコートで処理すると、酵母の増殖速度が低下しました。さらに、パラコートの存在下での野生型細胞とmtHyPer7発現細胞の増殖速度は類似していました(図3C、E)。したがって、バイオセンサーの発現は、出芽酵母細胞に有意な細胞ストレスを生じさせず、ミトコンドリアの酸化ストレスに対する酵母の感受性を変化させませんでした。
mtHyPer7が出芽酵母におけるミトコンドリアH2O2の研究に適しているという証拠を考慮して、mtHyPer7が中対数期の野生型酵母におけるミトコンドリアH2O2および外部添加H2O2によって誘発されるミトコンドリアH2O2の変化を検出できるかどうかを試験した。H2O2滴定実験を行い、ミトコンドリアにおける平均酸化:還元(O/R)mtHyPer7比を測定した。
自動分析スクリプトは、いくつかの出力ファイルを生成しました。
比画像(ratio.tif):バックグラウンド補正、閾値化された488 nmおよび405 nmスタックの比からなるZスタック。このスタックは、フィジーで追加の処理なしで表示できます。ただし、表示前に、プロトコルステップ4.3または5.6で説明されているように、コントラストを強調したり、画像を色付けしたりすることをお勧めします。
マスク画像(mask.tif):解析に用いる閾値ミトコンドリア領域からなるZスタック。この画像は、しきい値処理の精度を評価するために使用する必要があります。
解析に使用される ROI (ROIs.zip): このファイルをフィジーで開くと、ソース画像とともに ROI が画像に重ね合わされ、結果テーブルとソース画像が相互参照されます。各 ROI は、セル番号と ROI 番号で名前が変更されます。
分子、分母、および比率画像の各スライスの閾値ミトコンドリアの面積、平均、および積分密度をそれぞれ含む測定テーブル(NumResults.csv、DenomResults.csv、Results.csv)。ミトコンドリアが存在しない、または焦点が合っていないスライスでは、NaNが記録されます。
バックグラウンドとノイズの補正、しきい値、および比率の計算に使用されるオプションを文書化したログファイル(Log.txt)。
mtHyPer7のO/R比は、H2O2濃度に対する用量依存的な反応を示し、外用H2O2で1〜2mMでプラトーに達した(図7)。驚くべきことに、HyPer7比は、0.1mMH2O2に曝露された細胞では、対照細胞よりも低かったが、この差は統計的に有意ではなかった。この現象の1つの説明は、低レベルのストレッサーへの曝露が抗酸化メカニズムなどのストレス応答を誘発し、プローブによって検出可能なROSの量を低下させるホルミシス応答である可能性があります。対照的に、ストレッサーのレベルが高いと、内部ストレス応答が圧倒され、HyPer7からの読み取り値が高くなる可能性があります。
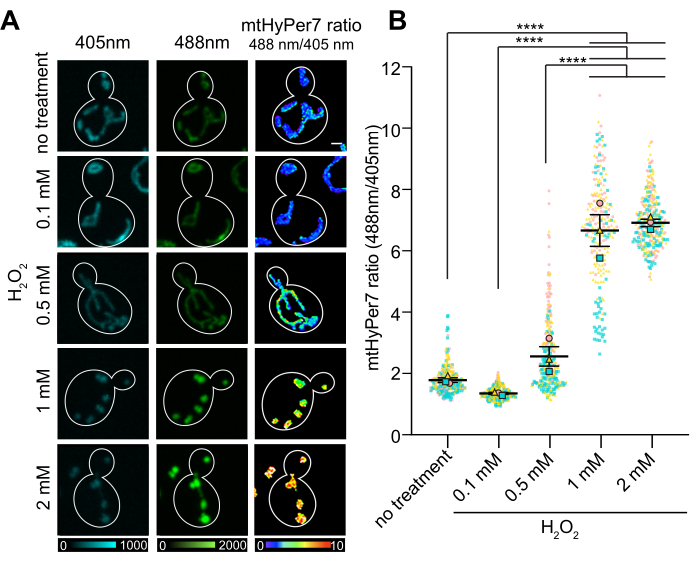
図7:外部添加H2O2に対するmtHyPer7の応答。 (a)異なる濃度のH2O2に曝露された中対数期の細胞における405nmおよび488nmの励起画像の最大投影およびmtHyPer7のレシオメトリック画像の平均強度投影。疑似色は、酸化:還元されたmtHyPer7比を示します(下部の目盛り)。スケールバー = 1 μm。セルのアウトラインは白で表示されます。n >条件ごとに 100 個のセル。(B)異なる濃度のH2O2で処理した出芽酵母細胞における酸化:減少した比率のmtHyPer7の定量。5 つの独立した試行の平均が、試行ごとに異なる形と色の記号で示されています。酸化:還元mtHyPer7の比率の平均±SEM:1.794±0.07627(無処理)、1.357±0.03295(0.1mM)、2.571±0.3186(0.5mM)、6.693±0.5194(1mM)、7.017±0.1197(2mM)。p < 0.0001 (テューキーの多重比較検定による一元配置分散分析)。 p 値は ****p < 0.0001 と表されます。この図の拡大版をご覧になるには、ここをクリックしてください。
最後に、これまでの研究により、より還元され、スーパーオキシドの含有量が少ないフィッティングミトコンドリアは、酵母娘細胞に優先的に受け継がれ4、細胞質カタラーゼは酵母娘細胞に輸送され、活性化されることが明らかになった42,43,44,45。これらの研究は、酵母細胞分裂中のミトコンドリアの非対称遺伝と、娘細胞の適応度と寿命、および母娘の年齢の非対称性におけるこのプロセスの役割を文書化しています。H2O2の違いが母細胞と芽の間に存在するかどうかを調べるために、mtHyPer7を芽と母細胞で測定した。酵母細胞内ではミトコンドリアH2O2の差が観察され、母細胞内のミトコンドリアと比較して、芽のミトコンドリアではH2O2バイオセンサーの読み出しの微妙ではあるが統計的に有意な減少が検出された(図8)。これらの知見は、蕾のミトコンドリアが酸化ストレスからよりよく保護されているというこれまでの知見と一致している。また、mtHyPer7は、出芽酵母における細胞内および細胞内分解能を有するミトコンドリアH2O2の定量的読み出しを提供できるという文書も提供している。
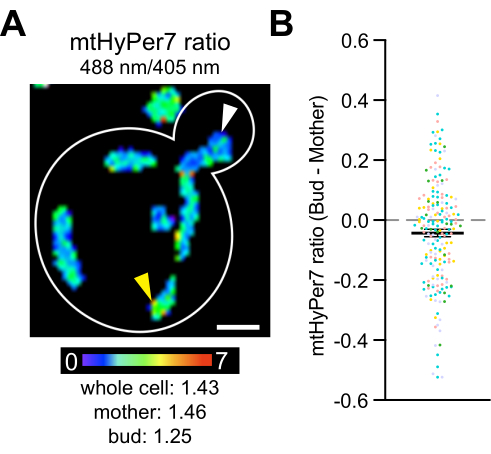
図8:ミトコンドリアH2O2レベルは、娘細胞においてより低い。 (A)代表細胞におけるmtHyPer7のレシオメトリック画像の最大投影。疑似色は、酸化:還元されたmtHyPer7比を示します(下部の目盛り)。比率の細胞内差は明らかです(矢印)。スケールバー = 1 μm。セルの輪郭:白。(B)芽と母細胞のmtHyPer7比の差。個々の細胞ごとに、芽の比率値から母比の値を減算し、点としてプロットしました。n = 193個の細胞を5つの独立した実験からプールし、実験ごとに異なる色の記号で示しました。芽細胞と母細胞のmtHyPer7比の差の平均±SEM:-0.04297±0.01266。p = 0.0008 (対応のあるt検定) この図の拡大版をご覧になるには、ここをクリックしてください。
補足表S1:本研究で用いた菌株。 使用した酵母菌株のリスト。 このファイルをダウンロードするには、ここをクリックしてください。
補足表S2:この研究で使用したプラスミド。 使用したプラスミドのリスト。 このファイルをダウンロードするには、ここをクリックしてください。
補足表S3:本研究で使用したプライマー。 使用したプライマーのリスト。 このファイルをダウンロードするには、ここをクリックしてください。
補足ファイル1: biosensorのプラスミッド構造のためのプロトコル。このファイルをダウンロードするには、ここをクリックしてください。
補足ファイル 2: 自動分析用のスクリプト。 スクリプトごとに、サンプル入力ファイルと出力ファイルが提供されます。 このファイルをダウンロードするには、ここをクリックしてください。
ディスカッション
このプロトコルでは、生きている出芽酵母細胞のミトコンドリアH2O 2を評価するバイオセンサーとしてmtHyPer7を使用するための方法が記述されている。このバイオセンサーは、CRISPRベースの方法を用いて構築され、選択可能なマーカーを使用せずに、酵母ゲノムの保存された無遺伝子領域に導入されます。プラスミド由来のバイオセンサーと比較して、統合されたバイオセンサーはすべての細胞で一貫したレベルで発現するため、より信頼性の高い定量結果が得られます。mtHyPer7発現細胞の作製に選択可能なマーカーを使用しないため、より広い範囲の株バックグラウンドの使用が可能で、バイオセンサー発現細胞の遺伝子改変が容易になります。mtHyPer7タンパク質は、ミトコンドリアの形態、機能、分布、または細胞増殖速度に顕著な影響を与えることなく、ミトコンドリアを正しく標的としています。mtHyPer7は、外部から添加されたH2O2に対する用量依存的な応答を示す。さらに、mtHyPer7は、ミトコンドリア品質の不均一性を細胞内分解能で報告することができます。最後に、ミトコンドリアを標的としたバイオセンサーのイメージングに広視野顕微鏡とは対照的に、スピニングディスク共焦点顕微鏡を使用すると、蛍光色素への光退色が少なくなり、細胞内の違いを分析するための高解像度画像が得られます。
制限事項と代替アプローチ
この方法は、カバーガラスの下で細胞が乾燥してしまうため、10分以上細胞をイメージングするのには適していません。長期間のイメージングには、寒天パッド法46 を使用するか、またはSC培地で満たされたガラス底培養皿に細胞を固定化するのがよい。
バイオセンサーの選択は、実験条件下でのターゲットの濃度によって導かれるべきです。HyPer7 の感度が高すぎる場合は、HyPer3 や HyPerRed47,48 など、別の HyPer バージョンをお勧めします。ただし、他のHyPerプローブはよりpHに敏感であることに注意する必要があります。より高い感度を得るには、ペルオキシレドキシンベースのroGFP(roGFP2Tsa2ΔCR)がより適切である可能性があります27。
H2O2センサの酸化定常状態は、酸化速度と還元速度の両方に結びついています。バイオセンサーの酸化速度は、主にH2O2によって引き起こされるが、還元速度は、細胞および細胞小器官において活性化する抗酸化還元システムに依存する。HyPer7は、酵母細胞質のチオレドキシン系によって主に還元され、その還元はroGFP2Tsa2ΔCRの還元よりも速いことが示されています27。したがって、H2O2バイオセンサーの測定値を解釈する際には、プローブのさまざまな還元メカニズムおよび応答ダイナミクスを考慮に入れる必要があります。特に、バイオセンサの読み出しからH2O2レベルを推測するには、還元システムが実験中に一定の容量を維持すると仮定しなければならない。 ここで説明するスクリプトの代替として、酸化還元センサ49の分析のために、他の様々なソフトウェアが自由に利用可能になっている。
重要な手順
どのようなバイオセンサーでも、バイオセンサー自体が測定対象のプロセスに影響を与えないことを実証することが重要です。したがって、各実験条件下での菌株の増殖とミトコンドリア形態の比較は重要です。ここでは、ミトコンドリアの形態をMitoTracker Redを用いて評価し、膜電位依存的にミトコンドリアを染色します。しかし、形質転換されていない細胞とバイオセンサーで形質転換された細胞のミトコンドリアの比較は、膜電位を感知するミトコンドリアバイタル色素であるテトラメチルローダミンメチルエステル(TMRM)、または膜電位とは無関係にミトコンドリアを染色するMitoTracker Greenで染色することで行うことができます。有害な影響が疑われる場合は、発現レベルを下げるか、統合部位を変更すると役立つ場合があります。
プローブの線量反応挙動とイメージング技術のS/N比を検証することも、堅牢な結果を得るために不可欠です。グループ内の変動性がグループ間の変動性を超えると、差の検出が困難になります。グループ内変動は、真の母集団変動、または検出プロセスのノイズに起因する可能性があります。S/N比を上げるための重要なステップは、画像取得(ピクセル値の範囲とノイズ)、バックグラウンド減算、およびしきい値処理です。
また、計算ステップ中にノイズの影響を減らすこともできます。最も簡単なアプローチは、比率画像測定値(Results.csv)から加重平均強度を計算することであり、各ピクセルは励起効率間の局所的な比率を表します。これにより、「ピクセル単位」の比率が生成されます。ただし、イメージ信号:雑音比が低い場合は、分子チャネルと分母チャネルの両方でROIの加重平均強度を計算し、これら2つの加重平均間の比(「領域方向」比)を計算することで、よりロバストな結果を得ることができます。
閾値処理方法を選択するには、Fiji コマンドの Image |調整 |自動しきい値 を使用すると、すべての組み込みフィジーメソッドを自動的に試すことができます。セグメンテーション (しきい値処理) を評価するには、[ 編集] |選考 |選択範囲を作成し、( T キーを押して) ROI マネージャーに追加し、生の画像ファイルでアクティブ化します。ミトコンドリアが適切に検出されない場合は、別のセグメンテーション方法を試す必要があります。
画像を比較する際には、同一の撮影条件ですべての画像を取得し、すべての画像を同一のコントラスト強調で表示することが不可欠です。
ミトコンドリアの動きは、イメージング条件を最適化する際に考慮する必要があります。ミトコンドリアが405 nmと488 nmの励起の間で大きく移動する場合、比率画像は正確ではありません。露光時間を<500msに保ち、利用可能な最速の方法(トリガーパルスや音響光学チューナブルフィルターなど)で励起を変更することをお勧めします。Zスタックをキャプチャする場合、次のZステップに進む前に、各Zステップで両方の加振を実行する必要があります。
結果を表示する場合、色相(色)の変化は、強度の変化よりも人間の目には明らかです。そのため、比率の値は、視覚的に解釈しやすいようにカラースケールに変換されます。カラー化された画像には、すべてのミトコンドリアピクセルが同じ明るさで表示される非変調と、元の画像のピクセル強度を使用してカラー化された画像の強度を設定する強度変調があります。
変更とトラブルシューティング
パラコートによる挑戦によるミトコンドリア機能の確認の代替として、細胞を複製播種するか、発酵性および非発酵性の炭素源に接種することができます。
バックグラウンド減算の場合、ローリングボール減算 ( [プロセス] |背景を減算...)また、照明の不均一性を除去するためにも使用できます。セルの存在によって減算される背景が変わらないことを確認する必要があります( [背景の作成 ]オプションをオンにして結果を調べます)。
要約すると、mtHyPer7プローブは、生細胞における酵母ミトコンドリアの形態学的および機能的状態を関連付けるための一貫した低侵襲な方法を提供し、遺伝的に扱いやすく、簡単にアクセスできるモデルシステムにおける重要な細胞ストレッサーおよびシグナル伝達分子の研究を可能にします。
開示事項
著者らは、利益相反がないことを宣言します。
謝辞
著者らは、Katherine Filpo Lopez氏の専門的な技術支援に感謝します。この研究は、米国国立衛生研究所(NIH)(GM122589およびAG051047)からLPへの助成金によって支援されました。
これらの研究は、NIH/NCIがんセンター支援助成金P30CA013696から一部資金提供を受け、コロンビア大学ハーバート・アーヴィング総合がんセンターの共焦点および特殊顕微鏡共有リソースを使用した。
資料
| Name | Company | Catalog Number | Comments |
| 100x/1.45 Plan Apo Lambda objective lens | Nikon | MRD01905 | |
| Adenine sulfate | Sigma-Aldrich | A9126 | |
| Bacto Agar | BD Difco | DF0145170 | |
| Bacto Peptone | BD Difco | DF0118170 | |
| Bacto Tryptone | BD Difco | DF211705 | |
| Bacto Yeast Extract | BD Difco | DF0127179 | |
| BamHI | New England Biolabs | R0136S | |
| BglII | New England Biolabs | R0144S | |
| Carbenicilin | Sigma-Aldrich | C1389 | |
| Carl Zeiss Immersol Immersion Oil | Carl Zeiss | 444960 | |
| Dextrose (D-(+)-Glucose) | Sigma-Aldrich | G8270 | |
| E. cloni 10G chemical competent cell | Bioserch Technologies | 60108 | |
| FIJI | NIH | Schindelin et al 2012 | |
| G418 (Geneticin) | Sigma-Aldrich | A1720 | |
| GFP emission filter | Chroma | 525/50 | |
| Gibson assembly | New England Biolabs | E2611 | |
| Graphpad Prism 7 | GraphPad | https://www.graphpad.com/scientific-software/prism/ | |
| H2O2 (stable) | Sigma-Aldrich | H1009 | |
| HO-pGPD-mito-roGFP-KanMX6-HO | Pon Lab | JYE057/EP41 | Liao et al 20201 |
| Incubator Shaker | New Brunswick Scientific | E24 | |
| KAPA HiFi PCR kit | Roche Sequencing and Life Science, Kapa Biosystems, Wilmington, MA | KK1006 | |
| L-arginine hydrochloride | Sigma-Aldrich | A8094 | |
| laser | Agilent | 405 and 488 nm | |
| L-histidine hydrochloride | Sigma-Aldrich | H5659 | |
| L-leucine | Sigma-Aldrich | L8912 | |
| L-lysine hydrochloride | Sigma-Aldrich | L8662 | |
| L-methionine | Sigma-Aldrich | M9625 | |
| L-phenylalanine | Sigma-Aldrich | P5482 | |
| L-tryptophan | Sigma-Aldrich | T8941 | |
| L-tyrosine | Sigma-Aldrich | T8566 | |
| mHyPer7 plasmid | This study | JYE116 | |
| Microscope coverslips | ThermoScientific | 3406 | #1.5 (170 µm thickness) |
| Microscope slides | ThermoScientific | 3050 | |
| MitoTracker Red CM-H2Xros | ThermoFisherScientific | M7513 | |
| NaCl | Sigma-Aldrich | S9888 | |
| NEBuilder HiFi Assembly Master Mix | New England Biolabs | E2621 | |
| Nikon Elements | Nikon | Microscope acquisition software | |
| Nikon Ti Eclipse inverted microscope | Nikon | ||
| Paraquat (Methyl viologen dichloride hydrate) | Sigma-Aldrich | Cat. 856177 | |
| RStudio | Posit.co | Free desktop version | |
| Spectrophotometer | Beckman | BU530 | |
| Stagetop incubator | Tokai Hit | INU | |
| Uracil | Sigma-Aldrich | U1128 | |
| Yeast nitrogen base (YNB) containing ammonium sulfate without amino acids | BD Difco | DF0919073 | |
| YN2_1_LT58_X2site | Addgene | 177705 | Pianale et al 2021 |
| Zyla 4.2 sCMOS camera | Andor |
参考文献
- vander Bliek, A. M., Sedensky, M. M., Morgan, P. G. Cell biology of the mitochondrion. Genetics. 207 (3), 843-871 (2017).
- McBride, H. M., Neuspiel, M., Wasiak, S. Mitochondria: more than just a powerhouse. Current Biology. 16 (14), 551-560 (2006).
- Shi, R., Hou, W., Wang, Z. -. Q., Xu, X. Biogenesis of iron-sulfur clusters and their role in DNA metabolism. Frontiers in Cell and Developmental Biology. 9, 735678 (2021).
- McFaline-Figueroa, J. R., et al. Mitochondrial quality control during inheritance is associated with lifespan and mother-daughter age asymmetry in budding yeast. Aging Cell. 10 (5), 885-895 (2011).
- Higuchi-Sanabria, R., et al. Mitochondrial anchorage and fusion contribute to mitochondrial inheritance and quality control in the budding yeast Saccharomyces cerevisiae. Molecular Biology of the Cell. 27 (5), 776-787 (2016).
- Higuchi-Sanabria, R., et al. Role of asymmetric cell division in lifespan control in Saccharomyces cerevisiae. FEMS Yeast Research. 14 (8), 1133-1146 (2014).
- Lam, Y. T., Aung-Htut, M. T., Lim, Y. L., Yang, H., Dawes, I. W. Changes in reactive oxygen species begin early during replicative aging of Saccharomyces cerevisiae cells. Free Radical Biology & Medicine. 50 (8), 963-970 (2011).
- Laun, P., et al. Aged mother cells of Saccharomyces cerevisiae show markers of oxidative stress and apoptosis. Molecular Microbiology. 39 (5), 1166-1173 (2001).
- Doudican, N. A., Song, B., Shadel, G. S., Doetsch, P. W. Oxidative DNA damage causes mitochondrial genomic instability in Saccharomyces cerevisiae. Molecular and Cellular Biology. 25 (12), 5196-5204 (2005).
- Roca-Portoles, A., Tait, S. W. G. Mitochondrial quality control: from molecule to organelle. Cellular and Molecular Life Sciences. 78 (8), 3853-3866 (2021).
- Sies, H., Berndt, C., Jones, D. P. Oxidative stress. Annual Review of Biochemistry. 86, 715-748 (2017).
- Sies, H., Jones, D. P. Reactive oxygen species (ROS) as pleiotropic physiological signalling agents. Nature Reviews Molecular Cell Biology. 21 (7), 363-383 (2020).
- Imlay, J. A., Fridovich, I. Assay of metabolic superoxide production in Escherichia coli. The Journal of Biological Chemistry. 266 (11), 6957-6965 (1991).
- Fridovich, I. Mitochondria: are they the seat of senescence. Aging Cell. 3 (1), 13-16 (2004).
- Quinlan, C. L., Perevoshchikova, I. V., Hey-Mogensen, M., Orr, A. L., Brand, M. D. Sites of reactive oxygen species generation by mitochondria oxidizing different substrates. Redox Biology. 1 (1), 304-312 (2013).
- Griendling, K. K., Minieri, C. A., Ollerenshaw, J. D., Alexander, R. W. Angiotensin II stimulates NADH and NADPH oxidase activity in cultured vascular smooth muscle cells. Circulation Research. 74 (6), 1141-1148 (1994).
- Griendling, K. K., Sorescu, D., Ushio-Fukai, M. NAD(P)H oxidase: role in cardiovascular biology and disease. Circulation Research. 86 (5), 494-501 (2000).
- Edmondson, D. E., Binda, C., Wang, J., Upadhyay, A. K., Mattevi, A. Molecular and mechanistic properties of the membrane-bound mitochondrial monoamine oxidases. Biochemistry. 48 (20), 4220-4230 (2009).
- Ramsay, R. R., Singer, T. P. The kinetic mechanisms of monoamine oxidases A and B. Biochemical Society Transactions. 19 (1), 219-223 (1991).
- Ramsay, R. R. Kinetic mechanism of monoamine oxidase A. Biochemistry. 30 (18), 4624-4629 (1991).
- Handy, D. E., Loscalzo, J. Redox regulation of mitochondrial function. Antioxidants & Redox Signaling. 16 (11), 1323-1367 (2012).
- Wood, Z. A., Schröder, E., Robin Harris, J., Poole, L. B. Structure, mechanism and regulation of peroxiredoxins. Trends in Biochemical Sciences. 28 (1), 32-40 (2003).
- Slade, L., et al. Examination of the superoxide/hydrogen peroxide forming and quenching potential of mouse liver mitochondria. Biochimica et Biophysica Acta. General Subjects. 1861 (8), 1960-1969 (2017).
- Pak, V. V., et al. Ultrasensitive genetically encoded indicator for hydrogen peroxide identifies roles for the oxidant in cell migration and mitochondrial function. Cell Metabolism. 31 (3), 642-653 (2020).
- Topell, S., Hennecke, J., Glockshuber, R. Circularly permuted variants of the green fluorescent protein. FEBS Letters. 457 (2), 283-289 (1999).
- Belousov, V. V., et al. Genetically encoded fluorescent indicator for intracellular hydrogen peroxide. Nature Methods. 3 (4), 281-286 (2006).
- Kritsiligkou, P., Shen, T. K., Dick, T. P. A comparison of Prx- and OxyR-based H2O2 probes expressed in S. cerevisiae. The Journal of Biological Chemistry. 297 (1), 100866 (2021).
- Baird, G. S., Zacharias, D. A., Tsien, R. Y. Circular permutation and receptor insertion within green fluorescent proteins. Proceedings of the National Academy of Sciences. 96 (20), 11241-11246 (1999).
- Abedi, M. R., Caponigro, G., Kamb, A. Green fluorescent protein as a scaffold for intracellular presentation of peptides. Nucleic Acids Research. 26 (2), 623-630 (1998).
- Onukwufor, J. O., et al. A reversible mitochondrial complex I thiol switch mediates hypoxic avoidance behavior in C. elegans. Nature Communications. 13 (1), 2403 (2022).
- Vega, M., et al. Antagonistic effects of mitochondrial matrix and intermembrane space proteases on yeast aging. BMC Biology. 20 (1), 160 (2022).
- Torello Pianale, L., Rugbjerg, P., Olsson, L. Real-time monitoring of the yeast intracellular state during bioprocesses with a toolbox of biosensors. Frontiers in Microbiology. 12, 802169 (2022).
- Imani, M., Mohajeri, N., Rastegar, M., Zarghami, N. Recent advances in FRET-based biosensors for biomedical applications. Analytical Biochemistry. 630, 114323 (2021).
- Zadran, S., et al. Fluorescence resonance energy transfer (FRET)-based biosensors: visualizing cellular dynamics and bioenergetics. Applied Microbiology and Biotechnology. 96 (4), 895-902 (2012).
- Gietz, R. D., Woods, R. A. Transformation of yeast by lithium acetate/single-stranded carrier DNA/polyethylene glycol method. Methods in Enzymology. 350, 87-96 (2002).
- Liao, P. -. C., Wolken, D. M. A., Serrano, E., Srivastava, P., Pon, L. A. Mitochondria-associated degradation pathway (MAD) function beyond the outer membrane. Cell Reports. 32 (2), 107902 (2020).
- Higuchi-Sanabria, R., Swayne, T. C., Boldogh, I. R., Pon, L. A. Live-cell imaging of mitochondria and the actin cytoskeleton in budding yeast. Methods in Molecular Biology. 1365, 25-62 (2016).
- Liao, P. -. C., Yang, E. J., Pon, L. A. Live-cell imaging of mitochondrial redox state in yeast cells. STAR Protocols. 1 (3), 100160 (2020).
- Schindelin, J., et al. Fiji: an open-source platform for biological-image analysis. Nature Methods. 9 (7), 676-682 (2012).
- Collins, T. J. ImageJ for microscopy. BioTechniques. 43, 25-30 (2007).
- Chazotte, B. Labeling mitochondria with MitoTracker dyes. Cold Spring Harbor Protocols. 2011 (8), 990-992 (2011).
- Aguilaniu, H., Gustafsson, L., Rigoulet, M., Nyström, T. Asymmetric inheritance of oxidatively damaged proteins during cytokinesis. Science. 299 (5613), 1751-1753 (2003).
- Erjavec, N., Larsson, L., Grantham, J., Nyström, T. Accelerated aging and failure to segregate damaged proteins in Sir2 mutants can be suppressed by overproducing the protein aggregation-remodeling factor Hsp104p. Genes & Development. 21 (19), 2410-2421 (2007).
- Erjavec, N., Cvijovic, M., Klipp, E., Nyström, T. Selective benefits of damage partitioning in unicellular systems and its effects on aging. Proceedings of the National Academy of Sciences. 105 (48), 18764-18769 (2008).
- Erjavec, N., Nyström, T. Sir2p-dependent protein segregation gives rise to a superior reactive oxygen species management in the progeny of Saccharomyces cerevisiae. Proceedings of the National Academy of Sciences. 104 (26), 10877-10881 (2007).
- Davidson, R., Liu, Y., Gerien, K. S., Wu, J. Q. Real-time visualization and quantification of contractile ring proteins in single living cells. Methods in Molecular Biology. 1369, 9-23 (2016).
- Bilan, D. S., et al. HyPer-3: a genetically encoded H2O2 probe with improved performance for ratiometric and fluorescence lifetime imaging. ACS Chemical Biology. 8 (3), 535-542 (2013).
- Ermakova, Y. G., et al. Red fluorescent genetically encoded indicator for intracellular hydrogen peroxide. Nature Communications. 5 (1), 5222 (2014).
- Fricker, M. D. Quantitative redox imaging software. Antioxidants & Redox Signaling. 24 (13), 752-762 (2016).
- Yang, E. J., Pernice, W. M., Pon, L. A. A role for cell polarity in lifespan and mitochondrial quality control in the budding yeast Saccharomyces cerevisiae. iSCIENCE. 25 (3), 103957 (2022).
転載および許可
このJoVE論文のテキスト又は図を再利用するための許可を申請します
許可を申請This article has been published
Video Coming Soon
Copyright © 2023 MyJoVE Corporation. All rights reserved