Method Article
薬効研究のためのシャーガス病モデルマウスのIn vivo生物発光イメージングの謎解き
要約
ここで提供されるプロトコルは、 Trypanosoma cruzi 感染の生物発光モデルで薬効研究を実施するための詳細な手順を、データの取得、分析、および解釈に焦点を当てて説明しています。技術的な問題を最小限に抑えるためのトラブルシューティングと品質管理手順も提供されます。
要約
シャーガス病、リーシュマニア症、アフリカトリパノソーマ症などのヒト原虫病の公衆衛生への影響を抑制し、減少させるためには、新薬やワクチンの開発を加速する必要があります。しかし、このプロセスには、寄生虫の生物学的な問題や疾患の病因が非常に複雑であること、顧みられない熱帯病によくあるように、研究開発のための資金が比較的限られていることなど、困難が伴います。したがって、これらの疾患の研究を進めるためには、感染や疾患の主要な特徴を十分に再現し、リソースを合理的に利用できる in vitro および in vivo 研究モデルが不可欠です。その一例がシャーガス病の in vivo bioluminescence imaging(BLI)マウスモデルで、ルシフェラーゼを発現する Trypanosoma cruzi 寄生虫が生成する長波長光を高感度に検出することができます。この手法が in vivo での薬効研究の標準的なアプローチになっているにもかかわらず、適切なBLI機器がすぐに利用できる場合でも、機器の取り扱いや品質管理手順の適用に関する適切な実践的なトレーニングが不足しているため、研究グループは依然としてその実装に苦労する可能性があります。このシナリオを考慮して、このプロトコルは、シャーガス病や他の感染症マウスモデルのいずれかについて、BLIの経験がほとんどまたはまったくない研究グループでのプロトコルの実施を容易にする詳細とともに、実験の計画からデータ取得および分析までのガイドとなることを目的としています。
概要
シャーガス病はラテンアメリカで流行しており、世界中で約700万人が罹患しています1。毎年、50,000人以上が死亡し、約70億ドルの経済的損失が、この病気の障害性に起因しています2。シャーガス病は、原虫のTrypanosoma cruziという原虫によって引き起こされ、哺乳類(野生および家畜)やトリアトミンベクター(半翅目、Reduviidae)3に感染するヘテロキセン性血液鞭毛虫寄生虫で、ベクター感染が確立されています。その他の重要な感染経路には、輸血、臓器移植、経口(感染したトリアトミンで汚染された食物の摂取による)4、先天性感染などがあります。非媒介性の伝播経路は、シャーガス病が非流行地域に広がる一因となっています3,5。
シャーガス病は、2つの臨床段階に現れます。急性期は、ほとんどの場合、無症候性です。症候性感染症は通常、発熱、疲労、筋肉痛、リンパ節腫脹、脾腫、肝腫大などの非特異的な徴候と関連しています。急性期は、しばしば特許寄生虫症および寄生虫の全身循環と関連しています。診断された症例の最大10%、特に経口感染症の症例で死亡する可能性があります6。慢性期は、症状が長期間存在しないことを特徴としています。時間が経つにつれて、数十年前に感染した患者の約3分の1は、通常は線維症および心筋の炎症、および/または主に巨大食道および/または巨大結腸症候群の発症に関連する胃腸障害を伴う心臓症状を示します3,5,6。
シャーガス病の病因治療は、ベンズニダゾールとニフルチモックスの2つの薬のみで構成されています。これらの駆虫剤は50年以上にわたって利用可能であり、かなりの毒性と限られた有効性を持っています5,7,8。そのため、シャーガス病患者に対して、より安全で、より効果的な新しい治療法の開発が急務となっています。
より高度で正確な技術により、シャーガス病の新たな治療法の探索を進めることを可能にする古い疑問に対する答えを得ることが可能になりました。この意味で、科学界は、感染の経過と薬効の評価に関するin vivo研究のために遺伝子組み換え寄生虫から大きな恩恵を受けています9,10,11,12。生物発光イメージング(BLI)システムに基づく縦断的アッセイにより、治療レジメン中および治療レジメン後の有効性評価が可能になり、トリパノサイド活性を有する化合物の同定につながります10,13。BLI法は、遺伝子組み換えホタルルシフェラーゼ12を構成的に発現する遺伝子組み換えT. cruzi CL Brener Luc::Neon系統11によって生成される光の定量を通じて、循環中または組織および器官内の両方で寄生虫負荷を直接測定する。
それにもかかわらず、シャーガス病BLI動物モデルおよび薬効研究が確立されてから約10年が経過した現在、この手法を支配している研究グループはごくわずかです。この事実は、適切なイメージング機器へのアクセスが減少しているだけでなく、トレーニングが不足していることや、構造化された詳細なプロトコルが利用できないためです。この方法は、顕微鏡検査による寄生虫血症の評価、血清学、または寄生虫DNA検出のためのqPCRによる臓器/組織感染評価に依存する他のアプローチに比べて、マウスの健康状態を改善し、in vivoでより堅牢で統合されたデータを生成する可能性により動物の使用を減らすことができるため、いくつかの利点があります。さらに、この方法は、薬物治療10,12後の内臓臓器の寄生虫病巣の容易な検出を可能にするため、おそらくより感度が高い。したがって、このプロトコルは、寄生虫学およびその他の感染症に関する研究グループが、技術的な手順を詳細に説明することにより、この方法論を研究室で確立するように導くことを目的としています。ここでは、Drugs for Neglected Diseases initiative(DNDi)がコーディネートする創薬活動の一環として、ラテンアメリカで初めてのシャーガス病BLIモデルをブラジルで実施した経験を共有します。
プロトコル
この議定書に記載されているすべての手順は、サンパウロ大学のInstituto de Ciências Biomédicasの動物倫理委員会によって事前に設定されたガイドライン14 に従って提出、承認、および実施されました:プロトコルCEUA ICB/USP no 5787250522。
1. ソリューション
注:10 mL / kg(マウスの重量20 gの場合は200 μL)15,16の予め調整された投与容量を考慮してください。例えば、150 mg/mLの動物用投与量に達するには、15 mg/mLの作業溶液を調製します。
- ヒドロキシプロピルメチルセルロース懸濁液(HPMC-SV)
注:必要な試薬は、0.5%(w / v)ヒドロキシプロピルメチルセルロース(HPMC)、0.4%(v / v)Tween 80、および0.5%(v / v)ベンジルアルコールです。- ビヒクル溶液200 mLの場合、HPMC1 gを秤量し、64 mLの熱い超純水に溶解します。2分間攪拌します。
- 氷冷した超純水120mLを加え、1時間撹拌する。ベンジルアルコール1mLを加えます。
- 次に、リバースピペッティング技術を使用して0.8 mLのTween 80を加え、溶液が透明になるまで攪拌を続けます。
- 最終容量の200mLに溶液を調整します。HPMC-SVは冷蔵(4°C)で最大3か月間保管してください。
- ベンズニダゾール
- 次のように、必要な化合物溶液の量を計算します。
化合物溶液の量=(各日の投与量×日数×治療するマウスの数×各マウスの投与量)+30%追加。 - 必要な用量を考慮して、必要な量のベンズニダゾール(BZ)を秤量します。.根治的治療として、100 mg/kg を 1 日 1 回 10 日間経口投与すると、CD 慢性モデル17 で 100% 治癒します。
- 所望の最終容量を考慮して、5%(v / v)DMSOの濃度に達するための適切な量を計算し、BZをきれいなDMSOに完全に溶解します。
- 車両の適切な容量をガラス管に加えて、95%(v / v)HPMC-SVの濃度に到達します。DMSOに溶解したBZをHPMC-SVの入ったガラス管に移します。懸濁液を精力的に均質化し、4°Cで保存します。
例:BZ製剤の最終容量 = 10 mL(ステップ1.2.1)
BZの量= 100 mg(ステップ1.2.2)
5% DMSO = 0.5 mL(ステップ 1.2.3)および 95% HPMC-SV = 9.5 mL(ステップ 1.2.4) - 各薬物投与の前に、製剤を超音波水浴に37°Cで5分間入れ、動物投与前に精力的に均質化します。
- 次のように、必要な化合物溶液の量を計算します。
- シクロホスファミド
- 必要な量のシクロホスファミドを超純水に溶解して、12.5 mg/mLの溶液にします。
- 溶液をろ過して滅菌し、4°Cで保存します。
- ギムザステイン
- 0.6 mgのGemsa粉末試薬を50 mLのメタノールに溶解します。グリセロール25mLを加えて混ぜます。濾紙と漏斗を使用して沈殿物を取り除きます。ストック溶液は、光から保護した室温(RT)で保管してください。
- 10 mLのGimsa溶液を90 mLのMix-Phosphate Buffer(20.5 M Na2HPO4、65.4 M KH2PO4 、pH 7.2)で希釈して、作業溶液を調製します。
2. トリパノソーマcruzi 培養
- 生物学的安全キャビネット(BSC)で、4 x 10⁶ エピマスティゴート/mL の T. cruzi CL Brener Luc::Neon11 を LIT 培地 (68.44 mM NaCl、5.36 mM KCl、112.7 mM Na2HPO4、5 g/L トリプトン、5 g/L 肝臓注入ブロス、0.03 M ヘミン、4.16 mM グルコース) で培養し、10% (v/v) ウシ胎児血清 (FBS) を補充します。 100 μg/mL ペニシリン、100 U/mL ストレプトマイシン、150 μg/mL ハイグロマイシンを選択的薬物として 28 °C で投与。 寄生虫は通常、3〜4日で固定相を達成します。
- 10 mLのGrace's Insect培地に3 x 10⁸ エピマスティゴテスと10%(v / v)FBSを15 mLコニカルチューブ、28°C、28〜10日間インキュベートすることにより、感染性寄生虫を取得するためのメタサイクロジェネシスを誘導します。
- Giemsa染色塗抹標本による分化率を評価します。そのためには、分化した寄生虫20μLをスライドガラスに広げ、10分間乾燥させます。
- ドラフト内で、スライドガラスをきれいなメタノールで覆ってサンプルの固定を進め、完全に乾かします(1〜2分)。スライドガラスをギムサ作業溶液で20分間覆います。
- スライドガラスを蒸留水でやさしく洗います。顕微鏡で、メタサイクリックトリポマスティゴートの割合を数えます。少なくとも 10% の差別化率が達成された場合は、次の手順に進みます。
- 寄生虫を遠心分離し(120 x g で10分間)、ペレットを10 mLのDPBSで再懸濁します。もう一度遠心分離し、10%(v / v)のFBS、100 μg / mLペニシリン、および100 U / mLストレプトマイシンを添加した5 mLのDMEMに寄生虫を再懸 ?? します。.
- 25cm2の培養フラスコにおいて、加湿インキュベーター18において、5%CO2中の37°Cで1.66×10⁵LLC−MK2細胞(Macaca mulatta由来の腎臓上皮細胞)の感染を行う。
- 組織培養トリポマスチゴテ(TCT)は、8〜9日後に培地に放出されます。新鮮なLLC-MK2細胞単層にTCTを1:40の感染多重度(MOI)で感染させます。
3. フローサイトメーターによる Trypanosoma cruzi の集団均質性の解析
- CL Brener Luc::NeonおよびCL Brener野生型株のTCTを回収し、120 x g で10分間遠心分離し、TCTをDPBSに再懸濁します。寄生虫の密度を調整して、1 x 10⁶/mLになるようにします。
- mNeonGreen 蛍光 (ex. 506/em. 517 nm)19 に基づくフローサイトメーターによるポピュレーション解析を進め、各サンプルについて少なくとも 20,000 のイベントを取得します。
注:蛍光個体数の割合は、野生型とトランスフェクションされた寄生虫を比較することによって得られます。マウスの感染を進めるには、CL Brener Luc::Neon系統の蛍光寄生虫集団の最低95%を達成する必要があります(補足図1)。
4.マウス実験感染
注:寄生虫の量を増やすために、血流トリポマスティゴテス(BT)は免疫不全マウスから頻繁に得られる10,13。そのために、シクロホスファミド(CTX)を62.5mg/kgで96時間間隔で4回腹腔内注射することで軽度の免疫抑制が達成され、これはT. cruzi感染と同時に行われます。
- T. cruzi 感染の 1 日前に、腹腔内注射 (i.p.) で 62.5 mg/kg の滅菌シクロホスファミドを投与します。
- 腹腔内経路を通じて、0.2 mLのDPBS中の1 x 10⁴ TCTを各マウスに感染させます。病原体や針を取り扱う際の事故のリスクが高いことへの注意。BSCで感染を行い、手順全体を通して手袋とフェイスシールドを着用します。
- 血液中のBTを直接観察することにより、寄生虫症を毎日監視する(Pizzi-Brener法)20。寄生虫症のピーク時、感染後約13-17日(dpi)で採血を行います。そのためには、100 mg / kgのケタミンと10 mg / kgのキシラジンでマウスを麻酔します。
- マウスが完全に麻酔されたら21、50μLの3.8%(w/v)クエン酸ナトリウムを含む24G X3/4針に取り付けられた1mLシリンジを使用して心臓穿刺を進める。針を抜き、血液を遠心チューブにそっと入れます。
- BSCでは、アンモニウム-塩化カリウム(ACK)溶解緩衝液中の血液アリコートの希釈を行い、ノイバウアーチャンバー内の寄生虫をカウントします。小さな血栓が寄生虫のカウントに影響を与えるため、この手順を少なくとも2回繰り返します。
注:カウントエラーを防ぐために、ノイバウアーチャンバー内のカウントが30未満および300を超えるトリポマスティゴートを避けるために希釈係数を調整します。 - DPBSで必要な量の純血を混合することにより、寄生虫密度を5 x 10³ BT / mLに調整します。
- 非免疫抑制BALB/cマウスに、マウスあたり0.2mLのDPBS(5×103BT/mL)に1×103 BTを感染させ、26G針を用いた腹腔内経路で感染させる(細い針は寄生虫溶解につながる)22。ボリュームを腹腔内に注入した後、逆流を避けるために針をマウス内に5秒間保持します。.
- 感染したマウスをペーパータオル付きの箱に一時的に入れて、漏れや出血の可能性を特定し、マウスをケージに戻します。
5. in vivo イメージング
注:ここで使用される用語集は次のとおりです。
イメージングセッション:特定の日に特定の実験のすべてのグループで行われた生物発光取得。 図 1A は、手順の概要を示しています。
イメージングラウンド:D-ルシフェリン注射から麻酔回復まで、3匹のマウスのサブグループで実施される手順。各実験群には、寄生虫負荷の固有の変動性や、以下に説明するBLI定量に影響を与えるその他の要因があるため、6匹のマウスを含めることをお勧めします。
イメージング取得:生物発光を定量化するためにイメージング機器によって行われる写真撮影により、写真と定量化された生物発光が擬似カラースケールとして示される画像オーバーレイが得られます。
イメージング手順:プロトコルのこのセッションで説明したすべての手順。
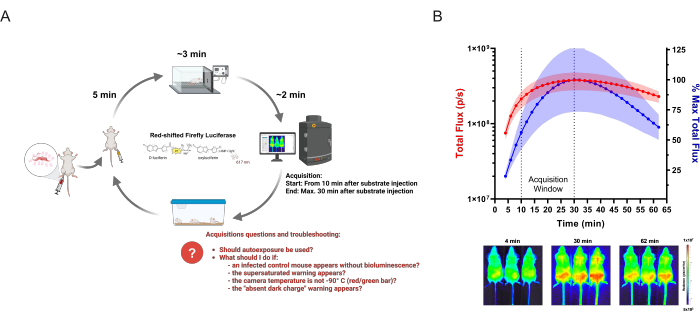
図1:BLIデータの取得 (A)シャーガス病生物発光マウスモデルを例に、感染症研究に適用した取得ワークフローの図。遺伝子組み換え T. cruzi に感染したマウスを、確立された時点の in vivo イメージングにより解析します。各イメージングラウンドで、最大3匹のマウスのグループに150 mg / kgの酵素基質(D-ルシフェリン)を注入します。5分後、酸素中の2.5%(v / v)イソフルランで麻酔を投与します。.完全に動かなくなった場合、マウスをイメージングシステムに入れ、定義された設定に従って取得を開始します。イメージング後、マウスは麻酔から回復し、ケージに戻されます。取得中に研究者が抱えている可能性のある、または直面する可能性のある頻繁な質問や問題は、赤で強調表示されています。 このスキームは、Lewis et al. (2014)12 (BioRender.com: UD26KWEVS2で作成) から修正されています。(B)D-ルシフェリン/赤方偏移ホタルルシフェラーゼ(PpyRE9h)の 生体内 動態。 T. cruzi 寄生虫血症ピーク(n = 3)のマウスに麻酔をかけ、150 mg / kgのD-ルシフェリンを注射しました。画像は1時間(露光時間:2分、ビニング:4)で取得しました。上:腹側全磁束(p / s)の定量化(左Y軸、赤)および最高平均測定値の割合(右Y軸、青)。データは平均値(曲線)と標準偏差(影付きの領域)で表示されます。下:最初の時点(4 分)、最も高い BLI 信号(30 分)、および最後(62 分)の時点の画像を取得。 この図の拡大版を表示するには、ここをクリックしてください。
- [Acquisition] ウィンドウの緑色のバーで、CCD(Charge-Coupled Device)カメラが低温(-90 °C)でないか確認します。バー(緑または赤)をクリックして、温度を視覚化します。
注意: イメージング機器のマニュアルによると、CCDを冷たく保つために、イメージング機器とソフトウェアは常にオンにする必要があります。 - 自動背景調整が実行されたかどうかを確認します。これを行うには、「 Acquisition > Background」>「View available Dark Charge」をクリックします。いくつかの設定の組み合わせのリストが表示されます。
注:この手順により、発光ノイズが低減されます。選択した構成の結果が 1000 より大きい値になる場合は、式 "露光時間 x (binning²)" に基づいて、ダーク チャージを無視しないでください。ソフトウェアの構成に応じて、ビニングは数値 (ビニング係数) または 'small' から 'large' の範囲として表示できます。範囲とビニング係数の対応関係は、デバイスのマニュアルに記載されています。 - アクティビティウィンドウ(ソフトウェアの下部にある白い領域)が表示されない場合は、メニュービュー>アクティビティウィンドウで有効にします。
- イメージングエリアを設定するには 、Acquisition Window > Field of Viewをクリックします。オプションC (13.2cm)は3匹、 オプションD (22cm)は5匹のマウスを取得します。
- [Acquisition > Auto-Save]をクリックして自動保存オプションを選択し、各時点の新しいフォルダを選択または作成します。
- つや消しの黒い紙をイメージングエリアに置き、仕切りスライドをインレットの間に垂直に置きます。メーカーがスライドを提供していない場合は、つや消しの黒紙(3 cm x 15 cm)を使用してください。
- イメージングチャンバーの内部領域を調整して、ガラス製のノーズコーンを麻酔インレットに合わせます。黒い電気テープの小片を使用して、麻酔システムをプラットフォーム(画像領域の外側)に取り付けます。
注意: イメージングデバイスの一部のバージョンでは、レーザーがイメージング領域を定義します。このツールが利用できない場合は、ソフトウェアを使用して画像を取得し、イメージングエリア内のパーティションスライドを確認してください。 - イソフルラン気化器を、イメージングチャンバーと誘導チャンバーの酸素中2.5%(v / v)に設定します。ガスがシステム21を流れているかどうかを圧力計で確認してください。
注:イメージングデバイスに吸入麻酔システムが取り付けられていない場合は、注射可能なキシラジンやケタミン23などの他の麻酔オプションが可能です。この場合、マウスの回復は遅く、死亡リスクは高い24。 - 注射器(31G針)にD-ルシフェリンを充填し(D-ルシフェリンを調製するための包括的なプロトコルは、異なる供給業者から提供されています)25,26、直射日光からそれらを保護し、ペーパータオルで内部を覆うことによって、いくつかのプラスチック容器または追加のケージを準備します。
- 時間を簡単に追跡できるように時計や時計を近くに置いておくと、マウスのグループ、ルシフェリン注射時間、および手順中のその他の情報を登録するための実験ノートがあります。
- すべてのマウスの体重を量り、体重を登録します。各マウスの尻尾にペンマーカーまたはタトゥーで印を付けます。実験全体を通してマウスの識別を良好に表示します。このステップは、買収の前日に実行することもできます。
注:インクが生物発光シグナルに干渉する可能性があるため、マークは大きな体面積を占めないようにする必要があります。異なる色の油性マーカーも、グループを区別するのに役立ちます。 - イメージングセッションを開始するには、背景の発光画像を登録します(設定: 露光時間:5分; ビニング:「大」または「16」、 f /ストップ:1)マウスなしのイメージングチャンバー。この手順は、自動発光光源または機器の望ましくない問題を特定するのに役立ちます。
注:BLIは酵素反応に基づいているため、実験の本質的な特徴は時間です。動物の取り扱いを開始する前に、上記のすべての項目と機器の設定を確認してください。 - 最初の3匹のマウスに150 mg / kg(i.p.)のD-ルシフェリンを注射します。マウスをコンテナボックスに入れて、D-ルシフェリンが漏れるかどうかを評価します(明るい黄色の溶液)。その場合はメモを取り、マウス群とD-ルシフェリンの投与時間を登録してください。
- 5分待ってから、マウスを麻酔導入チャンバーに移します。システムの電源を入れます。マウスが完全に麻酔されるまでに約3分かかります(足の震え、尻尾などの反応はありません)21.
- イメージングデバイスのドアを開け、イメージングチャンバーへの麻酔の流れをオンにすると同時に、誘導チャンバーをオフにします。
- 各マウスをノーズコーンの位置に置きます:マウス1〜3から左から右側へ。レーザーで示されるイメージング領域内に腹側を上にしてマウスを穏やかに収容します。アコモデーション中に、マウスのIDと位置を確認してください。鼻の円錐形に部分的に麻酔をかけたマウスの入場を強制しないでください。
- パーショニングスライドをマウスの間に置き、撮像装置のドアを閉めます。
- ソフトウェアの [取得]ウィンドウで取得設定を次のように調整します。
- 非感染マウスの場合、 曝露時間 = 5 分 / ビニング = 'large' または '16'
(しきい値を設定するための最も数学的に敏感な構成のセット)。 - 急性モデルの感染マウスの場合: 曝露時間 = 2 分/ ビニング = 'medium' または '4'。
- 慢性モデルの感染マウスの場合: ばく露時間 = 5 分/ ビニング = 'large' または '16'。
- 非感染マウスの場合、 曝露時間 = 5 分 / ビニング = 'large' または '16'
- D-ルシフェリン注入時間が、取得開始の少なくとも10分前に行われたかどうかを確認します。そうでない場合は、ルシフェラーゼ信号のピーク時に画像を取得するために必要な期間待ちます(図1B)。それ以外の場合は、[ 取得 ]をクリックしてイメージング取得を開始します。
- イメージングの開始後に [イメージ ラベル] ウィンドウが表示されます。ルシフェリン注射時間、実験、マウスの同定、時点、および記録を保持するのに役立つその他の必要な情報など、各グループに関する適切な情報をボックスに入力します。この情報は、測定テーブルファイルに含まれます。
- 画像取り込みの最後に警告サイン 「Saturated Image 」が表示されているかどうかを確認します。飽和した画像は受け入れられません。これが発生した場合は、ビニングを減らして新しい画像を取得します。分析で考慮するメモを取ります。
- 画像を取得したら、イメージングマシンのドアを開き、マウスを背側(裏面を上にして)に向けます。取得を再度実行し、適切にラベル付けします。
- この画像取得の最後に、麻酔薬の流れをオフにしてください。マウスをイメージングチャンバーから静かに取り出し、容器に入れます。
- マウスの体重を記録しながら、麻酔の回復を観察します。施術中に発見された異常な行動や身体の異常を記録します。マウスが動きに戻ったら、ケージに入れます。
注意: 取得した各画像のBLI強度を確認します。取得終了後、記録された生物発光画像と写真は、考慮されるべきではない自動スケールでソフトウェアに表示されます。データ分析で定義するスケール(後述)を ツールパレット ウィンドウで設定します。
6. データ分析
注:上記のプロトコルは、市販の in vivo イメージングソフトウェアに基づいています。ただし、ソフトウェアライセンスフリーのバージョンでは、最も基本的な分析を実行できます。ソフトウェアの詳細については、 資料の表を参照してください。
- ファイルを開きます。
- 特定のイメージング時点から取得したデータが含まれているフォルダを開くには 、Menu>Fileを選択し、フォルダを選択します>フォルダを選択します (図2A -手順1)。
注意: 新しいウィンドウが表形式で開き、取得したすべてのデータが選択したファイルに保存されます。ソフトウェアによって自動的に付与される画像ID(データ番号と時間番号)、取得中に研究者が画像ラベルウィンドウで提供した情報、および取得設定であるクリック番号記号が表示されます。これらのデータはすべて、飽和状態の画像を使用してはならないことを考えると、分析に使用できる画像を並べ替えるのに役立ちます。 - 選択したイメージに関連する複数の行 (感染していないコントロールを含む) を選択します。イメージ ID をラボ ノートブックに書き留め、イメージング セッション中に登録した情報と共に書き留めます。
- [ グループとしてロード]をクリックして、選択した画像を組み立てます。この手順では、新しいシーケンス イメージを作成します。したがって、すべての画像の機能を同時に調整することが可能です。新しいシーケンスイメージをステップ6.1で使用したフォルダとは異なる新しいフォルダに保存して、必要に応じて生データの再解析を容易にします。
- シーケンス画像で、[ オプション]>[表示]>[ビニング係数の選択 ]をクリックして、各画像に使用されているビニングを特定します(図2A ステップ2)。取得したビニング係数は、シーケンス内の各画像の上部に表示されます。
- すべてのビン分割係数を同じ数値に修正します。これを行うには、調整する画像をダブルクリックします。 [ツール パレット] >ウィンドウの [イメージ調整 ] セクションで、適切なビニング係数 (図 2A - 手順 3) を選択します (ビニング係数の選択については、手順 5.18 を参照してください)。この手順は、すべての発散イメージで実行します。
注:この手順はBLIの定量化に直接影響し(表1)、さらに「ディスカッション」セクションで説明します。
- 特定のイメージング時点から取得したデータが含まれているフォルダを開くには 、Menu>Fileを選択し、フォルダを選択します>フォルダを選択します (図2A -手順1)。
- スケールを設定します。
- 感染していないコントロールに基づいて、有効な生物発光シグナル(デバイスのマニュアルによると600カウント以上)を区別します。そのためには、感染していないマウスの画像をダブルクリックします。次に、新しいウィンドウの左上隅にある [単位] フィールドで [カウント] オプションを選択します。次に、[カラー スケール](Color Scale)を最小値の 600 に調整します。結果の画像は、放射輝度の最小スケールを設定するためのベースラインになります。
- シーケンスウィンドウがアクティブな状態で、[単位]フィールドで[放射輝度]オプションを選択します。ツールパレットでカラースケールとカラーテーブルを調整します。そのためには、カラースケール制限領域の個別ボックスを無効にします。
- ボックスには[ Logarithmic Scale ]と[ Manual ]に印を付けます(図2A -手順4)。非感染コントロール(ステップ6.8で観察)に従って最小スケール番号を設定し、最大として最も信号が強い領域( 図2A の矢印で示されている)を設定します。
注:In vivo 2D光測定は相対的な定量化です。各デバイスのバージョンとキャリブレーションの違いにより、異なるスケール値を見つけることができます。したがって、代表的な結果で示された値は、他のデバイスで行われた他の実験に適合しないにもかかわらず、内部コントロール(非感染者および未感染者)によれば同等に有効であることができませんでした。 - すべての画像に同じスケールを設定した後、各画像をダブルクリックし、ウィンドウを最大化し、[ グラフィックのエクスポート ]ボタンを使用して画像ビューを画像形式(.jpg、.tiffなど)でエクスポートし、 treatment_miceID_timeポイントごとにファイルに名前を付けます。(図2A -ステップ5)。この手順をすべての画像に対して実行します。
- 測定を実行します。
- シーケンスから任意の画像を選択し、ダブルクリックします。 [Tool Palette ] >ウィンドウの [ROI tools] セクションで、[ Square ] ボタン (図 2B- ステップ 1) をクリックし、マウス全体を覆う長方形を描きます。
- 作成した ROI の境界線をクリックし、各マウスに同じ ROI をコピーして貼り付けます (画像には 3 つの ROI が生成されます)。 ROI Tools セクションの Save をクリックして、ROI を保存します。保存したROIをすべての画像に適用するには、[ Apply to Sequence]ボックスを選択し、[ Load]をクリックします 保存されたROIは、実験全体のすべてのマウスに使用されます。
- 各マウスのROI位置を調整して、動物が測定領域により適合するようにします。すべてのマウスにラベルが付けられたら、[ Measure ROIs ]ボタンをクリックします(図2B-ステップ2)。 ROI測定テーブル が表示されます。 測定タイプを選択します:放射輝度;画像属性: すべての可能な値。ROI寸法:cm。次に、[ すべて選択 ]ボタンをクリックし、[ コピー ]ボタンをクリックします。
- データをテーブル分析ソフトウェア(スプレッドシート)に直接貼り付けます。または、ファイルを.csv形式または.txt形式でエクスポートします。
- データに取り組みます。
- テーブル解析ソフトウェアでは、データをグループ(治療、非感染者、非治療者など)ごとに整理します。
- 寄生虫の負荷は、全身の生物発光として示されます。したがって、同じマウスの腹側と背側のTotal Flux値と一致するようにデータを配置して、それらを合計します。
- 各グループを考慮して、合計値の平均と標準偏差を計算します(例: 補足表1)。データをグラフ作成および統計ソフトウェアにプロットします。
- 画像またはスライドプレゼンテーションソフトウェアで生物発光画像を含むパネルを準備します。各マウスを列に配置し、行の各時点に配置して、データの視覚化と解釈を容易にする薬効マトリックスを構築します。
注:手順6.2.4(イメージレイアウトウィンドウの表示)を実行せずに、イメージをイメージングソフトウェアに直接ビルドするオプションがあります>。ただし、ソフトウェアのインターフェイスとツールでは、データの整理が制限されます。
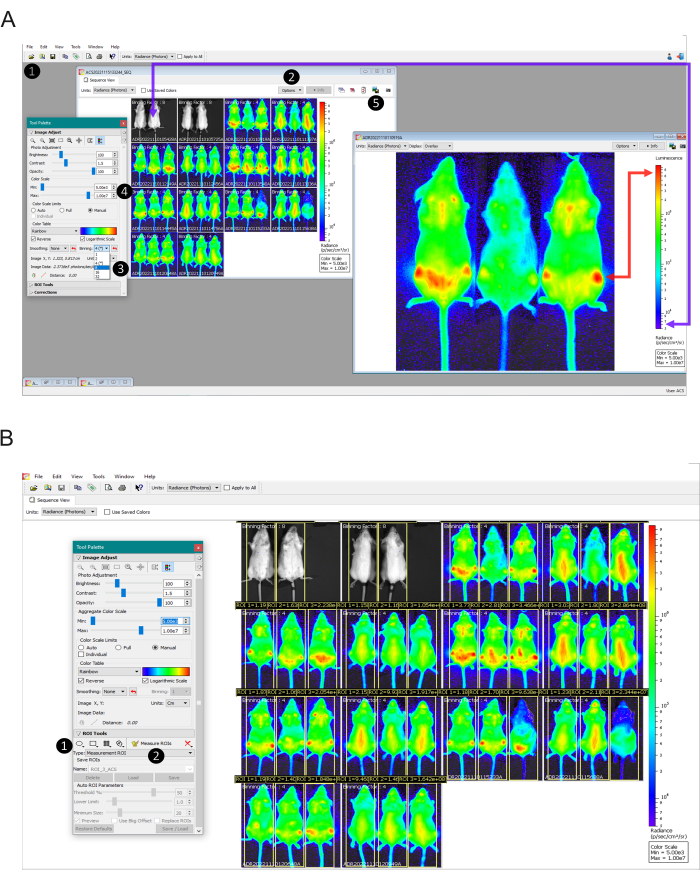
図2:画像スケールの設定から発光の定量化までのデータ解析ステップ(A)画像データ処理用のLiving Image Softwareビュー。ステップ1:Browserツールを使用して、取得したデータをシーケンスとしてアップロードします。ステップ2:各取得に使用されたビニングを特定します(個々の画像の上に表示されます)。ステップ3:感染したマウスのすべての画像を同じビニング係数に設定し、非感染マウスにビニング係数16を適用します。ステップ4:非感染マウス(紫の矢印)に基づいてカラースケールを手動で設定し、画面上では非生物発光として表示されるはずの感染マウスと未治療のマウス(赤い矢印)は、赤で見えるはずです。ステップ5:書かれた情報のない画像を取得するには、各画像をダブルクリックし、 グラフィックをエクスポート ボタン。(b)関心領域(ROI)ツールの表示。ステップ1:マウス全体を覆うROIを描き、各動物に同じROIをコピーして貼り付けます。調整されたROIを保存し、実験内のすべての画像に適用します。ステップ2:[ROIの測定]ボタンをクリックして、.csvまたは.txtとしてエクスポートするテーブルを生成します。この図の拡大版を表示するには、ここをクリックしてください。
7. 生体外 法
- 150 mg/kg D-ルシフェリン i.p. をマウスに注入し ( ex vivo ラウンドごとに 1 回)、3 分間待ちます。100 mg / kgケタミンと10 mg / kgキシラジンi.p.を使用してマウスを麻酔します。
- 生物学的安全キャビネットでは、マウスが足のつまみにまったく反応しない場合は、マウスの皮膚を切って腹膜(腹腔を開かずに)と左側の腋窩の組織を露出させます。腋窩動脈と血管を切断して放血を進めます。
- 使い捨てのパスツールピペットを使用して血液を採取します。次に、心臓の左心室を通じて、0.3 mg / mLのD-ルシフェリン10 mLをDPBS溶液に注入します。.
- 選択した臓器をペトリ皿の所定の場所に広げ、0.3 mg / mL d-ルシフェリン溶液に浸します。.この手順は、最大30分以内に実行する必要があります。
- 切除された臓器(心臓、肺、胸腺、肝臓、大腿四頭筋、腸間膜、脾臓、腎臓、副腎、内臓脂肪、食道、胃、小腸、盲腸、結腸、脳、皮下脂肪、子宮、性腺脂肪、膀胱、腹膜)の発光画像を、信号強度(飽和画像は許容されません)に応じて、5分間の露光時間とビニング16を使用して取得します22。
注:しきい値を設定するには、感染していないマウスで、感染したマウスの前に同じ手順を実行する必要があります。
結果
ルシフェラーゼを構成的に発現するトランスジェニック寄生虫に基づく適切なマウスモデルを使用して、宿主への害を最小限に抑える主要なヒト T.cruzi 感染特徴を再現することが可能であり、宿主の全身BLIによる寄生虫の長期的(生涯的)な方法で、最大数ヶ月にわたって寄生虫をリアルタイムで追跡することができる12。
図3 は、BALB/cマウスの感染後1日目から150dpiまでのCL Brener Luc::Neon感染の時間経過を示すパイロット実験を示しています。最初の20dpiでは、生物発光によって推測される寄生虫負荷が増加し、これは寄生虫症のピークに典型的なもので、その後、マウスの免疫制御により寄生虫負荷が急激に減少します。したがって、感染の急性期は最初の50dpiと見なされます。慢性期は、感染が100〜150dpiの一定の生物発光速度に達したときに定義されます。
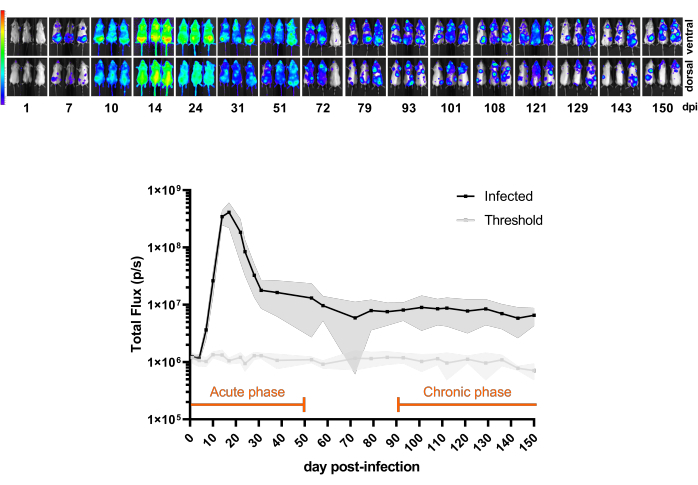
図 3: モデルを理解する。BALB/cマウスにおけるTrypanosoma cruzi CL Brener Luc::Neon感染の動態(n = 11)。トップパネル:腹腔内注射による1 x 10³血流トリポマスティゴテスによる感染後150日間の異なる時点からの腹側および背側の生物発光画像(dpi)。輝度(p / s / cm2 / sr)での生物発光シグナルのヒートマップスケール(Log10)。カラーコード:パープル= 5 x 10³;赤 = 1 x 10⁷.底面パネル:全身マウスの全フラックス(p/s)中の生物発光シグナル定量。データは、平均値 (線) と標準偏差 (影付きの領域) で表されます。このマウスモデルでは、感染の急性期と慢性期に定義された期間がオレンジ色で強調表示されています。非感染マウス(n = 3)の発光平均値を閾値(薄い灰色の線)として示しています。この図の拡大版を表示するには、ここをクリックしてください。
感染の主な段階はマウスモデルでよく再現されているため、治療結果も予測できます。したがって、BLIは現在、化合物の有効性の可能性と開発パイプラインの進行に関する意思決定を支援する概念実証研究を通じてトランスレーショナルサイエンスに適用されています10,27。急性マウスモデルでは、感染が寄生虫症のピーク(約14-21 dpi)に達したときに経口治療を開始する必要があります。これは、血流中の多数のトリポマスティゴテス(約1 x 10⁵トリポマスティゴート/ mL - データは示されていません)および全身感染によって特徴付けられます。慢性期では、マウスの治療は100dpiで開始され、寄生虫の負荷が比較的低く、安定したサブパテント寄生虫血症を示します。
本研究では、上記のプロトコールを抗寄生虫薬の評価に応用することを実証するため、シャーガス病の治療に用いられる標準薬であるベンズニダゾール(BZ)と、シャーガス病の臨床試験で失敗し、またin vitroおよびin vivoでT. cruziに対する抗寄生虫薬としても効果がないことが示されているステロール14α-デメチラーゼ(CYP51)阻害剤であるポサコナゾール(Posa)の治療効果を比較しましたこのプロトコル13,18,28,29,30に記載されているBLIモデルを含む。
急性マウスモデルでは、グループあたり6匹のマウスのコホートを、1日1回、強制経口投与31 回、20 mg / kgのPosaまたは100 mg / kgのBZで20日間経口治療しました。.マウスにもBZを1日1回100mg/kgで5日間投与し、短時間治療の効果を評価しました。化合物の排除後(治療終了後10日後)、BLI陰性のマウスは免疫抑制されましたが、これは寄生虫学的治癒が達成されない場合に感染の再発を促進する状態です(図4A)。ポーザ処理により、治療終了時に生物発光で推論される寄生虫負荷が99.49%±0.27%(平均±標準偏差)減少し、薬物化合物の排泄期間中、非感染マウスと同程度のレベルに留まりました(ただし、40dpiで一過性のシグナルを示すマウス#3、44dpiで弱いBLIスポットを示したマウス#2を除く)。非治療群と比較して、BZ治療を20日間行うと、治療終了時の生物発光で推論される寄生虫の負担が100%±0.01%減少しました。対照的に、BZによる5日間の短時間治療は、19dpiで99.98%±0.03%の減少をもたらしました(閾値レベルと同様)。しかし、この場合、BLIの減少は一過性であり、その後の獲得では、すべてのマウスが感染再活性化を示しました(図4B)。
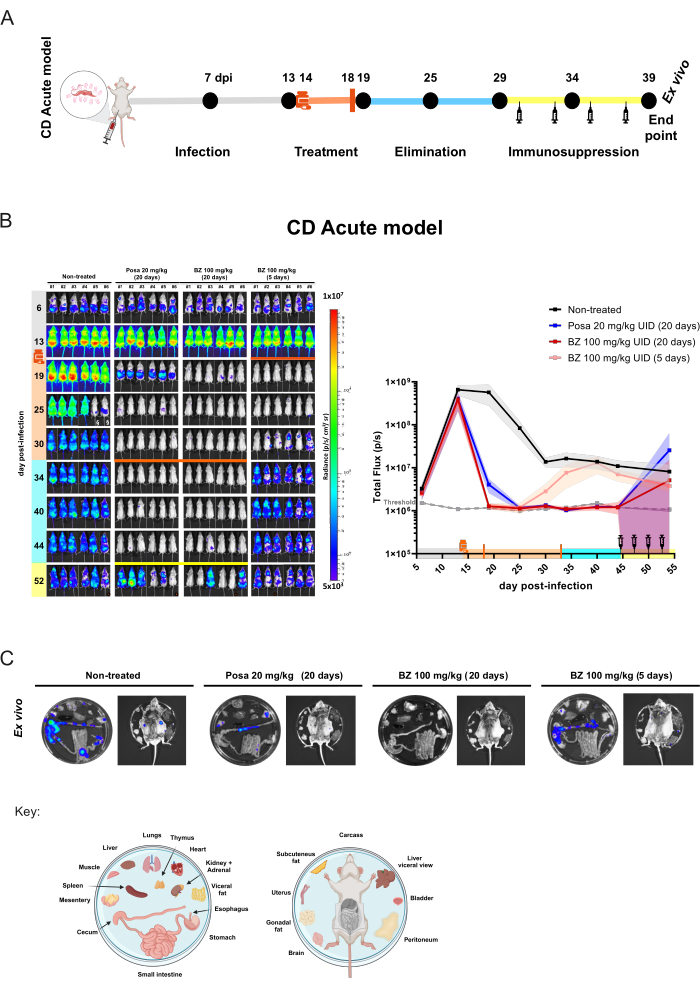
図4:シャーガス病急性モデルにおける生物発光イメージングによる概念実証実験デザインと結果 (A)化合物の有効性評価のための前臨床試験のためのシャーガス病急性マウスモデルにおけるタイムラインプロセスの概略図。黒い点:イメージングの時点。薬液とオレンジ色のバー:それぞれ治療の開始と終了。シリンジのアイコン:シクロホスファミド注射。DPI:感染後日。カラーコード:灰色=未治療の感染症。オレンジ=治療期間;青=化合物の除去フェーズ。黄色=免疫抑制期間。(B)Trypanosoma cruziの治療の時間経過。左パネル:BALB/cマウスの腹側生物発光画像(i)未処理または(ii)ポサコナゾール(Posa)を20 mg/kg、(iii)ベンズニダゾール(BZ)を100 mg/kgで20日間処理、(iv)BZ(100 mg/kg)を(n = 6/群)で5日間処理して20日間処理したマウス。すべての治療は、1日1回強制経口(10mL/kg)による投与でした。Log10スケールのヒートマップは、低レベル(青)から高レベル(赤)までの生物発光シグナル強度を示します。右グラフ:生物発光イメージングデータの全身定量化。データは、平均値 (線) と標準偏差 (影付きの領域) で表されます。キー:薬液:治療開始(14 dpi);オレンジ色のバー:治療終了(18 dpi / 33 dpi);シリンジアイコンシクロホスファミド注射(44-53日目から);オレンジ色の点:ex vivo手順によって分析されたマウス。§ 尿中のD-ルシフェリン漏出のため、データは除外されています。(C)臓器および組織におけるT. cruzi病巣検出のためのEx vivo手順。プレートの分配キーは、図の下部に表示されます(BioRender.com:ZY26LG8AOFで作成)。in vivoパネルと同じ放射輝度スケール。この図の拡大版を表示するには、ここをクリックしてください。
このモデルでは、抗寄生虫治療により、寄生虫の負荷をBLI検出限界の1000寄生虫未満に減らすことができます。したがって、マウスはBLI陰性10として現れる。寄生虫学的治癒を確実に達成するためには、シクロホスファミド治療を用いてマウスの免疫抑制を促進する必要がある29,32。薬物治療後もまだ検出できない寄生虫量を持つマウスは、免疫抑制後にBLI陽性になります。この効果は、寄生虫の再発を促進する急性モデルでのポーサ治療によってより広範囲に示されます。この実験では、寄生虫組織の親和性を評価するために、生物発光シグナルが最も低いマウスでex vivo手順を実行しました(図4C)。未治療のマウスは、特に消化管(TGI)および内臓脂肪や腸間膜などの関連組織で、強い生物発光シグナルを示します。さらに、皮膚は寄生虫の持続性に関連する部位でした。Posaで治療されたマウスは、結腸、腸間膜、および内臓脂肪により限定された低強度の生物発光スポットを示しました。一方、根治的治療レジメンでBZ100mg/kgを20日間投与したマウスでは、免疫抑制下でも生物発光シグナルは検出されません。したがって、生物発光シグナルが1000寄生虫10の閾値レベルを超えて上昇する条件を促進し、内臓を露出させることで感度を高めた後、BZ 100 mg / kgを20日間投与することで無菌治癒が得られると考えられる。無菌治癒の評価は、以前に異なる技術によって検証されていた10,13,17,33,34。
同様の研究デザインが慢性モデル(図5A)に適用され、マウス(n = 6 /グループ)が感染後100日目に治療を開始しました。この時点で、Posa 20 mg / kg、BZ 100 mg / kg、または1日1回10 mg / kgを20日間経口投与しました。.薬物排除期間後、BLI陰性マウスは免疫抑制されました。さらに、無菌治癒を評価するために、免疫抑制期の終了時にまだBLI陰性であったマウスを ex vivo 分析に供しました。
慢性感染症では、20 mg / kgでのポーザによる治療により、治療終了時の生物発光±推測される寄生虫負荷が95.03%6.18%減少し、薬物排除期間中は非感染マウスと同様のレベルにとどまりました。.免疫抑制後、マウスの大部分は、BLIシグナルと分布のレベルが変動することを示しました(図5B)。 ex vivo 手順により、Posa で処理された全身 BLI 陰性マウス 1 匹が、 ex vivo 検査で検出可能な結腸に生物発光スポットがあることが明らかになりました (図 5C)。
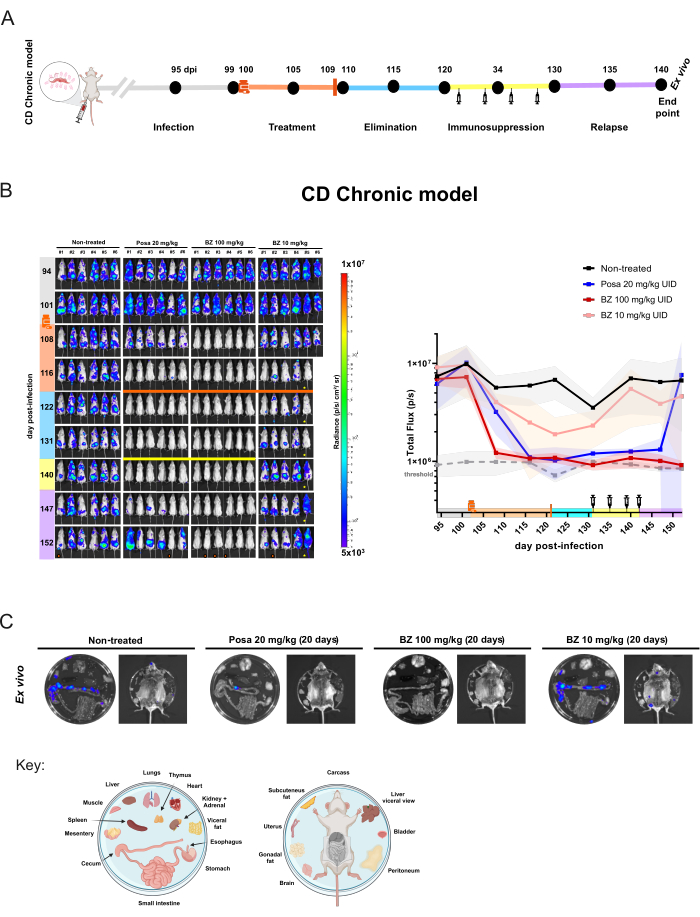
図5:生物発光イメージングによるTrypanosoma cruzi感染の慢性モデルにおける薬物評価実験デザインと結果。 (A)慢性シャーガス病マウスモデルの実験設計の模式図。黒い点:イメージングの時点。薬液とオレンジ色のバー:それぞれ治療の開始と終了。シリンジのアイコン:シクロホスファミド注射。Dpi:感染後日。カラーコード:グレー=未治療の感染症。オレンジ=治療期間;青=化合物の除去フェーズ。黄色=免疫抑制;ライラック=再発。(B)シャーガス病慢性モデルにおける治療効果の縦断的評価。左パネル:BALB/cマウスの腹側BLI (i)未治療または(ii)ポサコナゾール(Posa)を20mg / kgで20日間治療。(iii)100 mg / kgのベンズニダゾール(BZ)、および(iv)10 mg / kgのBZ(n = 6 /グループ)。すべての治療は、1日1回強制経口投与されました。右のグラフ:腹側と背側の全磁束の生データの合計。キー:薬液:治療開始(102 dpi);オレンジ色のバー:治療終了(121 dpi);黄色のバーと注射器のアイコン:シクロホスファミド注射(131-142日目から)。オレンジ色の点:ex vivo手順で分析されたマウス。!マウスは麻酔中に死亡しました。 マウスが腹部の異常を表示します。ヒートマップスケール(Log10)は、低レベル(3 × 10⁵、青)から高レベル(1 × 10、7、赤)までの生体発光強度を放射輝度単位で示します。(C)組織中のT. cruziの向性菌のEx vivo分析。100 mg / kgのPosaおよびBZで治療した後の免疫抑制されたin vivo BLI陰性マウス、または未治療でシグナルが最も低く、10 mg / kgグループでBZのマウスから切除された臓器の生物発光検出。プレートの分配キーは、図の下部に示されています(BioRender.com:ZY26LG8AOFで作成)。輝度スケールはin vivoパネルと同等です。この図の拡大版を表示するには、ここをクリックしてください。
100 mg / kgでのBZによる治療は、生物発光を122 dpiで閾値レベル(93.87%±2.14%)に減少させ、実験の終了までそれ以降に減少させました。. ex vivo 解析を考慮すると、BZは免疫抑制状態や内臓を検査しても生物発光シグナルの回復を示さなかったため、100%(6/6マウス)の治癒率を達成しました。つまり、再発がないということです。それにもかかわらず、低濃度のBZ治療レジメンは、生物発光のわずかな減少(85.95%±18.43%)をもたらしましたが、マウスはその後のすべての時点で検出可能な生物発光シグナル病巣を示し続けたため、治癒はありませんでした。したがって、このモデルにより、効果のない治療 (ポサコナゾールとベンズニダゾールによる最適でない治療) と効果的な治療 (ベンズニダゾールによる最適な投与と治療期間) を定量的に区別できます。
補足図1:レポーター遺伝子mNeonGreen蛍光の測定によるT . cruzi 集団のルシフェラーゼ発現の感染前解析。 CL Brener Luc::Neon寄生虫によって構成的に発現されるmNeonGreen蛍光タンパク質のフローサイトメトリー。寄生虫数(Y軸)をmNeonGreen蛍光強度(X軸)で正規化したヒストグラム。内部凡例は、分析された株と形状、蛍光の中央値、および蛍光母集団の割合を示しています。ゲートラインは、CL Brener野生型(WT)株によって非蛍光制御として定義されています。 このファイルをダウンロードするには、ここをクリックしてください。
補足表1:BLI測定における分析表の例。図4Bに示す代表的な結果で使用された急性モデルにおける感染後19日目の生物発光イメージング定量から得られた生データ。グループの説明:非感染マウスとして制御(n = 3 /グループ)。未治療の感染マウスとしてのビヒクル;ポサコナゾール (Posa) を 20 mg/kg で 20 日間;ベンズニダゾール (BZ) を 100 mg/kg で 20 日間;BZ を 100 mg/kg で 5 日間処理しました (n = 6/群)。このファイルをダウンロードするには、ここをクリックしてください。
ディスカッション
生物発光イメージングは、可視および赤外スペクトルの電磁放射を使用してレポート遺伝子を検出できる画期的な方法です。したがって、試料35を追跡するために放射性標識マーカーを使用する必要はない。BLIは、げっ歯類モデルやその他の小さな種に適しています。より安全で、数回の画像ラウンドが可能で、動物の不快感を最小限に抑えることができるため、前臨床試験に非常に役立ちます。その上、 in vivo イメージングは、生物発光、蛍光、および陽電子放出断層撮影法36などの他の技術を組み合わせる可能性があるため、非常に柔軟である。
光学イメージングは、吸収や散乱などの光学的物理的特性によって支配されます。すべての組織は、異なる方法で区別された波長の光を吸収および散乱します37。重要なステップの1つは、化学反応によって生成される光の放出波長を考慮せずにレポーター遺伝子を選択することです。生物発光アッセイでは、レポーター遺伝子の発現レベルがin vitroで高くなる可能性がありますが、in vivo設定に進むと、同じレベルの発現が得られない可能性があります。このプロトコルでは、617 nmで光を放出するトリパノソーマチド9用の赤方偏移Photinus pyralis luciferase(PpyRE9H)38コドン最適化バージョンを使用しました39。600nmより長い波長は、体内因性発色団、特にヘモグロビンとメラニンによる吸収と散乱が少なくなります。したがって、赤色光は数センチメートルの組織を介して透過することができ、光子は内臓組織39,40内からでもCCDカメラに到達することを可能にする。
イメージング環境における懸念事項の1つは、その機能と効果を包括的に理解していないことです。ビニングは、前処理技術であり、連続した検出器によって取得された情報をより大きなピクセルに結合します。このプロセスにより、S/N比が向上し、バックグラウンドノイズが低減され、感度が向上します。しかし、空間分解能の精度を低下させ、ピクセル化された画像41,42をもたらす。このトレードオフは、イメージング戦略における重要な考慮事項です。
「Target Product Profile」と「Target Candidate Profile for Chagas Disease34」に基づき、この概念実証試験は、 T. cruzi を検出し、新薬候補が無菌治癒を達成できるかどうかの立証に役立つ感度に焦点を当てています(数回の免疫抑制ラウンド後の再発の欠如で表されます)。したがって、画像を過飽和にすることなく、最高のビニング係数を使用してBLIを実行します。画像が過飽和になると、より低いビニング係数を使用して新しい取り込みが実行されます。解析中に、異なるビニングが必要な画像に数学的補正が適用されます。このように、最終データは同じビニングを使用して表示する必要があります。 表 1 は、同じ画像と ROI に特徴的なビニング係数を適用した場合に得られるさまざまな値を示しています。
表1:ビニング設定がBLI定量に及ぼす影響。 急性モデル(d13)と慢性モデル(d118)の画像上での3つのROIの定量化、異なるビニング因子で分析。 この表をダウンロードするには、ここをクリックしてください。
現在の臨床におけるシャーガス病のシナリオにより、創薬努力は寄生虫を完全に排除すること(寄生虫学的治療)を目指しています27,34。したがって、in vivo 前臨床プロトコルには、BLI の技術的感性の限界を克服するアプローチが含まれています。そのアプローチの1つは、マウスをシクロホスファミドで治療して、寄生虫の負荷を制御する免疫応答を減らすことです。別の戦略は、組織の深さを減らし、カメラへの光の経路を妨げる筋肉、皮膚、毛皮の層を取り除くことです。ex vivo法により、小さな生物発光スポットを検出し、図5Cに示すように、Posaで処理したマウスのex vivo結果に示すように、in vivo BLI閾値を下回る寄生虫病巣を明らかにすることができます。
モデル自体と感染動態を評価するためのパイロット実験を設計することは、抗寄生虫薬の有効性評価のための正確な実験を確立するために重要です。したがって、研究者は適切なBLI設定と感染時間経過を事前に定義することができます。探索的実験では、取得設定を定義するのに役立つツールの1つが「自動露光」です。このツールを使用すると、研究者は3つの設定(露光時間、 ビニング、 F / Stop)の優先順位を確立して、可能な限り最高の画像を取得します。特に、研究者は、CCDカメラのダイナミックレンジ内で画像が取得され、過飽和や露出不足がないことを確認する必要があります。これは、スケールの下限と最大の制限、および自動露出機能(メニュー 編集 > 設定 > タブ取得 > タブ自動露出)で確認できます).このプロトコルでは、カメラの絞りを最大値 (F/Stop: 1) に設定し、急性モデルと慢性モデルで露光時間とビニング係数を区別しました。これらの設定により、異なる画像ラウンドを同時に実行するための時間予測可能性が得られます。レポーター法が酵素反応に基づいていることを考えると、マウスへの基質の生体内分布とルシフェラーゼ速度論の両方が生物発光シグナルに影響を与え、したがって感染の定量化に影響を与えます(図1B)。その結果、酵素動態の異なる瞬間に画像を取得すると、説明も補正もできないデータのばらつきが発生し、総フラックス(光子/秒)または放射輝度(光子/秒/cm2/ステラジアン)の計算に影響を与えます。さらに、 T. cruzi 感染は、マウスで動的な空間的位置(異なる領域と組織、深さ、および寄生虫の負荷)を示します。したがって、取得するカウントの値を設定すると、別の強いシグナルのソースが定義された自動曝露基準を満たしている場合、弱いシグナルソース(組織のより深い特定のスポットに寄生虫の数が少ない)を見逃す可能性があります。
Living Imageソフトウェアのトリッキーな機能は、取得した画像を自動カラースケールで表示することです。選択したスケール値に従って、新しく取得した画像を自動的に表示するようにスケールを事前に設定するオプションはありません(プロトコルステップ6.2を参照)。この状況では、研究者は画像を1つずつ選択した最大値と最小値に手動で変更する必要があります。その結果、経験の浅いユーザーや十分なトレーニングを受けていないユーザーは、取得セッション中に適切な読み出しを得ることができず、その時点でデータを誤解させたり、重要な情報を失ったりする可能性があります。そのためには、パイロット実験が有益です。
概念実証実験デザインに関する最も一般的な質問の1つは、治療期間と用量の選択方法です。新しい化学物質の場合、これらのパラメータは通常、in vitroでの化合物の効力と選択性によって定義され、薬物代謝および薬物動態(DMPK)によって生成されたデータおよびin vivoでの有効性試験前に実施された忍容性試験と組み合わされます。要約すると、細胞内の寄生虫を選択的に殺すことができる化合物を特定した後、最初のADME実験(吸収、分布、代謝、排泄)をin vitroで実施し、化合物の水溶性、細胞透過性、代謝安定性などのパラメーターを推定します。化合物がin vitro特性(通常は標的候補プロファイルで定義される)のバランスが良好である場合、これらの候補は健康なマウスでのin vivo薬物動態(PK)研究に進み、血液中(およびおそらく組織内)での化合物曝露の概要を説明し、さまざまな用量レベルでの忍容性の一般的なアイデアを提供します17。34,43.理想的には、ほとんどの感染症におけるPK評価の目標は、EC50/EC90濃度44(寄生虫のそれぞれ50%または90%の成長を殺す、または少なくとも90%の成長を阻害する有効濃度)を超える遊離血漿濃度(血漿タンパク質結合を補正)に十分に長期間到達する可能性を決定することである。一定の用量レベルで十分な曝露が達成された場合、このレジメンはシャーガスBLIモデルを使用した有効性試験中に使用できます。ドラッグリポジショニング研究には、in vitroおよびin vivo PKデータが利用可能である必要があります。薬物再プロファイリングの良いスタートは、PubChem45のような化学データベースであり、これらは、アロメトリックスケーリング46を使用してマウスに変換し、試験すべき安全で毒性のない治療レジメンを推定することができる認識されたデータを提供する。しかし、必ずしもそうではありません。PK研究は、学術科学においてまだ見過ごされている分野であり、PKの結果を発表している製薬会社はほとんどありません。創薬科学コミュニティは、in vivo PK評価をin drug efficacy assays(薬力学)とともに含めることを推奨しています47。したがって、前臨床イメージングは化合物測定と同時に互換性があり、この関連するアプローチによりデータの堅牢性が向上します。
さらに、マウスの取り扱い、体重、健康状態は、実験全体を通じて監視されます。猫背、震え、バランスの喪失、動きたくない、摂食や飲酒をためらう、衰弱、またはグループまたは個々のマウスの状態に存在するその他の異常などの毒性および副作用の兆候は、前臨床試験に登録し、報告する必要があります。.光学イメージングの目標の1つは、動物の健康を確保することです。したがって、人道的なエンドポイントは、「しかめっ面スケール48」に記載されている痛みの徴候を持つマウスに適用する必要があります。また、マウスの体重は、BLIの獲得中、およびより頻繁には薬物投与およびCTX治療中に毎週体重を量りました。動物福祉の規制に従い、体重が20%以上減少したマウスは、直ちに人道的に安楽死させなければなりません。
T. cruzi生物発光モデルは、シャーガス病の新たな治療法の発見と開発のための最先端の実験モデルとなりました。T. cruzi感染症とシャーガス病49の主要な特徴を再現するモデルで、寄生虫症のリアルタイムモニタリングと、既知の作用機序に関連するさまざまな有効性プロファイルを持つ化合物の鑑別を可能にします。BLIは、感染組織を特定する際の自己主張を強化する技術です。これにより、感染組織の正確な選択を、T. cruzi 研究50,51 ですでに適用されているすべての古典的な方法を含む、幅広いアプローチで使用できます。さらに、研究者は最先端の技術を探求し、新しい技術を開発することができます33。さらに、BLIは、動物の健康の改善と、3Rの原則10,35に従って、より合理的な使用を一度に提供します。
顧みられない熱帯病に焦点を当てたいくつかの研究グループは、in vivoイメージングデバイスが利用できない国に配置されています。現在のシナリオを克服するために、Global BioImagingやその関連コンソーシアムのような新しい国際ネットワークは、イメージングの中核施設へのオープンアクセスを提供し、スタッフとイメージング科学者のトレーニングを改善するための行動を促進している52,53。これらのイニシアチブは、このようなフレンドリーなユーザープロトコルとともに、すべての研究者にハイエンドテクノロジーを民主化する条件を提供することができます。この方法を前臨床創薬に導入することで、シャーガス病の創薬を促進する臨床転帰の確かな有効性と予測値が得られました。
開示事項
著者には、宣言すべき利益相反はありません。
謝辞
著者らは、薬効アッセイに関するBLIのトレーニングとサポートを提供してくれたAmanda Franscisco氏、John Kelly氏、Fanny Escudié氏、寄生虫を提供してくれたJohn Kelly氏とSimone Calderano氏、動物実験のサポートを提供してくれたGabriel Padilla氏に感謝します。A.C.Sは、ロンドン大学衛生熱帯医学大学院(英国)での研修に対してCAPES PSDE奨学金を授与されました。また、著者らは、IVIS Spectrum機器解析の技術サポートを提供してくださったサンパウロ大学科学研究コア施設のFlow Cytometry and Imaging Research(FLUIR)プラットフォーム(CEFAP-USP)と、マウスの特異的病原体フリーとしての品質管理のための実験後アッセイを提供してくださったLaboratory of Genetics and Sanitary Control ICB-USPに感謝します。このプロジェクトはDNDiによって資金提供されました。DNDiは、2003年のDNDiの設立以来、すべての活動に資金を提供してくださった官民の寄付者に感謝しています。DNDiの寄付者の完全なリストは、https://dndi.org/about/donors/ でご覧いただけます。
資料
| Name | Company | Catalog Number | Comments |
| BD LSRFortessa™ X-20 Cell Analyzer | BD Biosciences | ||
| Weighing Balance (animal facility) | Available from several suppliers | ||
| IVIS Spectrum In Vivo Imaging System | Revvity (former PerkinElmer) | ||
| FlowJ Software v10.7.1 | BD Biosciences | ||
| Living Image Software for Spectrum v4.7.1 | Revvity (former PerkinElmer) | License Free Analysis Software called 'Aura Imaging' could be used for the most basic features provided by Spectral Instruments Imaging (Bruker company) (https://spectralinvivo.com/software/) | |
| Microsoft Office software | Microsoft | ||
| GraphPad Prism v8.4.0 | GraphPad Software Inc. | ||
| DMEM Low Glucose | Vitrocell | D0025 | |
| Sodium bicarbonate | Sigma-Aldrich | S5761-500G | |
| Foetal Bovine Serum (FBS) | Gibco | 16000-044 | |
| Penicillin-Streptomycin | Gibco | 15140-122 | |
| Trypsin 0.5% EDTA | Gibco | 25300-062 | |
| LIT medium | In house | ||
| Hygromycin B (50 mg/mL) | Gibco | 10687010 | |
| Grace′s Insect Medium | Sigma-Aldrich | G9771 | |
| HEPES | Sigma-Aldrich | 54457 | |
| IVISBrite d-luciferin potassium salt | Revvity (former PerkinElmer) | 122799 | Also could be used: VivoGlo Luciferin, in vivo grade (Promega/P1043); D-Luciferin, Monopotassium Salt (Thermo Scientific/88293) or PierceD-Luciferin, Monosodium* Salt (Thermo Scientific/88291); D-Luciferin, Potassium Salt (GoldBio/LUCK or eLUCK); D-Luciferin, Sodium* Salt (GoldBio/LUCNA or eLUCNA) *Sodium or potassium salt differences relies minimal chances on solubility, however do not affect in vivo performance. |
| DPBS | Gibco | 21600-044 | |
| Cyclophosphamide (CTX) | Sigma-Aldrich | C0768-5g | |
| Dimethyl sulfoxide (DMSO) | Sigma-Aldrich | D5879 | |
| (Hydroxypropyl)methyl cellulose (HPMC) | Sigma-Aldrich | 09963-25G | |
| Benzyl alcohol | Sigma-Aldrich | 402834 | |
| Tween 80 | Sigma-Aldrich | P1754-1L | |
| Benznidazole | ELEA | ||
| Posaconazole (Noxafil commercial formulation) | Schering-Phough | ||
| Giemsa | Available from several suppliers | ||
| gavage needle (stainless-steel straight) - 22GA | Aton | CA2003 | |
| 1 mL Syringe and 31G needle | Available from several suppliers | ||
| 1 mL Syringe and removable 26G needle | Available from several suppliers | ||
| 1 mL Syringe and removable 24G X¾ needle | Available from several suppliers | ||
| Sterile Syringe Filter 0.2 µm | Available from several suppliers | ||
| A4 Matte Black paper 120gr or thicker | Paper Color/ Canson (Available from several suppliers) | ||
| aluminum foil | Available from several suppliers | ||
| Neubauer chamber | Available from several suppliers |
参考文献
- WHO fact sheet. Chagas disease (also known as American trypanosomiasis). WHO, World Health Organization. , Available from: https://www.who.int/news-room/fact-sheets/detail/chagas-disease-(american-trypanosomiasis) (2023).
- Lee, B. Y., Bacon, K. M., Bottazzi, M. E., Hotez, P. J. Global economic burden of Chagas disease: a computational simulation model. Lancet Infect Dis. 13 (4), 342-348 (2013).
- Bern, C. Chagas' disease. N Engl J Med. 373 (5), 456-466 (2015).
- Shikanai-Yasuda, M. A., Carvalho, N. B. Oral transmission of Chagas disease. Clin Infect Dis. 54 (6), 845-852 (2012).
- Lidani, K. C. F., et al. Chagas disease: From discovery to a worldwide health problem. Front Public Health. 7, 166(2019).
- Perez-Molina, J. A., Molina, I. Chagas disease. Lancet. 391 (10115), 82-94 (2018).
- Field, M. C., et al. Anti-trypanosomatid drug discovery: An ongoing challenge and a continuing need. Nat Rev Microbiol. 15 (7), 447(2017).
- Kratz, J. M. Drug discovery for chagas disease: A viewpoint. Acta Trop. 198, 105107(2019).
- McLatchie, A. P., et al. Highly sensitive in vivo imaging of Trypanosoma brucei expressing 'red-shifted' luciferase. PLoS Negl Trop Dis. 7 (11), e2571(2013).
- Lewis, M. D., Francisco, A. F., Taylor, M. C., Kelly, J. M. A new experimental model for assessing drug efficacy against Trypanosoma cruzi infection based on highly sensitive in vivo imaging. J Biomol Screen. 20 (1), 36-43 (2015).
- Costa, F. C., et al. Expanding the toolbox for Trypanosoma cruzi: A parasite line incorporating a bioluminescence-fluorescence dual reporter and streamlined CRISPR/Cas9 functionality for rapid in vivo localisation and phenotyping. PLoS Negl Trop Dis. 12 (4), e0006388(2018).
- Lewis, M. D., et al. Bioluminescence imaging of chronic Trypanosoma cruzi infections reveals tissue-specific parasite dynamics and heart disease in the absence of locally persistent infection. Cell Microbiol. 16 (9), 1285-1300 (2014).
- Francisco, A. F., et al. Limited ability of posaconazole to cure both acute and chronic Trypanosoma cruzi infections revealed by highly sensitive in vivo imaging. Antimicrob Agents Chemother. 59 (8), 4653-4661 (2015).
- du Sert, N. P., et al. The arrive guidelines 2.0: Updated guidelines for reporting animal research. PLoS Biol. 18 (7), e3000410(2020).
- Turner, P. V., Brabb, T., Pekow, C., Vasbinder, M. A. Administration of substances to laboratory animals: routes of administration and factors to consider. J Am Assoc Lab Anim Sci. 50 (5), 600-613 (2011).
- Turner, P. V., Pekow, C., Vasbinder, M. A., Brabb, T. Administration of substances to laboratory animals: equipment considerations, vehicle selection, and solute preparation. J Am Assoc Lab Anim Sci. 50 (5), 614-627 (2011).
- Francisco, A. F., et al. Nitroheterocyclic drugs cure experimental Trypanosoma cruzi infections more effectively in the chronic stage than in the acute stage. Sci Rep. 6, 35351(2016).
- Moraes, C. B., et al. Nitroheterocyclic compounds are more efficacious than CYP51 inhibitors against Trypanosoma cruzi: implications for Chagas disease drug discovery and development. Sci Rep. 4, 4703(2014).
- Shaner, N. C., et al. A bright monomeric green fluorescent protein derived from Branchiostoma lanceolatum. Nat Methods. 10 (5), 407-409 (2013).
- de Araújo-Jorge, T. C., de Castro, S. L. Chagas Disease: Manual for Animal Experimentation. , FIOCRUZ Publisher. Rio de Janeiro. (2000).
- JoVE. JoVE Science Education Database. Anesthesia Induction and Maintenance. JoVE. , (2023).
- Taylor, M. C., et al. Exploiting genetically modified dual-reporter strains to monitor experimental Trypanosoma cruzi infections and host-parasite interactions. Methods Mol Biol. 1955, 147-163 (2019).
- Keyaerts, M., et al. Inhibition of firefly luciferase by general anesthetics: effect on in vitro and in vivo bioluminescence imaging. PLoS One. 7 (1), e30061(2012).
- Jiron, J. M., et al. Comparison of isoflurane, ketamine-dexmedetomidine, and ketamine-xylazine for general anesthesia during oral Procedures in rice rats (Oryzomys palustris). J Am Assoc Lab Anim Sci. 58 (1), 40-49 (2019).
- GoldBio. GoldBio Luciferin In Vivo Handbook - a detailed method for Luciferin preparation and administration for model animals. GoldBio Protocol. , Available from: https://goldbio.com/documents/1068/Luciferin%20in%20vivo%20handbook.pdf (2013).
- Revity. Preparation of IVISbriteTM D-Luciferin for in vitro and in vivo bioluminescent assays. Revvity Standard Operate Procedure (Tech Notes). , Available from: https://resources.perkinelmer.com/lab-solutions/resources/docs/SOP_LuciferinPrep_InVitroInVivo_BLI-Assays.pdf (2023).
- Chatelain, E., Scandale, I. Animal models of Chagas disease and their translational value to drug development). Expert Opin Drug Discov. 15 (12), 1381-1402 (2020).
- Khare, S., et al. Antitrypanosomal treatment with benznidazole is superior to posaconazole regimens in mouse models of Chagas disease. Antimicrob Agents Chemother. 59 (10), 6385-6394 (2015).
- Bustamante, J. M., Craft, J. M., Crowe, B. D., Ketchie, S. A., Tarleton, R. L. New, combined, and reduced dosing treatment protocols cure Trypanosoma cruzi infection in mice. J Infect Dis. 209 (1), 150-162 (2014).
- Molina, I., et al. Randomized trial of posaconazole and benznidazole for chronic Chagas' disease. N Engl J Med. 370 (20), 1899-1908 (2014).
- JoVE. Science Education Database. Compound Administration II. JoVE. , (2023).
- Pukhalsky, A. L., Toptygina, A. P., Viktorov, V. V. Immunosuppressive action of cyclophosphamide in mice: Contribution of some factors to determination of strain differences. Int J Immunopharmacol. 15 (4), 509-514 (1993).
- Francisco, A. F., et al. Comparing in vivo bioluminescence imaging and the Multi-Cruzi immunoassay platform to develop improved Chagas disease diagnostic procedures and biomarkers for monitoring parasitological cure. PLoS Negl Trop Dis. 16 (10), e0010827(2022).
- Kratz, J. M., et al. The translational challenge in Chagas disease drug development. Mem Inst Oswaldo Cruz. 117, e200501(2022).
- Youn, H., Hong, K. -J. In vivo noninvasive small animal molecular imaging. Osong Public Health Res Perspect. 3 (1), 48-59 (2012).
- Refaat, A., et al. In vivo fluorescence imaging: success in preclinical imaging paves the way for clinical applications. J Nanobiotechnology. 20 (1), 450(2022).
- Pirovano, G., Roberts, S., Kossatz, S., Reiner, T. Optical imaging modalities: Principles and applications in preclinical research and clinical settings. J Nucl Med. 61 (10), 1419-1427 (2020).
- Branchini, B. R., Southworth, T. L., Khattak, N. F., Michelini, E., Roda, A. Red- and green-emitting firefly luciferase mutants for bioluminescent reporter applications. Anal Biochem. 345 (1), 140-148 (2005).
- Zhao, H., et al. Emission spectra of bioluminescent reporters and interaction with mammalian tissue determine the sensitivity of detection in vivo. J Biomed Opt. 10 (4), 041210(2005).
- O'Neill, K., Lyons, S. K., Gallagher, W. M., Curran, K. M., Byrne, A. T. Bioluminescent imaging: a critical tool in pre-clinical oncology research. J Pathol. 220 (3), 317-327 (2010).
- Mennel, L., et al. A photosensor employing data-driven binning for ultrafast image recognition. Sci Rep. 12 (1), 14441(2022).
- Yoo, Y., Im, J., Paik, J. Low-light image enhancement using adaptive digital pixel binning. Sensors. 15 (7), 14917-14931 (2015).
- Moraes, C. B., et al. Accelerating drug discovery efforts for trypanosomatidic infections using an integrated transnational academic drug discovery platform. SLAS Discov. 24 (3), 346-361 (2019).
- Sebaugh, J. L. Guidelines for accurate EC50/IC50 estimation. Pharm Stat. 10 (2), 128-134 (2011).
- Kim, S., et al. PubChem 2023 update. Nucleic Acids Res. 51, D1 D1373-D1380 (2023).
- Sharma, V., McNeill, J. H. To scale or not to scale: the principles of dose extrapolation. Br J Pharmacol. 157 (6), 907-921 (2009).
- Barrow, J. C., Lindsley, C. W. The importance of PK-PD. J Med Chem. 66 (7), 4273-4274 (2023).
- Langford, D. J., et al. Coding of facial expressions of pain in the laboratory mouse. Nat Methods. 7 (6), 447-449 (2010).
- Lewis, M. D., Kelly, J. M. Putting infection dynamics at the heart of Chagas disease. Trends Parasitol. 32 (11), 899-911 (2016).
- Brener, Z. Therapeutic activity and criterion of cure on mice experimentally infected with Trypanosoma cruzi. Rev Inst Med Trop Sao Paulo. 4, 389-396 (1962).
- Cummings, K. L., Tarleton, R. L. Rapid quantitation of Trypanosoma cruzi in host tissue by real-time PCR. Mol Biochem Parasitol. 129 (1), 53-59 (2003).
- Keppler, A., Grebnev, G., Reis, Y. Global BioImaging. , . (2024).
- Pfander, C., et al. Euro-BioImaging - Interdisciplinary research infrastructure bringing together communities and imaging facilities to support excellent research. iScience. 25 (2), 103800(2022).
転載および許可
このJoVE論文のテキスト又は図を再利用するための許可を申請します
許可を申請さらに記事を探す
This article has been published
Video Coming Soon
Copyright © 2023 MyJoVE Corporation. All rights reserved