Method Article
Pharmacological Validation of the Prepulse Inhibition of Startle Response in Larval Zebrafish using a Commercial Automated System and Software
In This Article
Summary
Here we describe a protocol that utilizes commercially available automated systems to pharmacologically validate the prepulse inhibition (PPI) assay in larval zebrafish.
Abstract
While there is an abundance of commercial and standardized automated systems and software for performing the prepulse inhibition (PPI) assay in rodents, to the best of our knowledge, all PPI assays performed in the zebrafish have, until now, been done using custom made systems which were only available to individual groups. This has thereby presented challenges, particularly with regard to issues of data reproducibility and standardization. In the present work, we generated a protocol that utilizes commercially available automated systems to pharmacologically validate the PPI assay in larval zebrafish. Consistent with published findings, we were able to replicate the results of apomorphine, haloperidol and ketamine on the PPI response of 6 days post-fertilization zebrafish larvae.
Introduction
The zebrafish (Danio rerio) larva is a suitable candidate for modelling psychiatric diseases such as schizophrenia (reviewed by Gawel et al.1) because of the numerous advantages it possesses. These include a fully sequenced genome with 70% sequence homology to human orthologues2, existence of forward and reverse genetic tools to manipulate the genome and to identify the contribution of a given gene towards development or disease3, and the presence of major human/rodent neurotransmitters in the zebrafish brain4. There is an availability of several neuro-phenotypic domains in zebrafish, such as anxiety, learning and memory3. Optical transparency and sensitivity to the major classes of neurotropic drugs makes it an ideal candidate of choice for pharmacological manipulations and phenotypic drug screening5,6.
To perform high throughput drug screening, automation and the presence of a robust endophenotype is highly important7. For instance, a variety of automatic recording techniques have been developed for measuring larval zebrafish behavior such as thigmotaxis, startle response, optokinetic response, optomotor response, habituation, prey capture, sleep/wake behavior, locomotor behavior and several others6. While some laboratories develop custom-built systems for automated measurements and analysis of some of these behaviors, there are commercially available imaging and software systems8,9,10,11. Prepulse inhibition (PPI), a form of sensorimotor gating in which the startle response is reduced when a weak non-startling stimulus is presented briefly before the startling stimulus, has been used as an endophenotype for studying schizophrenia in animal models (reviewed by12,13). In addition, acoustic startle response (ASR) and PPI have played useful roles in studying hearing and auditory function in animal models including the zebrafish14,15. The larval zebrafish displays a characteristic C-start in response to an unexpected startling stimulus that is lessened by a weaker stimulus called the prepulse. The C-start has long been described as an escape behavior controlled by distinct neural cell populations and has been thoroughly characterized in the larval zebrafish15,16,17.
There is an abundance of commercial and standardized automated systems and software for performing the PPI assay in rodents18,19,20. However, to the best of our knowledge, all the PPI assays performed in the zebrafish until now have been done using custom made systems which are only available to the individual groups15,16,21,22. This presents challenges for achieving data reproducibility and replicability with regard to standardization23.
Recently, a known vendor in the zebrafish community developed a set-up embedded with a fast camera and PPI generator add-ons to carry out the PPI assay in larval zebrafish24. The camera records at 1000 frames per second which enables the recording of fast acting behaviors such as the C-start, while the PPI generator allows for user-controlled delivery of various acoustic stimuli to evoke a startle response24. Here, we combine the aforementioned system with a commercially available comprehensive software package designed for the automated analysis of complex behaviors11, to generate a protocol for performing PPI response assays in larval zebrafish. We pharmacologically validate the PPI response using 1) apomorphine, a dopamine agonist known to cause deficits in PPI; 2) haloperidol, a dopamine antagonist and antipsychotic known to enhance PPI and 3) ketamine, a NMDA receptor antagonist known to modulate PPI.
Protocol
All animal experiments were approved by the Norwegian Food Safety Authority experimental animal administration’s supervisory and application system (FOTS-18/106800-1).
1. Zebrafish husbandry
- Set up matings of wild type adult male and female zebrafish (Danio rerio) stocks, maintained under standard conditions25 the evening before. Here, Tupfel long-fin (TL) strain is used.
- Remove barriers the next morning and allow to mate through natural spawning.
- Collect eggs out of the mating tanks.
- Remove unfertilized eggs and other debris, then transfer eggs to petri dishes (n = 60) and raise in an incubator at 28 °C in embryo medium: 1.5 mM HEPES, pH 7.6, 17.4 mM NaCl, 0.21 mM KCl, 0.12 mM MgSO4, and 0.18 mM Ca(NO3)2.
- Renew half of the embryo medium and remove dead larvae daily until 6 dpf.
NOTE: All experiments were performed on individual larvae at 6 days post-fertilization (dpf).
2. Pharmacological agents and pre-treatment of larvae
- Dissolve apomorphine and ketamine in E3 medium to make 500 µM and 10 mM stock solutions respectively.
- Dissolve haloperidol in 100% dimethyl sulfoxide (DMSO) to make a 10 mM stock solution. The final concentration of DMSO used was 0.1%.
- Use 0.1% DMSO and E3 medium as vehicle controls.
- Use the following final concentrations of drugs: 10 mg/mL of apomorphine, 1 mM ketamine and 20 µM haloperidol16.
- Pre-expose the apomorphine and ketamine groups larvae for 10 min and the haloperidol and DMSO vehicle control groups for 20 min16.
3. Setup prior to the behavior test
- On the day of the experiment, transfer larvae and all relevant materials into the experiment room. Set the experiment room to a temperature of 27 ± 1 °C.
- Ensure that the background noise in the test chamber is as low as possible, preferably not more than 45 dB sound pressure level (SPL).
- Install the sonometer microphone of the decibel (dB) meter in the test chamber (the opening for installation is already bored by the manufacturer).
- To reduce the background noise in the room, insulate the test chamber with a custom-built sound booth (see Figure 1B for an overview of the set-up).
- Prepare a 96-well plate for the prepulse inhibition test.
NOTE: The video camera has a 2048 × 500 pixel resolution, meaning only a maximum of 3 lanes (33 wells) can be imaged at a time.- Use a custom-made acrylic plate of 96-well format to reduce interference from shadows.
NOTE: The measurements for the custom plate can be found at the following website: https://zenodo.org/record/3739378#.XooyLW5uKas
- Use a custom-made acrylic plate of 96-well format to reduce interference from shadows.
- With the aid of a transfer pipette, transfer 310 µL of exposure solution/medium with one larva into each well.
- Calibrate and measure the stimulus intensity using the volume knob of the stereo amplifier and a decibel meter respectively.
- Register the maximum sound intensity in the “level reference” section.
4. Stimulus parameters and video acquisition
- Turn on the computer, the amplifier system and the dB meter (see Figure 1A for an overview of set-up).
- Use the volume knob by turning it to minimum or maximum to adjust the sound intensity.
- Check the sound level with the dB meter each time, the volume knob is adjusted. This is important in finding the maximum and minimum sound intensity that can be produced by the set-up.
NOTE: The dB meter computes the RMS dB output for the stimulus. The system generates the sound inside the solid components of the test-chamber, keeping the plate firm while producing a vibration in the horizontal plane of the entire plate support.- Adjust the volume knob to maximum, measure the sound intensity with the dB meter and use this value.
- Check the sound level with the dB meter each time, the volume knob is adjusted. This is important in finding the maximum and minimum sound intensity that can be produced by the set-up.
- On the interface of the PPI generator, define the parameters: inter-stimulus interval represented as Delay; inter-trial interval represented as Acquisition delta time; duration of prepulse etc.
- For prepulse alone trials, ensure that the “Amplitude” or Duration of stimulus for Startle parameters are set to zero and vice versa for startle alone trials.
- To generate a trial list, select Add > give a name to the trial. For example, “Prepulse 50 dB alone”.
NOTE: One can generate as many trials as desired, but be careful of how long the list is since this can crash the program.- Interleave prepulse trials with pulse alone trials in all PPI experiments using a pseudorandom order. Where multiple stimuli are presented in an experiment, an inter-trial interval (ITI) of 30 s is used.
NOTE: In this study, a 100 ms startle stimulus (pulse) of 660 Hz, and 5 ms prepulse stimuli of 440 Hz were used. For PPI experiments, inter-stimulus interval (ISI) was 100 ms.
- Interleave prepulse trials with pulse alone trials in all PPI experiments using a pseudorandom order. Where multiple stimuli are presented in an experiment, an inter-trial interval (ITI) of 30 s is used.
- To save the protocol, select File > Save as.
- Adjust lighting conditions in the test-chamber as follows.
- Launch USB measurement computing, select analog out then go to D/A OUT O (P13) to make changes to the lighting. A value of zero means no light while increasing the D/A OUT O value, increases the intensity of light in the box. Light intensity of 100 was used for all experiments.
- Set-up the camera
- Launch the software and wait for the camera to load.
- Select Adjustments (found on right-hand side) and set the acquisition frame rate to 1,000 then click apply to effect the change.
- Acclimate larvae to a 100% light illuminated test chamber for 5 min before the experiments are started.
- To begin an experiment, select the Experiment menu on the PPI generator, click Run and the select well format (e.g., 33 wells).
- Always make sure that the camera software is launched with the right settings before running an experiment.
- Acquire a 2 s video for each trial.
- Make sure that the acquisition frame rate is set at 1,000.
5. Automated tracking and analysis of acoustic startle response and PPI
- Protocol setup.
- Launch the analysis software (see the Table of Materials). Choose New from template > Apply a predefined template and then go through other menus (details below).
- Choose from video file under Video Source.
- Browse video file. Set subject as fish > zebrafish larvae > zone template (no template). Specify Number of arenas under Arenas.
- Specify Number of subjects per arena (set as 1) under Subjects.
- Select Center-point, nose-point and tail-base detection under Tracked Features (see Figure 2A,B).
NOTE: This is important to calculate the body angle of the C-start response (see Figure 2C). - Click Name > save as. Units used are mm, s, deg for distance, time and rotation respectively.
NOTE: Remember to use the same unit for calibrating the scale.
- Choose Arena setting.
- Click Grab background image.
- Go through the steps on the right-hand menu (if in doubt, use the Help menu).
- Choose the circle drawing tool to draw the arenas.
- Choose Trial control settings > create new > name.
- Choose Detection settings, go through the steps on the right-hand menu.
- Set sample rate to 25. Choose advanced detection settings. Under Method, select dynamic subtraction, advanced model/adult fish, then set Subject color compared to background as Darker and move the slider to define the larva’s contrast.
- Under subject contour, select erode first, then dilate and increase the contour erosion and dilation values until the animal is completely detected.
- Save the protocol and use for subsequent analyses of PPI videos acquired.
- Launch the analysis software (see the Table of Materials). Choose New from template > Apply a predefined template and then go through other menus (details below).
- Trial list setup.
- Choose trial list, define independent variables such as larval ID, treatment, stimulus type, etc. Select the path of videos and define a list of trials for batch acquisition.
- Acquisition setup.
NOTE: If a trial list has been generated, one can perform a batch acquisition of the videos.- If some tracks are lost, use the track editor to adjust the tracked features.
- Exclude from analysis, the tracking errors that remain unresolved after using the track editor.
- Set track smoothing profile to 1 mm to decrease noise from data. This can be adjusted based on the background activity of larvae.
- Analysis setup.
- To select trials to be analyzed, choose Data profiles and define tracks based on the independent variable of interest.
NOTE: If components are hidden, click on the eye symbol to the upper right-hand corner to display.- Filter parts of trials to be analyzed (e.g., based on treatment or type of stimulus group).
- Select part of the tracks to be analyzed (nesting). For this study, data was nested for tracks between onset of stimulus and 100 ms after stimulus onset.
- Remember to connect all filters and nesting boxes with arrow lines to complete the instruction.
- Define dependent variables to be analyzed, select Analysis profiles and specify the variables of interest (focus on Body under dependent variables).
NOTE: If components are hidden, click on the eye symbol to the upper right-hand corner to display.- Double click Body angle. Select absolute bend. Go through Trial settings and select maximum, then click on add.
- Double click body angle state. Set averaging interval to 5 samples. Set bend angle threshold. To calculate statistics for bent, go through Trial statistics and select latency to first > add. Repeat steps until varying thresholds are obtained (between 20–80° was used) and name accordingly.
- Generating statistics and charts.
- Choose analysis > results > statistics & charts, then click calculate.
- Make sure the data and analysis profiles are set to the right template since several templates can be made under each section.
- Export trial and group statistics as spreadsheet files for processing and analysis.
- To select trials to be analyzed, choose Data profiles and define tracks based on the independent variable of interest.
6. Data analysis
- Open the spreadsheet file containing the trial statistics.
- Select the columns Body angle Maximum deg, Bent latency (of the various body angle thresholds).
- Consider every change in body angle ≥ 30° within a cut-off latency of 50 ms after stimulus onset as a positive C-start response (i.e., a responder); those with < 30° body angle are non-responders.
- In a binary fashion, assign 1 to a responding larva and 0 to non-responding larvae for each plate.
- Count the total number of responders and non-responder larvae for each plate. Calculate the responders (%) in each case calculated as (number of larvae responding/total number of larvae) × 100. Exclude larvae that respond less than 30% to the startle stimulus from the analysis16.
NOTE: Any stimulus intensity capable of eliciting a C-start response in equal to or more than 70% of the larvae is considered a suitable startle stimulus16.
- Count the total number of responders and non-responder larvae for each plate. Calculate the responders (%) in each case calculated as (number of larvae responding/total number of larvae) × 100. Exclude larvae that respond less than 30% to the startle stimulus from the analysis16.
- Calculate %PPI as 100 × (percentage responding to startle stimulus − percentage responding to prepulse + startle sequence)/ (percentage responding to startle stimulus)16.
7. Statistical analysis
- Present data as the mean ± standard deviation, S.D. (see the Table of Materials for statistical software).
- Determine the effects of varying prepulse intensities on larval response using one-way ANOVA followed by a Tukey’s post-hoc test.
- Use two-way ANOVA followed by Holm-Sidak’s post-hoc test to determine the effects of drug treatment on % PPI response with varying prepulse intensities.
Results
Three experiments were performed to validate the protocol of combining multiple systems to analyze prepulse inhibition of acoustic startle response in the larval zebrafish. First, the ability to accurately deliver acoustic stimuli and to capture the response of larvae to the startle stimulus was tested. Next, was validating the ability to attenuate startle response when a prepulse stimulus is presented. Finally, the ability to detect the pharmacological modulation of prepulse inhibition of the startle response by the drugs apomorphine, haloperidol and ketamine was established.
Larval zebrafish response to acoustic startle stimuli
Previous work has demonstrated that larval zebrafish display a characteristic C-start when presented with startling acoustic stimulus16. The ability to incite and capture the behavior of larvae to the startle stimuli was tested. Recorded larvae were observed to display the C-start response (Figure 2). A stimulus of 70 dB re (100 ms, 660 Hz, Supplementary Figure 1A) was strong enough to elicit response in ≥70% of the larvae (Figure 3A). When repeatedly presented 30 times at an inter-trial interval of 30 s, the 70 dB re stimulus did not result in larval habituation (N = 3 replicates; 16 larvae/replicate), as shown in Figure 3B.
Prepulse decreases startle response of larval zebrafish to acoustic stimuli
A plethora of evidence shows that prepulse stimuli modulates larval response to a startle stimulus15,21,22,26. A two-pulse paradigm was used, where a weak stimulus called the prepulse preceded the startle-inducing stimulus called the pulse. The prepulse stimuli used were either 20, 17, or 14 dB less than the pulse stimulus that was set at 70 dB re. The prepulse (5 ms, 440 Hz) was always presented 100 ms before the pulse onset (Supplementary Figure 1B). Each tested prepulse stimulus significantly reduced larval response to the pulse. In Figure 4 the larval response (in %) to acoustic startle stimuli is shown for 6 dpf TL in E3 medium, N = 6 (16 larvae/group). The percentage of larvae responding to the startle stimulus (pulse) was 79.86 ± 9.772. Expectedly, when the startle stimulus was preceded by either a 50, 53 or 56 dB prepulse, the larval response decreased to 40.87% ± 11.30%, 39.58% ± 7.345% and 29.17% ± 9.350% respectively. One-way Anova analysis revealed a statistical difference in stimulus effect on larvae (F (3, 48) = 57.23, P < 0.0001) with Tukey’s multiple comparisons test revealing statistical significance across groups at 95% confidence interval.
Pharmacological modulation of prepulse inhibition
Earlier studies showed that the dopaminergic drugs, apomorphine and haloperidol, as well as the glutamatergic drug, ketamine, significantly modulated prepulse inhibition in larvae just as in their mammal and rodent equivalents16. Concentrations for validation of the set-up were selected based on these studies. The inter-stimulus interval (ISI) for all the pharmacological experiments was 100 ms.
Effect of apomorphine on prepulse inhibition
In Figure 5, larvae pretreated with 10 mg/mL apomorphine for 10 min displayed an overall reduction in % PPI compared to E3 control larvae (two-way ANOVA, non RM (factors: treatment and prepulse intensities; treatment: F (1, 34) = 16.21, p = 0.0003; prepulse intensity: F (2, 34) = 8.674, P = 0.0009, this showed a non-significant interaction: F (2, 34) = 2.514, p = 0.0959). To investigate the differences in more detail, Holm-Sidak’s post-hoc test revealed significant differences in the startle response between E3 control and apomorphine treated larvae at prepulse intensities 53 (p = 0.0126) and 56 (p = 0.0044) but not at 50 dB (p = 0.5813).
Effect of haloperidol on prepulse inhibition
Figure 6 shows an overall increase in %PPI in larvae pretreated for 20 min with 20 µM haloperidol compared to those in E3 medium (two-way ANOVA, non RM (factors: treatment and prepulse intensities; treatment: F (1, 32) = 20.75, p < 0.0001; prepulse intensity: F (2, 32) = 3.147, p = 0.0565, with no significant interaction: F (2, 32) = 0.7455, p = 0.4826). Using the Holm-Sidak’s post-hoc test, presence of statistical significance was observed only at prepulse intensities 53 (p = 0.00489 and 56 (p = 0.0348) but not at 50 dB (p = 0.067).
Effect of ketamine on prepulse inhibition
Figure 7 shows that at different prepulse stimulus intensities, there were differences in the startle response between E3 control larvae and those pretreated for 10 min in 1.0 mM ketamine (two-way ANOVA, non RM (factors: treatment and prepulse intensities; treatment: F (1, 35) = 25.46, p < 0.0001; prepulse intensity: F (2, 35) = 6.018, p = 0.0057, with no significant interaction: F (2, 35) = 0.8450, p = 0.4381). Holm-Sidak’s post-hoc test, showed significance only at prepulse intensities of 50 (p = 0.0039) and 53 (p = 0.0027), but not at 56 dB (p = 0.0802).
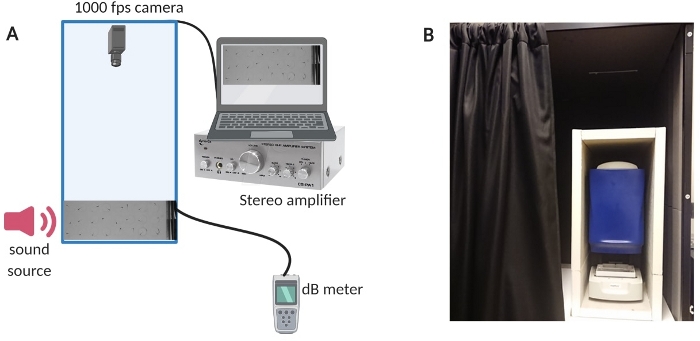
Figure 1: Testing apparatus. (A) Overview of equipment set-up. (B) In-house insulation of the set-up equipment to minimize background noise during experiments. Please click here to view a larger version of this figure.
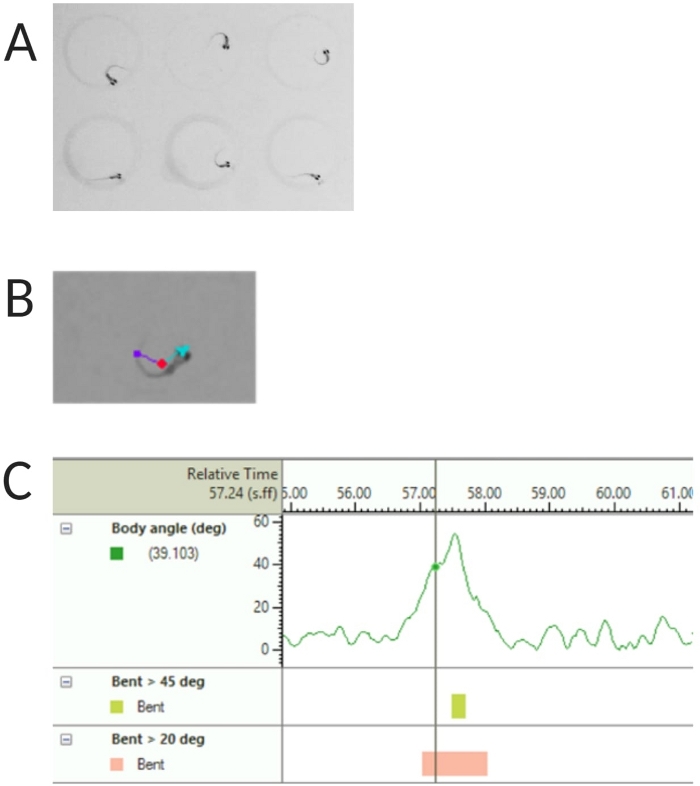
Figure 2: Analysis of the larval zebrafish acoustic startle response. (A) Characteristic C-start displayed by 6 zebrafish larvae at 6 dpf. (B) Representative image of the three tracked features superimposed on a 6 dpf larva: center-point (red), nose-point (cyan) and tail-base (purple). (C) Representative image of the absolute bend angle displayed by a 6-dpf TL wild type larvae. Please click here to view a larger version of this figure.
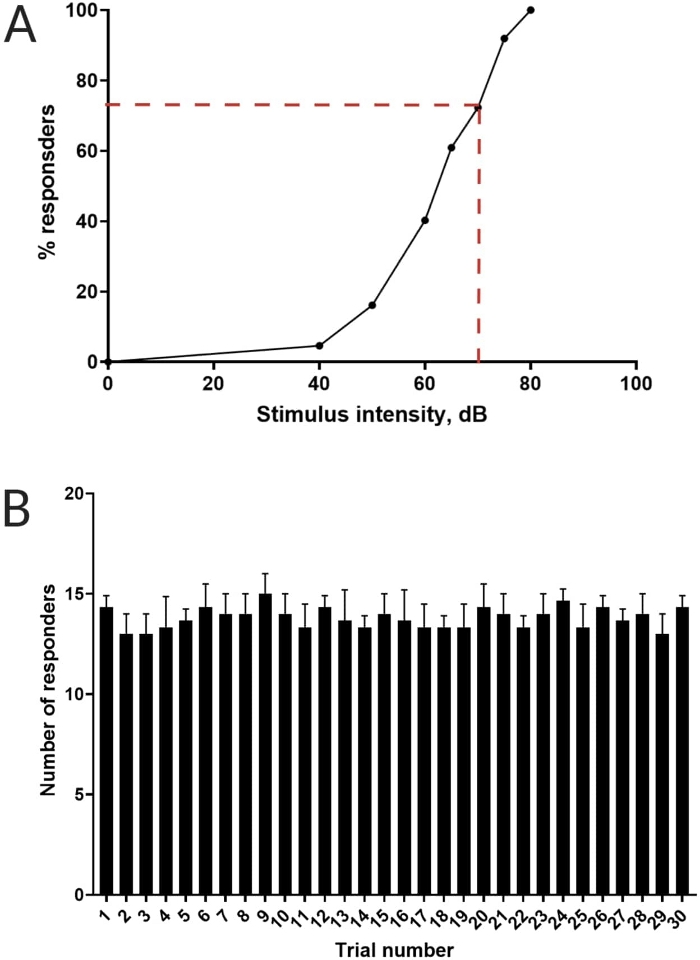
Figure 3: Determination of acoustic startle threshold. (A) A stimulus intensity of 70 dB (represented by red dash lines) is capable of eliciting a C-start response in >70% of larvae (N = 33; 6 dpf TL). (B) Larvae do not habituate to 70 dB re stimulus presented 30 times (trials) at an inter-trial interval of 30 s (N = 3 replicates; 16 larvae/replicate). Data are presented as mean ± S.D. Please click here to view a larger version of this figure.
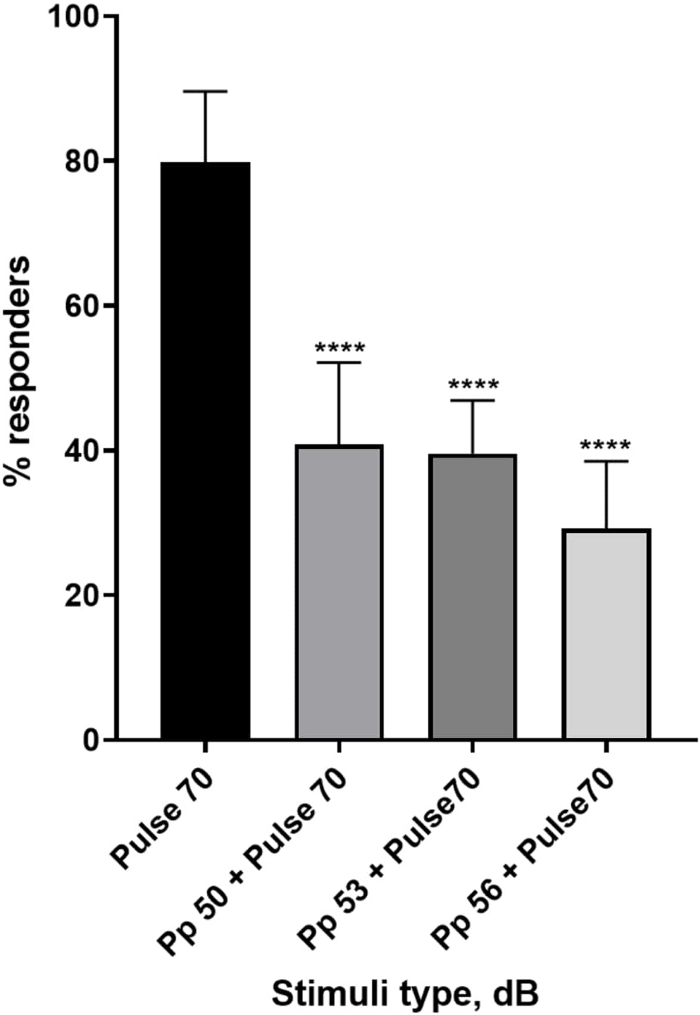
Figure 4: Pre-pulse-induced decrease in larval response (%). Pre-pulse stimuli at 20, 17 and 14 dB lower than the 70 dB re startling stimulus cause a reduction in the number of wild type TL larvae C-start responders. All data represented as mean ± S.D., N = 5 (16 larvae/group), ****p < 0.0001, significantly different from startle stimulus by Tukey’s post-hoc test after one-way ANOVA. Please click here to view a larger version of this figure.
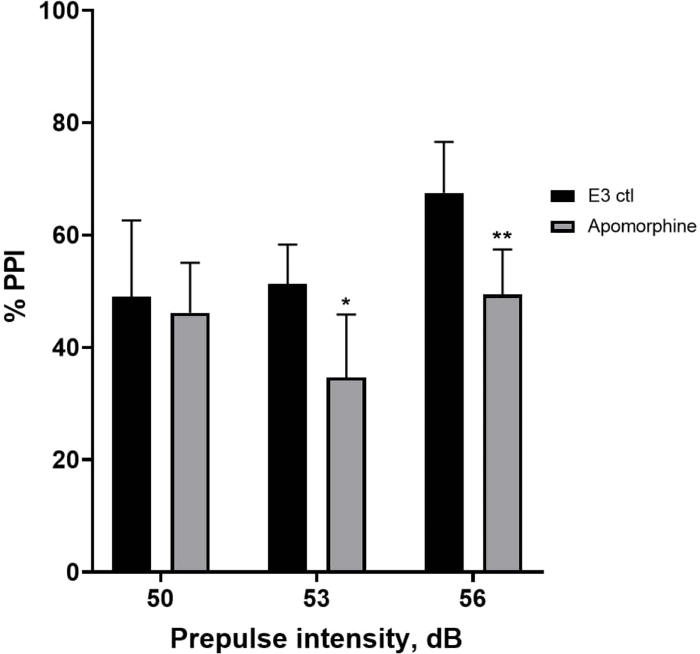
Figure 5: Apomorphine induced deficits in %PPI. All data are presented as mean ± S.D., N = 4‒5 (16 larvae/group), statistically significant difference by Holm-Sidak’s post-hoc test after two-way ANOVA. *p = 0.0126, E3 ctl/apomorphine treated group at 53 dB; **p = 0.0044, E3 ctl/apomorphine treated group at 56 dB. Please click here to view a larger version of this figure.
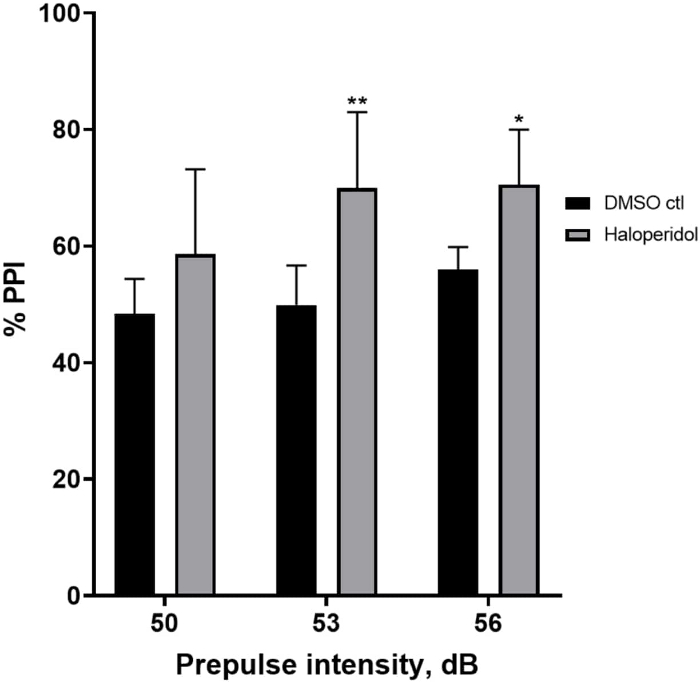
Figure 6: Haloperidol induced enhancement in %PPI. All data are presented as mean ± S.D., N = 4‒5 (16 larvae/group), statistically significant difference by Holm-Sidak’s post-hoc test after two-way Anova. **p = 0.0048, DMSO ctl/apomorphine treated group at 53 dB; *p = 0.0348, DMSO ctl/apomorphine treated group at 56 dB. Please click here to view a larger version of this figure.
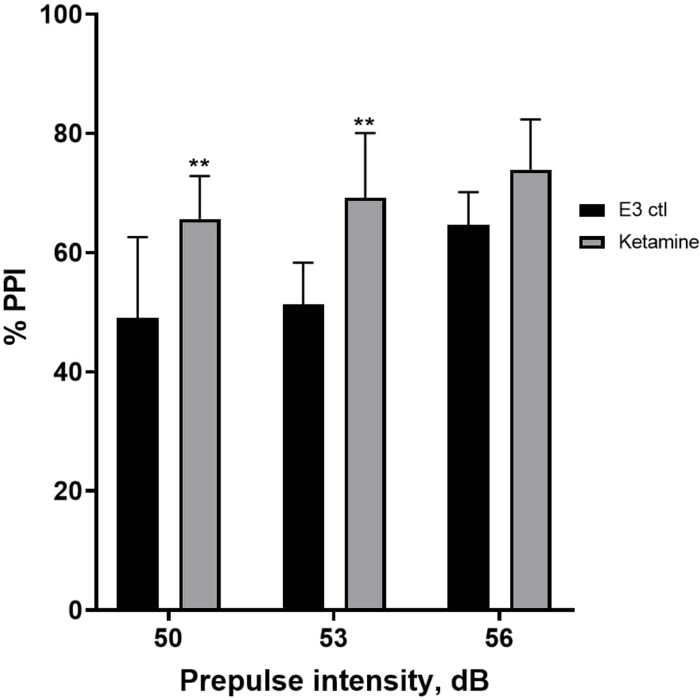
Figure 7: Ketamine induced enhancement in %PPI. All data represented as mean ± S.D, N = 4‒5 (16 larvae/group), statistically significant difference by Holm-Sidak’s post-hoc test after two-way Anova **p = 0.0039, E3 ctl/apomorphine treated group at 50 dB, **p = 0.0027, E3 ctl/apomorphine treated group at 53 dB. Please click here to view a larger version of this figure.
Supplementary Video 1: Representative video of larvae displaying a C-start in response to 70 dB acoustic startle stimulus. Please click here to download this video.
Supplementary Figure 1: Representative examples of generated stimulus conditions using the PPI generator. (A) Stimulus alone trial, (B) pre-pulse inhibition trial (pre-pulse + pulse), (C) no stimulus trial to measure threshold baseline bend angle of unstimulated larvae. Please click here to download this figure.
Discussion
It is essential to validate any new behavioral assay system with the aim of improving and refining protocols for neurobehavioral research. In the current investigation, the ability of two commercially available systems and software to induce an acoustic startle response in zebrafish larvae and to detect and quantify previously described pharmacological modulation of such behaviors were assessed.
A number of modifications and troubleshooting were performed to optimize the set-up. The default software for analysis of C-start responses was such that analysis automatically proceeded after the data for every experiment was acquired (22 trials/plate constituted an experiment). This reduced the number of plates that could be run per day, thus reducing the throughput (5 plates per day). To avoid this limitation, there was a need to de-couple the analysis software from the data collection process, which increased the throughput to an average of 10 plates per day. Thus, the decision to turn to an independent analysis software for non-live analysis proved successful and more efficient. To avoid interference from shadows or other debris which introduces noise to the data, it is recommended to fill wells completely with medium, remove all bubbles and avoid food particles or similar which can be mistaken for larvae, thereby generating noise in the data. After calibration of the sound stimuli, the maximum intensity reachable by the amplifier system as captured by the dB meter was 85 dB re, while the initial background noise in the testing chamber was 60 dB re. This resulted in a narrow dB window in which to operate. Hence, it was critical to keep background noise as minimal as possible. To achieve this, parafon acoustics material (see Table of Materials) was used to build an additional layer of insulation around the test-chamber and an extra layer of insulation using a vocal booth bundle (see Table of Materials). With these layers of insulation, the background noise inside the testing chamber was successfully reduced from the initial 60 dB to 45 dB re.
Currently, one advantage of this set-up is that all the components are commercially available and as such, not limited to only a few labs. Individuals with limited knowledge in coding language can use it, as the protocol is rather easy to understand and follow. For example, by using the PPI system, it was possible to deliver pulses and pre-pulses at varying inter-stimulus and inter-trial intervals, as well as capture larval responses to such stimuli. Once these behaviors were captured, they could be classified using the analysis software into responders and non-responders. The responder group was categorized as larvae that displayed a C-start of 30° or more at a latency of <50 ms. In addition, the PPI response is modulated by drugs that target dopaminergic and glutamatergic signaling (reviewed by Geyer and colleagues27). Consistent with previous studies, apomorphine, a non-selective dopamine receptor agonist, reduced the pre-pulse inhibition of startle response in larval zebrafish, while haloperidol a dopamine antagonist enhanced the response. In larval zebrafish, ketamine has been shown to modulate PPI differentially based on the duration of the ISI16. In the aforementioned study, larval PPI was enhanced at 30 ms but suppressed at 500 ms ISI when pre-treated with ketamine. Although this study did not use variable ISI, the observation that ketamine enhanced PPI at an ISI of 100 ms, makes it comparable with the previous study’s data when an ISI of 30 ms was used. The study demonstrated that by combining these commercially available systems, it is possible to perform the PPI assay and to reliably detect pharmacologically induced changes in the zebrafish larval PPI response. A limitation of the system is that the nose-point feature tracked by the analysis software always falls on one of the eyes of the larvae, thereby creating a baseline angle. To overcome this, it is necessary to always determine the baseline bend angle of unstimulated larvae, which was found to be ~30° for larvae used in this study. Thus, forming the basis for the choice of 30° as the threshold of what was considered a positive C-start response in startled larvae. If these points are taken into account, it should be possible to perform the PPI assay in any lab with access to the set-up equipment. This paper did not focus on categorizing the kinematics of startle response into short latency and long latency as reported earlier16, due to the scope of the variability of latency. Hence, only C-start responses <50 ms after stimulus onset were used15.
Strain differences have been reported to influence zebrafish behavior in several assays28,29,30,31 as well as influence hearing sensitivity32. Hence, it is essential to determine the baseline bend angle of each strain tested. Since hearing sensitivities may also be different, it is crucial to determine baseline startle responses, the sound intensity most suited as either prepulse or startle stimulus for each strain and at what duration the stimulus is presented. The ISI is another parameter that should be carefully considered because some drugs can either enhance or reduce PPI based on the interval between the prepulse and startle stimulus onset16. The expectation is that, laboratories interested in studying cognitive function, neuropsychiatric disorders and hearing (auditory function) will find this PPI set-up and protocol useful in screening their pharmacological and/or genetic models. This protocol also provides a basis for high-throughput screening of compound libraries.
Disclosures
The authors declare no competing financial interests.
Acknowledgements
We thank Ana Tavara and João Paulo R. P. Santana for excellent fish care and invaluable help with testing and setting up of the soundproof booths, and Dr. Wietske van der Ent for initial support with setting up the EthoVision software. This study was funded by the Research Council of Norway (ISP, BIOTEK2021/ DigiBrain).
Materials
| Name | Company | Catalog Number | Comments |
| Apomorphine | Sigma Aldrich | A4393 | Dopamine agonist |
| dB meter | PCE instruments | PCE-MSM 4 | For measuring stimulus intensity |
| DMSO | Sigma Aldrich | D8418 | For dissolving organic solutes |
| Dynavox Amplifier | Dynavox | CS-PA1 MK | For delivering acoustic stimuli |
| EthoVision XT | Noldus, Netherlands | EthoVision XT, version 14 | Automated tracking software |
| GraphPad Prism | GraphPad Software | Version 8 | Statistical analysis software |
| Haloperidol | Sigma Aldrich | H1512 | Dopamine antagonist |
| Ketamine | Sigma Aldrich | Y0000450 | NMDA receptor antagonist |
| parofon acoustics materials | Paroc | 8528308 | Helps reduce background noise in the test cabinet |
| t.akustik Vocal Booth Bundle | Thormann, Germany | 458543 | Helps reduce background noise in the test cabinet |
| ZebraBox Revo with PPI add-ons | ViewPoint, France | ZebraBox Revo with PPI add-ons | Includes hardware and software |
References
- Gawel, K., Banono, N. S., Michalak, A., Esguerra, C. V. A critical review of zebrafish schizophrenia models: Time for validation. Neuroscience & Biobehavioral Reviews. 107, 6-22 (2019).
- Howe, K., et al. The zebrafish reference genome sequence and its relationship to the human genome. Nature. 496 (7446), 498-503 (2013).
- Kalueff, A. V., Stewart, A. M., Gerlai, R. Zebrafish as an emerging model for studying complex brain disorders. Trends in Pharmacological Sciences. 35 (2), 63-75 (2014).
- Panula, P., et al. The comparative neuroanatomy and neurochemistry of zebrafish CNS systems of relevance to human neuropsychiatric diseases. Neurobiology of Disease. 40 (1), 46-57 (2010).
- Kokel, D., Peterson, R. T. Chemobehavioural phenomics and behaviour-based psychiatric drug discovery in the zebrafish. Briefings in Functional Genomics and Proteomics. 7 (6), 483-490 (2008).
- Basnet, R. M., Zizioli, D., Taweedet, S., Finazzi, D., Memo, M. Zebrafish Larvae as a Behavioral Model in Neuropharmacology. Biomedicines. 7 (1), 23 (2019).
- Henry, J., Wlodkowic, D. Towards High-Throughput Chemobehavioural Phenomics in Neuropsychiatric Drug Discovery. Marine Drugs. 17 (6), (2019).
- . Behavioural measurement system | Laval zebrafish | Drosophila | Daphnia | insects | Products | Zantiks Available from: https://zantiks.com/products/zantiks-mwp (2020)
- . Observation chamber for zebrafish research - DanioVision Available from: https://www.noldus.com/daniovision/observation-chamber (2020)
- . EthoVision XT - Video tracking software | Noldus Available from: https://www.noldus.com/ethovision-xt (2020)
- Gould, T. D., Gottesman, I. I. Psychiatric endophenotypes and the development of valid animal models. Genes, Brain and Behavior. 5 (2), 113-119 (2006).
- van den Buuse, M. Modeling the Positive Symptoms of Schizophrenia in Genetically Modified Mice: Pharmacology and Methodology Aspects. Schizophrenia Bulletin. 36 (2), 246-270 (2010).
- . Acoustic startle modification as a tool for evaluating auditory function of the mouse: Progress, pitfalls, and potential. Abstract - Europe PMC Available from: https://europepnc.org/article/PMC/5446932 (2020)
- Bhandiwad, A. A., Zeddies, D. G., Raible, D. W., Rubel, E. W., Sisneros, J. A. Auditory sensitivity of larval zebrafish (Danio rerio) measured using a behavioral prepulse inhibition assay. Journal of Experimental Biology. 216 (18), 3504-3513 (2013).
- Burgess, H. A., Granato, M. Sensorimotor Gating in Larval Zebrafish. Journal of Neuroscience. 27 (18), 4984-4994 (2007).
- Eaton, R. C., Farley, R. D., Kimmel, C. B., Schabtach, E. Functional development in the mauthner cell system of embryos and larvae of the zebra fish. Journal of Neurobiology. 8 (2), 151-172 (1977).
- SR-LAB - San Diego Instruments Startle Response. San Diego Instruments Available from: https://sandiegoinstruments.com/product/sr-lab-startle-response/ (2020)
- Startle packages - Med Associates Inc. Med Associates Inc Available from: https://www.med-associates.com/product-category/acoustic-startle-reflex-packages/ (2020)
- Startle response & Pre-pulse inhibition test. O'HARA & CO.,LTD Available from: https://ohara-time.co.jp/products/startle-response-pre-pulse-inhibition-test/ (2020)
- Thyme, S. B., et al. Phenotypic Landscape of Schizophrenia-Associated Genes Defines Candidates and Their Shared Functions. Cell. 177 (2), 478-491 (2019).
- Privat, M., et al. Sensorimotor Transformations in the Zebrafish Auditory System. Current Biology. 29 (23), 4010-4023 (2019).
- Gerlai, R. Reproducibility and replicability in zebrafish behavioral neuroscience research. Pharmacology Biochemistry and Behavior. 178, 30-38 (2019).
- Aleström, P., et al. Zebrafish: Housing and husbandry recommendations. Laboratory Animals. , (2019).
- Bhandiwad, A. A., Sisneros, J. A. Revisiting Psychoacoustic Methods for the Assessment of Fish Hearing. Fish Hearing and Bioacoustics: An Anthology in Honor of Arthur N. Popper and Richard R. Fay. , 157-184 (2016).
- Geyer, M. A., Krebs-Thomson, K., Braff, D. L., Swerdlow, N. R. Pharmacological studies of prepulse inhibition models of sensorimotor gating deficits in schizophrenia: a decade in review. Psychopharmacology. 156 (2-3), 117-154 (2001).
- Lange, M., et al. Inter-Individual and Inter-Strain Variations in Zebrafish Locomotor Ontogeny. PLOS ONE. 8 (8), 70172 (2013).
- Liu, X., et al. Strain-dependent differential behavioral responses of zebrafish larvae to acute MK-801 treatment. Pharmacology Biochemistry and Behavior. 127, 82-89 (2014).
- Loucks, E., Carvan, M. J. Strain-dependent effects of developmental ethanol exposure in zebrafish. Neurotoxicology and Teratology. 26 (6), 745-755 (2004).
- van den Bos, R., et al. Further characterisation of differences between TL and AB zebrafish (Danio rerio): Gene expression, physiology and behaviour at day 5 of the larval stage. PLOS ONE. 12 (4), 0175420 (2017).
- Monroe, J. D., et al. Hearing sensitivity differs between zebrafish lines used in auditory research. Hearing research. 341, 220-231 (2016).
Reprints and Permissions
Request permission to reuse the text or figures of this JoVE article
Request PermissionThis article has been published
Video Coming Soon
Copyright © 2025 MyJoVE Corporation. All rights reserved