
Aby wyświetlić tę treść, wymagana jest subskrypcja JoVE. Zaloguj się lub rozpocznij bezpłatny okres próbny.
Method Article
Simultaneous Quantification of T-Cell Receptor Excision Circles (TRECs) and K-Deleting Recombination Excision Circles (KRECs) by Real-time PCR
W tym Artykule
Podsumowanie
Here, we describe a method for simultaneous quantification of T-cell receptor excision circles (TRECs) and K-deleting recombination excision circles (KRECs). The TREC/KREC assay can be used as marker of thymic and bone marrow output.
Streszczenie
T-cell receptor excision circles (TRECs) and K-deleting recombination excision circles (KRECs) are circularized DNA elements formed during recombination process that creates T- and B-cell receptors. Because TRECs and KRECs are unable to replicate, they are diluted after each cell division, and therefore persist in the cell. Their quantity in peripheral blood can be considered as an estimation of thymic and bone marrow output. By combining well established and commonly used TREC assay with a modified version of KREC assay, we have developed a duplex quantitative real-time PCR that allows quantification of both newly-produced T and B lymphocytes in a single assay. The number of TRECs and KRECs are obtained using a standard curve prepared by serially diluting TREC and KREC signal joints cloned in a bacterial plasmid, together with a fragment of T-cell receptor alpha constant gene that serves as reference gene. Results are reported as number of TRECs and KRECs/106 cells or per ml of blood. The quantification of these DNA fragments have been proven useful for monitoring immune reconstitution following bone marrow transplantation in both children and adults, for improved characterization of immune deficiencies, or for better understanding of certain immunomodulating drug activity.
Wprowadzenie
T-cell receptor excision circles (TRECs) and K-deleting recombination excision circles (KRECs) are small circularized DNA elements that are excised in a proportion of T- and B-cells, respectively, during a genomic DNA recombination process, leading to the formation of a highly diversified repertoire of T- and B-cell receptors. They have no function, but because they are stable and cannot be replicated, they are diluted after each cell division, thus persisting only in one of the two daughter cells. Therefore, their levels in the peripheral blood can be assumed as an estimate of the thymic and bone marrow output.
While the TREC assay has been largely used over the last 15 years to evaluate the extent of thymic output,1 the KREC assay, which was initially developed to measure B-cell proliferation and its contribution to B-cell homeostasis in health and disease,2 has been only recently proposed as a marker of bone marrow output.3,4 Here, we describe the method we developed for the simultaneous quantification of both TRECs and KRECs.4
With this combined method, the variability associated to DNA quantification by real-time PCR is eliminated by the use of a unique standard curve obtained by diluting a triple-insert plasmid containing fragments of TRECs, KRECs and T-cell receptor alpha constant (TCRAC) gene in a 1:1:1 ratio. This allows a more accurate evaluation of the TREC and KREC copy number. Furthermore, the simultaneous quantification of the two targets in the same reaction allows reagent cost reduction.
The proposed TREC/KREC assay can be useful to measure the extent of T- and B-cell neo-production in children or adults with Severe Combined Immunodeficiency (SCID),4 Common Variable Immunodeficiency,5 autoimmune diseases,6-8 and HIV infection.9 Furthermore, it can be used to monitor the immune recovery after hematopoietic stem cell transplantation,10 enzyme replacement,11 and antiviral9 or immunomodulating therapies.6-8 Finally, because SCID patients are recognized using TREC assay despite the underlying genetic defects, and agammaglobulinemia patients can be identified using KREC quantification, the TREC/KREC assay can be also used to detect immunodeficiencies in newborn screening programs.12 In this case, the test must be performed on DNA extracted from small spots of blood blotted and dried on filter paper, must be highly sensitive and specific for the target diseases, as well as highly reproducible and cost-effective.
The introduction of KREC quantification in the test should improve performances of newborn screening for immunodeficiencies, which has routinely been performed in the some parts of the USA (WI, MA, CA) since 2008 when Wisconsin became the first to introduce the analysis of TRECs in its postnatal screening program.13
Access restricted. Please log in or start a trial to view this content.
Protokół
NOTE: Ethics statement: This protocol follows the guidelines of our institution, the Spedali Civili di Brescia
1. Preparation of a “Triple-Insert” Plasmid
- Selection and preparation of appropriate starting material:
- Obtain a sample containing cells very likely to have TRECs and KRECs detectable by PCR, such as peripheral blood of a young healthy subject collected into EDTA tubes.
NOTE: Originally, we had developed the method using thymocytes for TRECs and mononuclear cells from tonsil fragments for KRECs, but healthy subjects usually have an amount of TRECs and KRECs sufficient to allow their detection by PCR. Therefore, peripheral blood should be a valid alternative, easier to obtain and to work with. Considering that TRECs, in particular, decrease with age in healthy adults, peripheral blood from a young adult, if not from a children, is advised. - Separate peripheral blood mononuclear cells (PBMC) by a standard density gradient separation method.
- Obtain a sample containing cells very likely to have TRECs and KRECs detectable by PCR, such as peripheral blood of a young healthy subject collected into EDTA tubes.
- DNA extraction:
- Extract DNA from PBMC using a commercial DNA Blood Mini Kit. Follow the manufacturer’s instructions with the few modifications described below.
- Incubate the samples at 70 °C (instead of 56 °C) for 10 min using a shaker-incubator at 1,400 rpm.
- Add the elution buffer heated at 70 °C to the column, incubate for 5 min at 70 °C and elute DNA by centrifugation as per manufacturer’s instructions. Determine the extracted DNA concentration by spectrophotometric estimation at 260/280 nm.
- Extract DNA from PBMC using a commercial DNA Blood Mini Kit. Follow the manufacturer’s instructions with the few modifications described below.
- Preparation of a plasmid containing the inserts of TREC and KREC signal joints (SJ) and TCRAC reference gene:
- Amplify the DNA extracted from PBMC (to obtain the TREC-SJ, KREC-SJ, and TCRAC fragments) with primers specific for TRECs, KRECs and TCRAC (see Table 1).
NOTE: At the 5’-end, the KREC- and TCRAC-specific primers contain HindIII and SpeI restriction sites (in lower-case in the sequences shown Table 1) with an appropriate number of flanking additional nucleotides (indicated in italic); both features are not present in the canonical KREC and TCRAC sequences.
- Amplify the DNA extracted from PBMC (to obtain the TREC-SJ, KREC-SJ, and TCRAC fragments) with primers specific for TRECs, KRECs and TCRAC (see Table 1).
| TRECs | forward | 5’-AAA GAG GGC AGC CCT CTC CAA GGC-3’ |
| reverse | 5’-GGC TGA TCT TGT CTG ACA TTT GC-3’ | |
| KRECs | forward | 5’-CCC aag ctt TCA GCG CCC ATT ACG TTT CT-3’ |
| reverse | 5’-CCC aag ctt GTG AGG GAC ACG CAG CC-3’ | |
| TCRAC | forward | 5’-Gac tag tAT GAG ACC GTG ACT TGC CAG-3’ |
| reverse | 5’-Gac tag tGC TGT TGT TGA AGG CGT TTG C-3’ |
Table 1. Primers used for the cloning procedures. At the 5'-end, in lower case are shown nucleotides corresponding to restriction enzyme sites, whereas in italics are shown added flanking nucleotides.
-
- Perform PCR reactions in a final volume of 25 μl, consisting of 1x Buffer II, 1.5 mM MgCl2, dNTP mix (200 µM each), primers at the final concentration of 900 nM, AmpliTaq DNA Polymerase (2.5 U/25 μl), and 100 ng of DNA.
- Use the following PCR parameters: first step at 95 °C for 10 min, followed by 40 cycles of 95 °C for 30 sec; 60 °C for 30 sec; 72 °C for 30 sec,and finally 1 cycle of 72 °C for 10 min. PCR product lengths should be: 380 bp for TRECs, 166 bp for KRECs, 381 bp for TCRAC.
- Insert the PCR product of TREC-SJ in the T-A acceptor site of the pCR2.1-TOPO Vector. Transform the plasmid DNA in XL1-blue chemically competent cells by heat-shock following the protocol provided with the cells. Among the colonies that grow because of ampicillin resistance, identify those carrying the insert, which will appear white because of lost β-galactosidase complementation, and inoculate them into a master dish. Finally, identify the colonies containing the TREC fragment by PCR.
- Expand one of the identified colonies and purify the plasmid DNA using a plasmid miniprep kit and follow the manufacturer’s instructions. Digest the plasmid DNA and the TCRAC amplified product with SpeI restriction enzyme and ligate the TCRAC fragment into the SpeI restriction site.
- Transform the plasmid DNA in XL1-blue cells and identify the colonies containing the TCRAC fragment by PCR. Expand one of the identified colonies and purify the plasmid DNA using the plasmid miniprep kit.
- Digest the plasmid DNA and the KREC amplified product with HindIII and clone the KREC-SJ fragment into the HindIII restriction site. Transform the plasmid DNA in XL1-blue cells and identify the colonies containing the third fragment by PCR.
- Verify, by direct sequencing, the presence of the three inserts and the absence of mutations. The map of the final triple-insert plasmid is represented in Figure 1.

Figure 1. Triple-insert plasmid map. Triple-insert plasmid map showing the position of TREC, KREC, TCRAC sequences and restriction enzyme sites. Please click here to view a larger version of this figure.
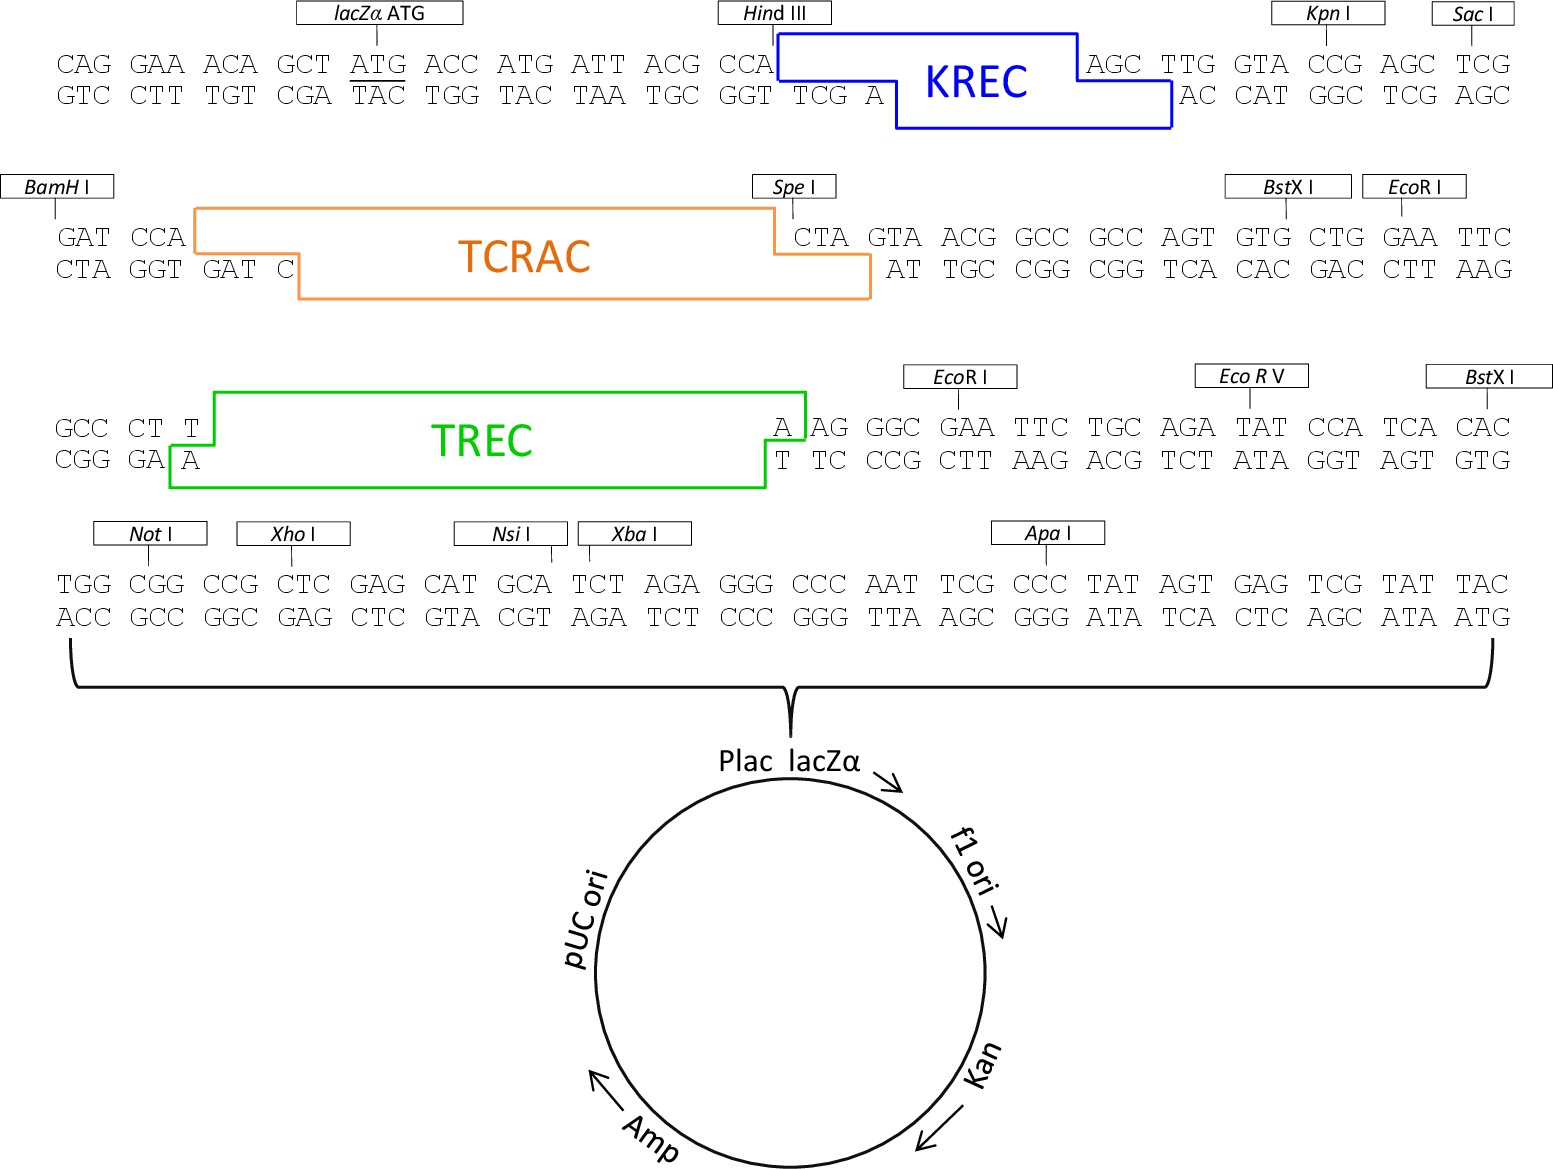
-
- Expand one of the identified colonies, purify the plasmid DNA using a plasmid midiprep kit. Determine the plasmid DNA concentration by spectrophotometric estimation at 260/280 nm and the DNA quality by gel electrophoresis. Store appropriate aliquots of the plasmid at -80 °C (e.g., 50 μl each).
2. Standard Curve Preparation
NOTE: Prepare all dilutions in 0.1x TE buffer in a place specially designed for containment of DNA carry-over.
- Calculate the mass of the plasmid copy numbers of interest (see Table 2), taking into account that the plasmid size is 4,846 bp and that the average mass per bp is 1.096 x 10⁻²¹ g/bp, and therefore: mp = (4,846 bp) x (1.096 x 10⁻²¹ g/bp) = 5,311.216 x 10-21 g = 5.311 x 10⁻¹⁸ g.
| Copy # | x 5.311 x 10⁻¹⁸ g | Mass of plasmid DNA (g) |
| 1 x 10⁶ | 5.311 x 10⁻¹² | |
| 1 x 10⁵ | 5.311 x 10⁻¹³ | |
| 1 x 10⁴ | 5.311 x 10⁻¹⁴ | |
| 1 x 10³ | 5.311 x 10⁻¹⁵ | |
| 1 x 10² | 5.311 x 10⁻¹⁶ |
Table 2. Mass of plasmid needed for each standard curve dilution point.
- Calculate the concentrations of plasmid DNA by dividing the needed plasmid masses by the volume (5 μl) to be pipetted into each reaction (see Table 3).
| Mass of plasmid DNA (g) | ÷ 5 μl | Final concentration of plasmid DNA (g/μl) |
| 5.311 x 10⁻¹² | 1.062 x 10⁻¹² | |
| 5.311 x 10⁻¹³ | 1.062 x 10⁻¹³ | |
| 5.311 x 10⁻¹⁴ | 1.062 x 10⁻¹⁴ | |
| 5.311 x 10⁻¹⁵ | 1.062 x 10⁻¹⁵ | |
| 5.311 x 10⁻¹⁶ | 1.062 x 10⁻¹⁶ |
Table 3. Calculation of plasmid concentrations needed for each dilution point.
- Thaw an aliquot of the plasmid. Linearize 2 μg of the plasmid DNA with XhoI and determine its concentration by spectrophotometric estimation at 260/280 nm.
- Prepare a proper dilution of the linearized plasmid DNA in order to achieve a convenient working stock solution to start from (e.g., 100 ng/μl = 0.1 μg/μl = 1 x 10⁻⁷ g/μl). Store the remainder of the linearized plasmid DNA at -80 °C.
- Perform a convenient number of 1:10 or 1:100 dilutions to bring the plasmid at the more workable concentration of 1 x 10⁻¹⁰ g/μl.
- Use the formula C1V1 = C2V2 to calculate the dilution volume (V2 – V1) needed to prepare the first standard curve point of the series (1 x 10⁶ copies, corresponding to 1.062 x 10⁻¹² g/5 μl; see Table 4).
| Initial conc. (g/μl) | Plasmid DNA vol (μl) | Diluent vol (μl) | Final Vol. (μl) | Final conc. (g/μl) | Final copy number of plasmid DNA/5μl |
| C1 | V1 | V2-V1 | V2 | C2 | |
| 1 x 10⁻⁷ | 5 μl | 45 μl | 50 μl | 1 x 10⁻⁸ | N/A |
| 1 x 10⁻⁸ | 5 μl | 495 μl | 500 μl | 1 x 10⁻¹⁰ | N/A |
| 1 x 10⁻¹⁰ | 5 μl | 465 μl | 470 μl | 1.062 x 10⁻¹² | 1 x 10⁶ |
| 1.062 x 10⁻¹² | 50 μl | 450 μl | 500 μl | 1.062 x 10⁻¹³ | 1 x 10⁵ |
| 1.062 x 10⁻¹³ | 50 μl | 450 μl | 500 μl | 1.062 x 10⁻¹⁴ | 1 x 10⁴ |
| 1.062 x 10⁻¹⁴ | 50 μl | 450 μl | 500 μl | 1.062 x 10⁻¹⁵ | 1 x 10³ |
| 1.062 x 10⁻¹⁵ | 50 μl | 450 μl | 500 μl | 1.062 x 10⁻¹⁶ | 1 x 10² |
Table 4. Dilution calculations.
- Proceed with a regular series of 1:10 dilutions to obtain the remaining standard curve points.
NOTE: Do not forget to vortex each plasmid dilution briefly before performing the next.
NOTE: The highest dilution of the standard curve (10 copies/5 μl) must be prepared just before performing the assay, because such a small quantity of plasmid DNA is not stable enough to be stored for future use. - Store the triple-plasmid dilution points at -80 °C in separate tubes until use. The diluted triple-plasmid DNA is highly stable for at least 6 months.
3. DNA Extraction from Target Samples
- Separate PBMC from peripheral blood collected into EDTA tubes using the density gradient separation method.
NOTE: Alternatively, use other appropriate starting material (e.g., sorted lymphocyte subpopulations, whole blood) as target sample. - Extract the DNA from PBMC of target samples as reported in step 1.2.
4. Real-time PCR for Quantification of TRECs and KRECs
- Plate preparation and loading:
- Arrange a PCR plate including at least two replicates for each samples to be analyzed: standard curve (A→F 1→4), positive control (CTRL+; G1→4) and no-template control (NTC; H 1→4).
NOTE: Observe a typical scheme in Table 5, but different formats can be created. Remember that TRECs and KRECs will be amplified together in the same wells, distinct from those of TCRAC.
- Arrange a PCR plate including at least two replicates for each samples to be analyzed: standard curve (A→F 1→4), positive control (CTRL+; G1→4) and no-template control (NTC; H 1→4).
| TRECs+KRECsa | TCRACb | TRECs+KRECs | TCRAC | TRECs+KRECs | TCRAC | |||||||
| 1 | 2 | 3 | 4 | 5 | 6 | 7 | 8 | 9 | 10 | 11 | 12 | |
| A | 106 copies | 106 copies | 106 copies | 106 copies | 1 | 1 | 1 | 1 | 9 | 9 | 9 | 9 |
| B | 105 copies | 105 copies | 105 copies | 105 copies | 2 | 2 | 2 | 2 | 10 | 10 | 10 | 10 |
| C | 104 copies | 104 copies | 104 copies | 104 copies | 3 | 3 | 3 | 3 | 11 | 11 | 11 | 11 |
| D | 103 copies | 103 copies | 103 copies | 103 copies | 4 | 4 | 4 | 4 | 12 | 12 | 12 | 12 |
| E | 102 copies | 102 copies | 102 copies | 102 copies | 5 | 5 | 5 | 5 | 13 | 13 | 13 | 13 |
| F | 10 copies | 10 copies | 10 copies | 10 copies | 6 | 6 | 6 | 6 | 14 | 14 | 14 | 14 |
| G | CTRL+ | CTRL+ | CTRL+ | CTRL+ | 7 | 7 | 7 | 7 | 15 | 15 | 15 | 15 |
| H | NTC | NTC | NTC | NTC | 8 | 8 | 8 | 8 | 16 | 16 | 16 | 16 |
Table 5. Sample real-time PCR plate.
-
- Calculate the total number of wells needed (include 1 - 2 extra wells to account for possible pipetting errors) and prepare the master mix for TRECs/KRECs and TCRAC in separate tubes (see Table 6).
NOTE: The primers and probes specific for TRECs, KRECs and TCRAC are mentioned in Table 7. The primer and probe final concentrations are 900 nM and 200 nM, respectively.
- Calculate the total number of wells needed (include 1 - 2 extra wells to account for possible pipetting errors) and prepare the master mix for TRECs/KRECs and TCRAC in separate tubes (see Table 6).
| TRECs/KRECs | TCRAC | ||
| H2O | 2 μl | H2O | 4.75 μl |
| KRECs for 20 pmol/μl | 1.125 μl | TCRAC for 20 pmol/μl | 1.125 μl |
| KRECs rev 20 pmol/μl | 1.125 μl | TCRAC rev 20 pmol/μl | 1.125 μl |
| KRECs probe 10 pmol/μl | 0.5 μl | TCRAC probe 10 pmol/μl | 0.5 μl |
| TRECs for 20 pmol/μl | 1.125 μl | 2x TaqMan Universal PCR Master Mix | 12.5 μl |
| TRECs rev 20 pmol/μl | 1.125 μl | ||
| TRECs probe 10 pmol/μl | 0.5 μl | ||
| 2x TaqMan Universal PCR Master Mix | 12.5 μl | ||
Table 6. Volume of reagents needed for the indicated wells.
| TRECs | forward | 5’-CAC ATC CCT TTC AAC CAT GCT-3’ |
| reverse | 5’-TGC AGG TGC CTA TGC ATC A-3’ | |
| probe | 5’-FAM-ACA CCT CTG GTT TTT GTA AAG GTG CCC ACT-TAMRA-3’ | |
| KRECs | forward | 5’-TCC CTT AGT GGC ATT ATT TGT ATC ACT-3 |
| reverse | 5’-AGG AGC CAG CTC TTA CCC TAG AGT-3’ | |
| probe | 5’-HEX-TCT GCA CGG GCA GCA GGT TGG-TAMRA-3 | |
| TCRAC | forward | 5’-TGG CCT AAC CCT GAT CCT CTT-3’ |
| reverse | 5’-GGA TTT AGA GTC TCT CAG CTG GTA CAC-3 | |
| probe | 5’-FAM-TCC CAC AGA TAT CCA GAA CCC TGA CCC-TAMRA-3’ |
Table 7. Sequence of primer and probes for the real-time PCR assay.
-
- Add 20 µl of each mix (TRECs/KRECs and TCRAC). Before leaving the reagent preparation room, seal the reaction plate with an optical adhesive cover.
- In a nucleic acid extraction room, lift the adhesive cover and add 5 µl of genomic DNA sample (400 - 500 ng) to the wells. Add 5 µl of genomic DNA (i.e., prepared from PBMC obtained from umbilical cord blood) to the CTRL+ wells.
NOTE: As an alternative to umbilical cord blood, use DNA from the same known, positive peripheral blood sample or pool of samples, or prepare an “artificial” positive standard by mixing a determined amount of triple-insert plasmid with genomic DNA from TREC- and KREC-negative cell lines. - Add 5 µl of water to the NTC wells. Seal the reaction plate again with the optical adhesive cover.
- Move to a place ensuring containment of plasmid DNA carry-over; thaw each dilution point of the plasmid DNA standard curve only before use and prepare the highest dilution (10 copies/5 µl). Lift up the adhesive cover only from A→H 1→4 wells and add 5 µl of each point dilution of plasmid DNA standard curve. Seal the adhesive cover again.
- Verify the absence of bubbles on the bottom of the wells, thus ensuring that the reagents are positioned at the bottom.
- Run the assay on a Real-time PCR system. The standard protocol consists of first step at 50 °C for 2 min, an initial heating at 95 °C for 10 min, followed by 45 cycles of denaturation at 95 °C for 15 sec, and a combined primer/probe annealing and elongation at 60 °C for 1 min.
- Save the data at the end of PCR program.
NOTE: To avoid DNA cross-contamination, remember: to follow the usual good laboratory practice recommendations for quantitative PCR when setting up the real time PCR assay: use separate areas/rooms for nucleic acid extraction, reagent preparation, plasmid manipulation, amplification reaction; use separate pipette sets; change gloves/coats as appropriate.
- Results and calculation:
NOTE: The following steps are based on our experience using the software provided with the real-time PCR instrument mentioned in the Materials Table, but, in general, they should apply to other real-time PCR analysis platforms and softwares. Keep in mind that, even if using the same software, usually there is more than one way to execute the required commands (e.g., icons, shortcuts).- Open the saved result file in the software and click on the “Results” tab. On top of the window, click on “Analysis” menu and select “Analysis settings”. Let the software determine the threshold automatically by selecting “All” detectors and “Auto Ct” (Ct = threshold cycle. Let the software set “Automatic Baseline” for background elimination by default.
- Click on the tab named "Amplification Plot" and, at the rightmost part of the window, select one of the three "detectors" in the corresponding drop-down menu (e.g., start with TRECs). Just below, select "Manual Ct" to manually set a threshold; go to the lower part of the window and select the wells corresponding to the standard curve dilution points of the chosen detector to show the amplification plots. To do this just click and drag the mouse over the corresponding cells of the table.
- To adjust the threshold manually, drag the red threshold line up and down, and then click "Analyze" to reanalyze results. To check how setting the threshold affects the results, select the “Report” tab, and see the resulting Ct of the respective standard curve dilution points. When moving the threshold, try to comply with the following recommendations to get an optimal placement.
- Go back to the "Amplification Plot" tab and verify that the threshold is in a region of exponential amplification sufficiently above the background noise but below the plateau phase. If the amplification plot is not shown in logarithmic scale, right-click on the plot to recall the “Graph Settings” and set post-run Y-axis setting as "log", set the threshold half-way in the linear part of the plot, and observe the amplification curves approximately parallel to each other.
- Click on the “Report” tab to see the Ct results. Ensure that the threshold placement produced results that maximize the precision of the two replicates of each standard curve dilution points.
- Check that the threshold is placed at the point which best reflects the extreme orders of magnitude of the standard curve dilution points (optimal sensitivity). Repeat step 4.2.2 and remaining substeps for the remaining two detectors (KRECs and TCRAC).
- Go to the Report tab, drag the mouse again in the table at the lower portion of the window to select the cells corresponding to the wells of the standard curve for all detectors (TRECs, KRECs, TCRAC). Verify that the resulting Ct of the three targets is very similar at the same dilution points (e.g., difference not more than 0.5 Ct). Readjust thresholds if needed and re-check.
NOTE: Because the triple-insert plasmid contains a single-copy of each target and therefore the amplification ratio should theoretically be close to 1:1:1. In some cases it may be necessary to manually adjust also the baseline for one or more of the detectors to get better results. Just recall the “Analysis settings” window, select the detector for which the adjustment is needed, then set “Manual Baseline”, and insert custom values for the Start and End Cycles (usually 3 to 15). Then click “OK & Reanalyze” and recheck previous points.
- Accept the experimental session only after verifying the following:
- Click on the “Report” tab, go to the lower portion of the window, select NTC wells and check that the corresponding Ct is “Undet” (i.e., no amplification is present in NTC wells).
- Select the “Standard Curve” tab and look to the right of the plot window; select detectors from the drop-down menu and see whether the reported standard curve slope ranges between -3.55 and -3.32 (corresponding to PCR efficiencies of 91 - 100%)
- Make sure that the coefficient of determination (R2) is higher than 0.998 (Figure 2), by reading its value right below the slope and intercept (in the same “Standard Curve” tab, after selecting each detector).
NOTE: Pay attention to the extreme dilution points because their misalignment may affect the slope more easily (they have a high “leverage” effect on the regression line). In particular, keep in mind that the highest plasmid dilution may degrade sooner than expected. However, whenever possible it is useful not to discard them, because a rational approach may be to consider 100 as the limit of quantitative detection: in other words, for samples between 10 and 100, the result may be reported as <100 or “positive, but not quantifiable”, while if outside the curve range (<10) it may be reported as 0 or “undetectable”.
NOTE: It may be useful to keep an archive of the Ct values of previous standard curve dilutions, in order to calculate an average value for each dilution point to be kept as a sort of optimal “reference” range or internal quality check for future experiments (e.g., calculate mean and SD to build Shewhart control charts). Analogously, it may be helpful to keep an archive of the past Ct of the positive control.

Figure 2. Standard curves for TRECs, KRECs, and TCRAC. Plots of the standard curve points and log-regression line estimates for TRECs (A), KRECs (B), and TCRAC (C) are built to verify compliance with the ideal exponential amplification rate (slope = 3.32) that would correspond to an efficiency of 100%. Ct: threshold cycle; R2: regression coefficient of determination. Please click here to view a larger version of this figure.
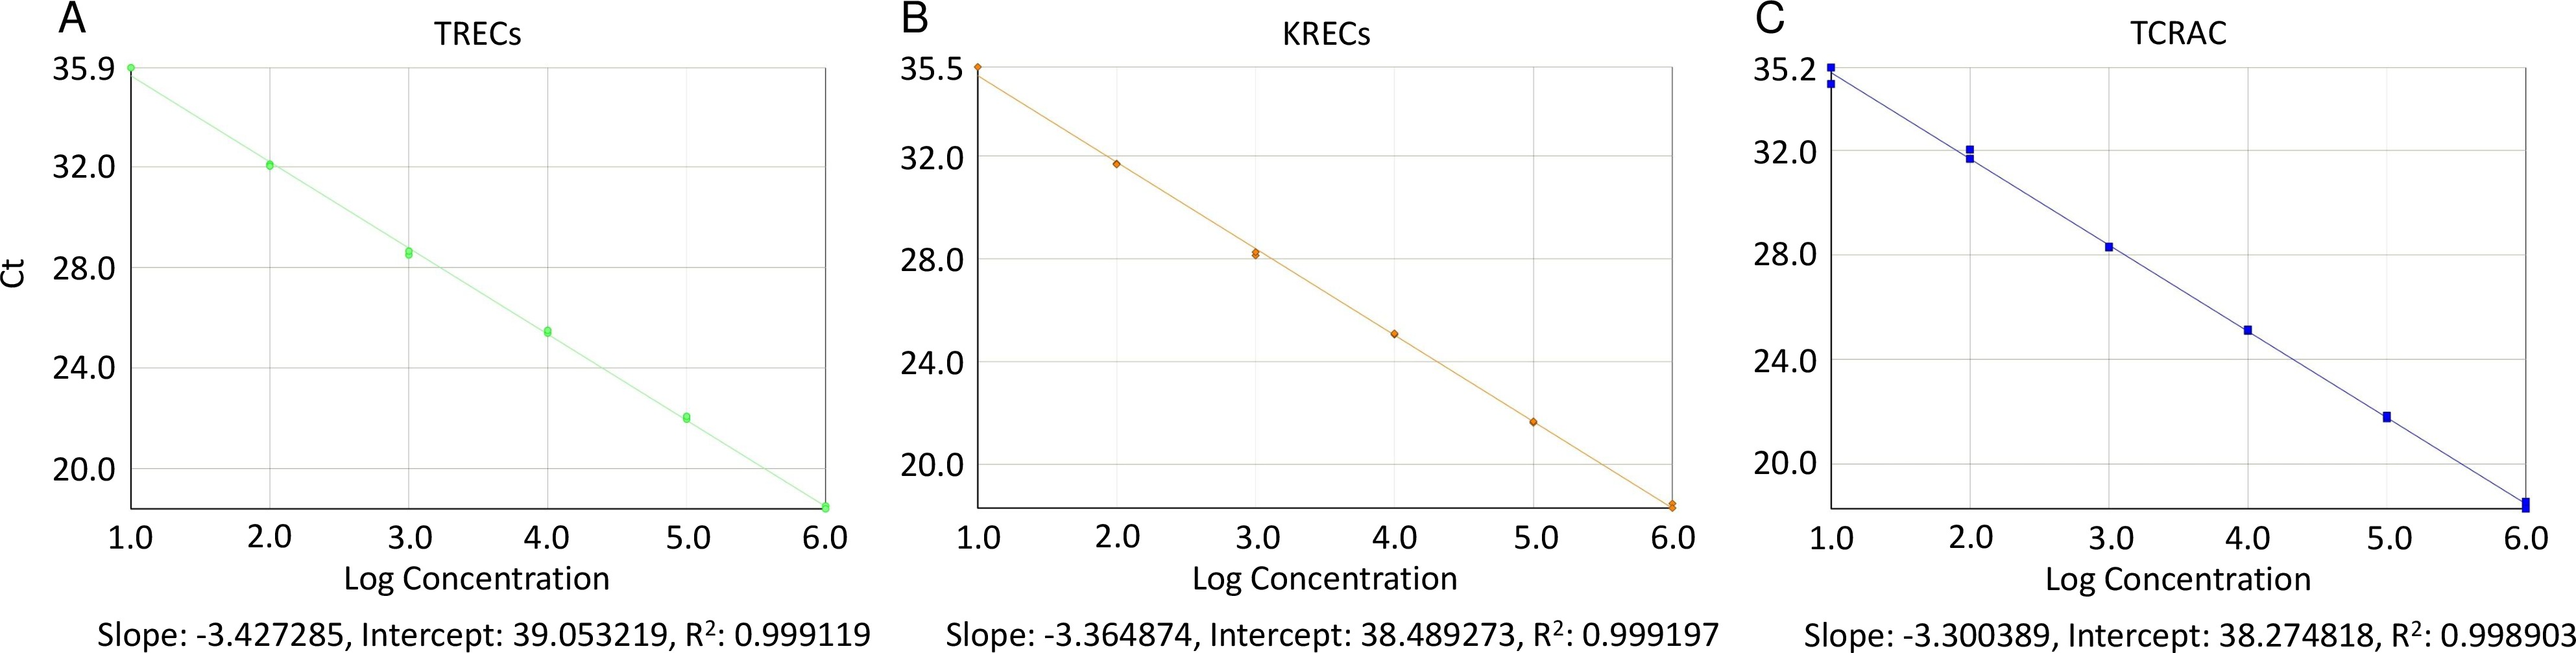
-
-
- Click on the “Report” tab and verify that the Ct of the positive control (found in the corresponding cells of the table under the chart) is consistent with the results of the previous assays on the same known positive control.
NOTE: The “Report” tab shows the amount of TRECs, KRECs and TCRAC of the samples being tested that the software has calculated by interpolation from the respective standard curve, using the Ct values obtained after the threshold and baseline have been properly set (a new analysis with a new threshold/baseline would change these results). To see where the interpolation takes place on the standard curve, select the “Standard Curve” tab, then select the desired wells, and look for the black “X” appearing on the regression line. Their y-axis value is the interpolated quantity. If using always the same positive control, appropriate reference ranges and/or quality control charts can be built, based on previous values determined on the positive control.
- Click on the “Report” tab and verify that the Ct of the positive control (found in the corresponding cells of the table under the chart) is consistent with the results of the previous assays on the same known positive control.
- Click on “File” menu, “Save”, and then “Export” to a .csv file to export the quantities of all wells in a text file containing comma separated values.
- Import the.csv file in a spreadsheet software and calculate the number of TRECs or KRECs per 106 PBMC by setting the following formula appropriately: [(mean quantity of TRECs or KRECs) / (mean quantity of TCRAC/2)] x 106
NOTE: The mean quantity of TCRAC is divided by 2 because in each cell there are two TCRAC gene copies, e.g., one for each chromosome.
NOTE: The consistency of the final number of TRECs and KRECs of positive control may be regarded, but keep in mind that values will not perfectly match because of the added variability of the standard curve dilution points. In case of gross divergence, the experiment may need to be repeated. Again, control charts may be built to set an appropriate reference range. - (optional, but recommended) If the results of the complete blood count are available, calculate the TRECs or KRECs per ml of blood using the following formula:
TRECs or KRECs per 1 x 10⁶) x (lymphocyte + monocyte count in 1 ml of blood) / 106 = copies/ml.
-
Access restricted. Please log in or start a trial to view this content.
Wyniki
The assay was performed in a representative sample of 87 healthy controls: 42 children aged 0 - 17 (male/females: 25/17) and 45 adults aged 24 - 60 (males/females: 29/16). Results were obtained as TRECs and KRECs per 106 PBMC, and then the TRECs and KRECs per ml of blood were calculated.
The number of TRECs decreases with age due to thymic involution,4 in particular in a very sharp fashion from 0 to 3 - 4 years. In adults, the TREC number also depends on gender because it...
Access restricted. Please log in or start a trial to view this content.
Dyskusje
TREC and KREC quantification can be considered a good estimate of recent thymic and bone marrow output provided that some caveats are taken into account. Even though an absolute quantification method employing standard curve requires more reagents and more space on the real-time PCR reaction plate, it ensures highly accurate quantitative results because unknown sample quantities are interpolated from standard curves built upon known amounts of starting material. Moreover this method is better fitted to detect low amount ...
Access restricted. Please log in or start a trial to view this content.
Ujawnienia
The authors have nothing to disclose.
Podziękowania
The authors have no acknowledgements.
Access restricted. Please log in or start a trial to view this content.
Materiały
| Name | Company | Catalog Number | Comments |
| Histopaque-1077 | Sigma Aldrich SRL | 10771-500 ML | density gradient separation method |
| QIAamp DNA Blood Mini Kit (250) | QIAGEN | 51106 | DNA extraction |
| Unmodified DNA Oligonucleotides HPSF 0.01 mmol | Eurofins MWG Operon/Carlo Erba Reagents S.r.l | Resuspend the lyophilized product to 100 pmol/µl | |
| AmpliTaq DNA Polymerase: including 10x Buffer II and 25 mM MgCl2 | Applied Biosystems/Life-Technologies | N8080156 | |
| GeneAmp dNTP Blend (100 mM) | Applied Biosystems/Life-Technologies | N8080261 | |
| TOPO TA Cloning Kit for Subcloning | Invitrogen/Life-Technologies | K4500-01 | |
| XL1-Blue Subcloning Grade Competent Cells | Stratagene | 200130 | |
| PureYield Plasmid Miniprep System | Promega | A1223 | |
| SpeI 500U | New England Biolabs | R0133S | |
| HindIII-HF 10,000 U | New England Biolabs | R3104S | |
| PureYield Plasmid Midiprep System | Promega | A2492 | |
| XhoI 5,000 U | New England Biolabs | R0146S | |
| TRIS Utrapure | Sigma Aldrich SRL | T1503 | |
| EDTA | Sigma Aldrich SRL | E5134 | |
| TE buffer (1 mM TRIS and 0.1 mM EDTA) | |||
| TaqMan Universal PCR Master Mix | Applied Biosystems/Life-Technologies | 4364338 | |
| Dual labeled probes HPLC 0.01 mmol | Eurofins MWG Operon/Carlo Erba Reagents S.r.l | Resuspend the lyophilized product to 100 pmol/µl | |
| NanoDrop 2000c spectrophotometer | ThermoFisher | ||
| Applied Biosystems 2720 Thermal Cycler | Applied Biosystems/Life-Technologies | 4359659 | |
| Fast 7500 Real-Time PCR system | Applied Biosystems/Life-Technologies | ||
| SDS Sequence Detection Software 1.4 | Applied Biosystems/Life-Technologies |
Odniesienia
- Douek, D. C., et al. Changes in thymic function with age and during the treatment of HIV infection. Nature. 396 (6712), 690-695 (1998).
- Zelm, M. C., Szczepanski, T., van der Burg, M., van Dongen, J. J. M. Replication history of B lymphocytes reveals homeostatic proliferation and extensive antigen-induced B cell expansion. J. Exp. Med. 204 (3), 645-655 (2007).
- Fronkova, E., et al. B-cell reconstitution after allogeneic SCT impairs minimal residual disease monitoring in children with ALL. Bone Marrow Transplant. 42 (3), 187-196 (2008).
- Sottini, A., et al. Simultaneous quantification of recent thymic T-cell and bone marrow B-cell emigrants in patients with primary immunodeficiency undergone to stem cell transplantation. Clin. Immunol. 136 (2), 217-227 (2010).
- Serana, F., et al. Thymic and bone marrow output in patients with common variable immunodeficiency. J. Clin. Immunol. 31 (4), 540-549 (2011).
- Zanotti, C., et al. Opposite effects of interferon-β on new B and T cell release from production sites in sclerosis. J. Neuroimmunol. 240-241, 147-150 (2011).
- Zanotti, C., et al. Peripheral accumulation of newly produced T and B lymphocytes in natalizumab-treated multiple sclerosis patients. Clin. Immunol. 145 (1), 19-26 (2012).
- Sottini, A., et al. Pre-existing T- and B-cell defects in one progressive multifocal leukoencephalopathy patient. PLoS One. 7, e34493(2012).
- Quiros-Roldan, E., et al. Effects of combined antiretroviral therapy on B- and T-cell release from production sites in long-term treated HIV-1+ patients. J. Transl. Med. 10, 94(2012).
- Mensen, A., et al. Utilization of TREC and KREC quantification for the monitoring of early T- and B-cell neogenesis in adult patients after allogeneic hematopoietic stem cell transplantation. J. Transl. Med. 11, 188(2013).
- Serana, F., et al. The different extent of B and T cell immune reconstitution after hematopoietic stem cell transplantation and enzyme replacement therapies in SCID patients with adenosine deaminase deficiency. J. Immunol. 185 (12), 7713-7722 (2010).
- Borte, S., et al. Neonatal screening for severe primary immunodeficiency diseases using high-throughput triplex real-time PCR. Blood. 119 (11), 2552-2555 (2012).
- Baker, M. W., et al. Implementing routine testing for severe combined immunodeficiency within Wisconsin's newborn screening program. Public Health Rep. 125 (2), 88-95 (2010).
- Lorenzi, A. R., et al. Determination of thymic function directly from peripheral blood: a validated modification to an established method. J. Immunol. Meth. 339 (2), 185-194 (2008).
- De Boer, R. J., Perelson, A. S. Quantifying T lymphocyte turnover. J. Theor. Biol. 327, 45-87 (2013).
Access restricted. Please log in or start a trial to view this content.
Przedruki i uprawnienia
Zapytaj o uprawnienia na użycie tekstu lub obrazów z tego artykułu JoVE
Zapytaj o uprawnieniaThis article has been published
Video Coming Soon
Copyright © 2025 MyJoVE Corporation. Wszelkie prawa zastrzeżone