
Aby wyświetlić tę treść, wymagana jest subskrypcja JoVE. Zaloguj się lub rozpocznij bezpłatny okres próbny.
Method Article
Isolating and Incorporating Light-Harvesting Antennas from Diatom Cyclotella Meneghiniana in Liposomes with Thylakoid Lipids
W tym Artykule
Podsumowanie
Here, we present a protocol to isolate fucoxanthin chlorophyll a/c binding proteins (FCP) from diatoms and incorporate them into liposomes with natural lipid compositions to study excitation energy transfer upon ion composition changes.
Streszczenie
The photosynthetic performance of plants, algae and diatoms strongly depends on the fast and efficient regulation of the light harvesting and energy transfer processes in the thylakoid membrane of chloroplasts. The light harvesting antenna of diatoms, the so called fucoxanthin chlorophyll a/c binding proteins (FCP), are required for the light absorption and efficient transfer to the photosynthetic reaction centers as well as for photo-protection from excessive light. The switch between these two functions is a long-standing matter of research. Many of these studies have been carried out with FCP in detergent micelles. For interaction studies, the detergents have been removed, which led to an unspecific aggregation of FCP complexes. In this approach, it is hard to discriminate between artifacts and physiologically relevant data. Hence, more valuable information about FCP and other membrane bound light harvesting complexes can be obtained by studying protein-protein interactions, energy transfer and other spectroscopic features if they are embedded in their native lipid environment. The main advantage is that liposomes have a defined size and a defined lipid/protein ratio by which the extent of FCP clustering is controlled. Further, changes in the pH and ion composition that regulate light harvesting in vivo can easily be simulated. In comparison to the thylakoid membrane, the liposomes are more homogenous and less complex, which makes it easier to obtain and understand spectroscopic data. The protocol describes the procedure of FCP isolation and purification, liposome preparation, and incorporation of FCP into liposomes with natural lipid composition. Results from a typical application are given and discussed.
Wprowadzenie
Photosynthetic organisms such as diatoms must cope with ever-changing light conditions and respond with sophisticated acclimation mechanisms that sustain high photosynthetic efficiency and protect from photo-oxidative damage caused by the excessive light. A major light-protective process in photosynthetic eukaryotes is the high energy quenching (qE) of absorbed light that occurs as the main contribution to the non-photochemical quenching (NPQ) under light stress conditions1,2,3. The light harvesting antenna complexes (LHC) are involved in the regulation of excitation energy transfer pathways. In response to high light induced low pH in the chloroplast lumen, the antenna system switches from the light harvesting state to the quenching state. This energy dissipative state protects photosystems (PS) and other complexes in the thylakoid membrane from photo-oxidation. In photosynthetic eukaryotes, the qE is usually induced by two factors1,2,3. One factor is the specialized light harvesting protein that responds to the low pH. The PsbS protein induces the qE in higher plants4. LhcSRs5, modulated by PsbS activity, induce the qE in green algae6. Diatoms possess Lhcx-like proteins which structurally related to LHCSRs7,8,9,10.
The second factor of qE is the xanthophyll cycle where carotenoids of the antenna are converted into a photo-protective form by de-epoxidation and reverted by epoxidation. In plants and green algae, violaxanthin is converted to zeaxanthin. In diatoms, diadinoxanthin is converted to diatoxanthin, which then correlates with the extent of NPQ11. The diatom light harvesting antenna possesses some peculiarities although it is evolutionary related to plant and algal LHCs. The switch from light harvesting to photo-protection is enormously fast and the NPQ capacity is higher compared to plants12. This might be one reason why diatoms are very successful in different ecological niches in a way that they are responsible for up to 45% of the oceanic net primary production13. Therefore, diatom light harvesting systems are an interesting object of photosynthesis research.
Diatoms, like the centric species Cyclotella meneghiniana, possess thylakoid intrinsic light harvesting systems named after the pigments they bind - fucoxanthin, chlorophyll (chl) a and c, hence FCP. Light harvesting proteins, such as FCPs, are embedded in the thylakoid membrane system comprising several membrane layers. Diatoms form bands of three thylakoids. This complex situation makes it difficult to study them on the molecular level in the thylakoid membrane. In addition, many components contribute to the regulation of light harvesting (see above). Therefore, in many approaches, the complexes were isolated from the membrane using mild detergents, such as n-Dodecyl-β-D-maltopyranoside (β-DDM), which solubilize the membrane but keep the FCP complexes intact. Many spectroscopic studies were performed using solubilized FCP to investigate intramolecular energy transfer14,15,16,17. However, this former approach was limited since the regulation of energy transfer needs excitonic interaction with other antenna complexes or photosystems. Hence, these kinds of studies cannot be carried out with solubilized complexes because the interaction between complexes is lost.
An important feature in antenna regulation is the "molecular crowding" of the antenna and photosystems in the thylakoid membrane18. Formerly, a simple approach was carried out to simulate this effect in vitro. The detergent was removed, which leads to random aggregation of antenna complexes. Although some reasonable data was obtained by this approach17,19, the detergent removal does not reflect the situation in vivo and has some limitations since the complexes are not interacting in their regular tertiary structure.
The use of liposomes overcomes several of the former limitations. The tertiary structure is still fully intact. The liposome membrane provides a quasi-native environment for the antenna complexes. The membrane separates the inside of the liposome from the outside environment. By these means, liposomes provide two reaction compartments for studies of ion and pH gradients as well as for transport processes. Further, the parameters of the experimental system can be controlled more easily for studies in the thylakoid membrane. Liposomes were already shown to be an excellent tool to study photosynthetic complexes. A major focus in the past was on plant LHC where the effect of altered lipid composition was tested on LHC II20. In other approaches, protein-protein interaction between different LHC II were investigated21. Also, some studies in green algae were carried out that describe spontaneous clustering between LHC22. Considering the importance of diatoms for aquatic ecosystems, relatively few studies were performed with antenna complexes of diatoms. Two studies investigated the antenna complexes of the centric Cyclotella meneghiniana, where the clustering of the FCP antenna23 and responsiveness of FCP to electrochemical gradients24 were shown. Thus, liposomes are an excellent tool to study diatom antennas and their interaction and regulation in nearly native conditions. The liposomes are versatile since many conditions such as lipid composition, liposome size, protein density and the surrounding aqueous phase can be controlled. Furthermore, the method requires low amounts of samples. The experimental system is robust and highly reproducible. The compartmentalization of liposomes allows for studying pH and ion gradients, which are important factors in the regulation of antenna complexes.
Here, we describe the isolation of FCP antenna complexes from C. meneghiniana and their incorporation in liposomes with natural thylakoid lipid composition. Also, we provide exemplary data for the spectroscopic characterization of solubilized FCP and compare them with FCP in liposomes. The method summarizes knowledge and standardized protocols obtained from the improvements of Gundermann and Büchel 201223, Natali et al. 201622, and Ahmad and Dietzel 201724.

Figure 1: Schematic representation of the workflow. (1) Refers to paragraph 1 which describes cell growth, disruption and thylakoid isolation with following FCP separation on sucrose density gradients; C. m.-Cyclotella meneghiniana cells. (2) Preparation of natural thylakoid lipid mixture (MGDG, DGDG and SQDG) described in paragraph 2 and creation of lipid-detergent micelles with octylglycoside (OG). A defined lipid-micelle size is achieved by extrusion using membranes of a defined pore diameter. FCP and lipid-micelles are unified at a predefined lipid: protein ratio and the detergents OG and β-DDM are removed via controlled dialysis forming FCP proteoliposomes. Please click here to view a larger version of this figure.
Protokół
Note: Photosynthetic complexes such as FCPs are highly vulnerable to light and heat. Always work on ice and under a very dim light.
1. Isolation of FCP from Cells
- Thylakoid isolation from C. meneghiniana cells
- Grow C. meneghiniana in five 500 mL flasks each filled with 300 mL of ASP-medium23,25 and 50 million cells. Plug the flasks with a cotton stopper and allow the cells to grow to the exponential growth phase for approximately one week on a shaker at 120 rpm with a 16 h light and 8 h dark phase at 40 µmol photons/(m²s) white light and a temperature between 15-18 °C. Check that the cell number is between 1.5-2 million cells/mL with a cell counter chamber.
- Centrifuge the cells at 4,000 x g in a precooled rotor with 500 mL centrifuge vials (4 °C) for 15 min in a high-speed centrifuge. Re-suspend the cell pellets in 12 mL of homogenization buffer (HB, Table 1) by pipetting.
- Transfer the suspension to a single 50 mL plastic tube. Store the samples at -80 °C or proceed to step 1.1.3.
- Pre-cool the bead mill and equipment. Fill the 50 mL beaker of the bead mill to 75% with a glass bead mixture and add the cell suspension. For cell disruption, use 7 x 45 s pulses at full speed with 30 s of cooling between each pulse. Take 20 µL of disrupted cells for quality checks in step 1.1.6.
- Filter the disrupted cells over a glass filter funnel and wash by pouring the HB over the glass beads until they appear clear. Pool the wash fraction with the filtrate. Keep the final volume lower than 150 mL.
- Centrifuge the sample for 15 min at 140 x g using three 50 mL plastic tubes to pellet the cell debris. Carefully transfer the supernatant to 20 mL polycarbonate ultracentrifugation vials and discard the pellet.
- Fill the vials with HB, equilibrate the weight, and centrifuge in a suitable rotor for 1 h at 300,000 x g and 4 °C to pellet the thylakoid membranes.
- Use the centrifugation time to check the proportion of disrupted cells by microscopy at 400X magnification with the 20 µL sample taken in 1.1.3. Calculate the ratio between chloroplast free and chloroplast containing frustules (silica shells).
Note: Diatom cell walls are made of silica, which is visible as highly diffracting substance in the microscope. Chloroplasts occurring as green dots should have been released from the cells if the cell disruption worked. - Re-suspend the membrane pellet with as little washing buffer as possible (0.5-1 mL) using a small painter’s brush. Fill the polycarbonate ultracentrifugation vials with washing buffer (Table 1), equilibrate their weight and centrifuge for 20 min at 200,000 x g and 4 °C.
- Re-suspend the washed membranes with a painter’s brush. Add washing buffer only if needed to keep the thylakoid concentration as high as possible. Pool all thylakoids in one sample vial (15 mL).
- Pre-dilute the samples using 10 µL of the sample with 90 µL of 100% acetone. Centrifuge it at 12,000 x g for 5 min to pellet precipitated protein. Take 10 µL of the predilution and mix it with 990 µL of 90% acetone.
- Measure the absorbance (ABS) of chlorophyll a and c at 664 nm and 630 nm in 90% acetone. Subtract the ABS750nm from both values. Determine the total chlorophyll content using the following formula:24
1)
2)
- Measure the absorbance (ABS) of chlorophyll a and c at 664 nm and 630 nm in 90% acetone. Subtract the ABS750nm from both values. Determine the total chlorophyll content using the following formula:24
- Aliquot thylakoids in portions of 0.5 mg of total chlorophyll in a 1.5 mL reaction tubes, freeze them in liquid nitrogen and store them at -80 °C until further use.
- Separation and concentration of FCP complexes
- Prepare a sucrose gradient solution and fill the ultracentrifuge tubes until the top minus the loading volume (300 – 500 µL). Freeze the tubes at -20 °C until they are completely frozen. Allow the tubes to thaw at +4 °C, which takes 3-4 h for a 17 mL tube.
- Repeat the freeze-thaw cycle twice to refine the gradient for better resolution.
- Use the samples obtained in 1.1.9 corresponding to 0.5 mg of chlorophyll and adjust with buffer B1 (Table 1) to a final volume of 2 mL. For solubilization, add n-Dodecyl-β-D-maltopyranoside (b-DDM) to a final concentration of 20 mM.
- Invert the tube 3 times and place it on ice for 20 min with gentle shaking to avoid foam. Centrifuge for 5 min, at 12,000 x g in a pre-cooled table top centrifuge at +4 °C.
- Load the supernatant on the gradient. Do not load more than 125 µg of total chlorophyll per gradient if 17 mL vials are used. Centrifuge for 22 h at 100,000 x g and +4 °C.
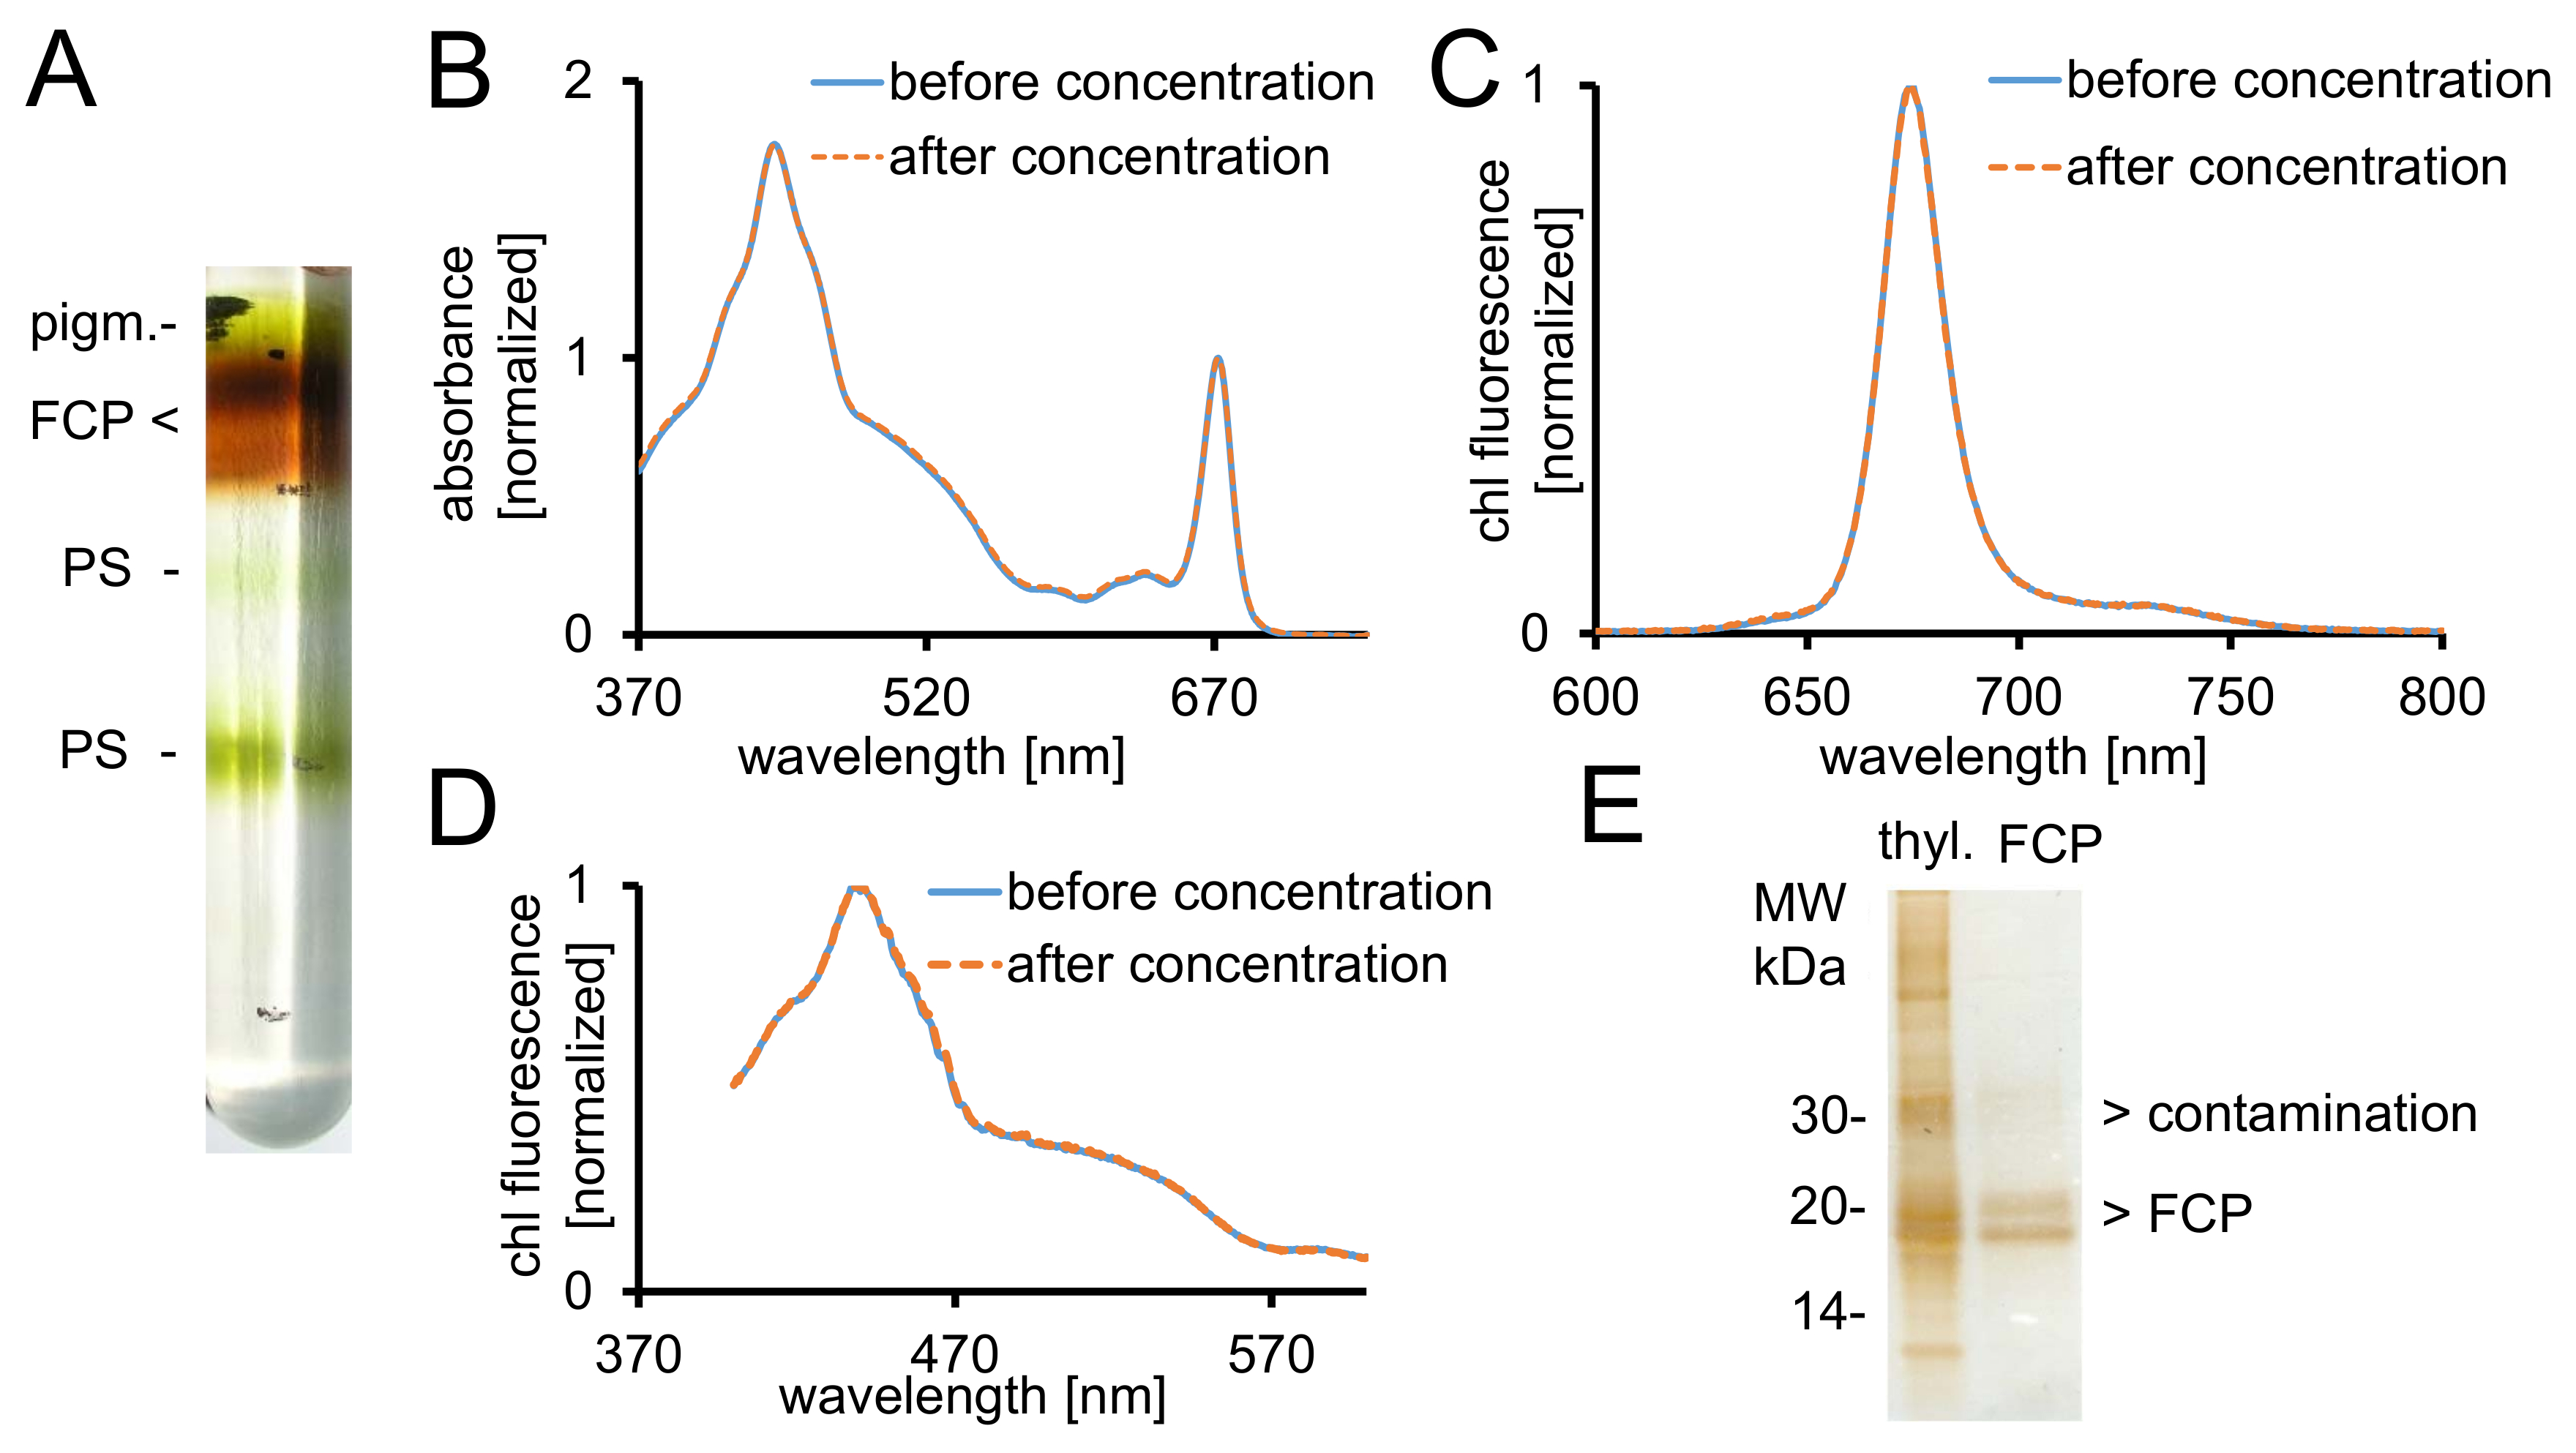
- Recover the desired brown FCP fractions from the gradient using a syringe (Figure 2A). Take a 5 µL aliquot and dilute it with 995 µL of B1a.
- Measure the absorbance (ABS) spectrum between 370 - 750 nm in a UV-VIS-spectrophotometer. Use semi-micro optical glass cuvettes.
- Open the spectra manager software, go to spectrum mode and record a baseline from 370 to 750 nm followed by sample measurements. Use the following settings: scan speed, 200 nm/min; data pitch, 0.5 nm; response, medium.
- Measure the volume of the recovered sample with a micropipette. Wash the FCP complexes by adding twice the recovered volume with B1 buffer (Table 1). Concentrate in a membrane concentrator with a 30 kDa cutoff at 1,000 x g and +4 °C to an ABS672nm of at least 20.
Note: The b-DDM concentration might rise due to micelle enrichment in the sample compartment. This could lead to further solubilization of the FCP complexes! Avoid over-solubilization by adding detergent free buffer B1 if further washing steps are required to remove residual sucrose. - Take a 20 µL aliquot for the controls. Shock freeze the samples in liquid nitrogen and store them at -80 °C.
- Prepare a sucrose gradient solution and fill the ultracentrifuge tubes until the top minus the loading volume (300 – 500 µL). Freeze the tubes at -20 °C until they are completely frozen. Allow the tubes to thaw at +4 °C, which takes 3-4 h for a 17 mL tube.

Figure 2: Purification of FCP, spectroscopic controls and purity check. (A) Typical appearance of a sucrose density gradient after overnight centrifugation. All brown bands contain the FCP pool consisting of FCPa and FCPb. pigm.- unbound pigments, PS - photosystems (B) Absorbance spectra of FCP before (blue line) and after (orange-dashed line) concentration using centrifugal filter devices with 30 kDa cutoff. Particularly, carotenoids are prone to loss from the FCP, which would result in lower absorbance in the region between 500-550 nm. Graphs are normalized to the chlorophyll Qy maximum at ~670 nm. (C) Chlorophyll a emission spectra with excitation of chl c (465 nm) for testing the functional excitation energy transfer. If the energy transfer of chl c to chl a is hampered, an additional fluorescence band at ~640 nm (chl c) would occur. Graphs are normalized to the emission maximum. (D) Excitation spectra recorded at 675 nm (chl a fluorescence maximum) for testing the energy transfer to chl a from all pigments absorbing between 370 nm and 600 nm. If the energy transfer to chl a is less efficient, the fluorescence yield would decrease especially between 465 and 550 nm. The graphs are normalized to the maximum around 440 nm. The spectra in (B), (C) and (D) are nearly identical if the concentration worked well. (E) Check for purity of the isolated FCP using a Tris-tricine gel28. FCPa and FCPb have subunits between 18-19 kDa. All visible silver-stained proteins larger than 20 kDa are contaminants. Thyl. - Thylakoids Please click here to view a larger version of this figure.
- Spectroscopic and gel-based controls
- Record the absorbance between 370-750 nm of 5 µL of FCP in 995 µL of B1a after step 1.2.5. Compare it with the spectrum obtained in step 1.2.4. Use the same instrumentation and settings as described in step 1.2.4.
- Export data as *.csv and import the data into a spreadsheet. Normalize both spectra to the maximum of chl a in the Qy band of around 672 nm as depicted in Figure 2B.
- Calculate the dilution factor of the samples from step 1.2.4 and 1.3.1 by dividing the measured ABS672nm by the desired ABS672nm of 0.03. Dilute the samples accordingly with B1a and transfer them to special glass fluorescence cuvettes.
- Record chl a fluorescence emission spectrum with a spectrofluorometer to reveal intact light energy transfer from chl c to chl a (Figure 2C).
- Use the spectrometer software and go to the spectrum measurement mode with the following settings: mode, emission; slit width excitation and emission, 3 nm; sensitivity, medium; scan speed, 100 nm/min; data pitch, 0.5 nm; excitation wavelength, 465 nm; emission, 600-800 nm. Perform autozero and measure.
- Record excitation spectra with the same sample and equipment to reveal intact energy transfer from all pigments to chl a (Figure 2D). Change settings to: mode, excitation; emission wavelength, 675 nm; excitation, 370-600 nm. Record the spectra.
- Correct with a rhodamine spectrum in the same range for spectral properties of the lamp – cf. instructions in the user manual.
- Mix FCP samples corresponding to 1 µg of chl a with 10 µL of SDS-loading buffer. Incubate for 10 min at 25 °C. Centrifuge for 5 min at 12000 x g in a table top centrifuge.
- Load the supernatant on a Tris-tricine gel28. Separate it for 2 h at 150 V and silver-stain it after separation40.
Note: The FCP subunits separate into two prominent protein bands between 18-19 kDa, which are constituents of FCPa and FCPb29 (Figure 2E).
- Load the supernatant on a Tris-tricine gel28. Separate it for 2 h at 150 V and silver-stain it after separation40.
- Record the absorbance between 370-750 nm of 5 µL of FCP in 995 µL of B1a after step 1.2.5. Compare it with the spectrum obtained in step 1.2.4. Use the same instrumentation and settings as described in step 1.2.4.
2. Preparation of Liposomes and Incorporation of FCP
- Preparation of the lipid mixture and lipid detergent micelles
Note: Lipids are susceptible to warm temperatures combined with oxidative conditions. Try to keep the lipids chilled and under an N2 atmosphere.- Calculate the desired thylakoid lipid ratios for C. meneghiniana according to Vieler et al. 200730. Refer to the example given in Supplemental Table 1. Prepare the lipid stock solutions recommended by the manufacturer in a solvent proof container.
- Pipette the desired amount of lipids in a 2 mL reaction tube and evaporate the chloroform using a gentle nitrogen flow and try to spread the lipids over the whole area of the tube base. Let the N2 flow until all solvent is evaporated.
- Solubilize the lipid mixture in 29 µL of n-octyl β-D-glucopyranoside solution (OG) at 4 °C for 4 h. Incubate the lipid mixture for 10 min at 30 °C. Incubate the lipids in a sonicator bath for 3 x 3 min at 25 °C interrupted by 30 s on ice.
- Add 221 µL of tricine buffer and 250 µL of 4x dialysis buffer.
- Use an extruder with 0.1 µm polycarbonate membranes for a defined liposome diameter of 50-70 nm. Assemble the extruder with the membrane and filter support. Avoid air bubbles and tighten the assembly thoroughly.
- Fill one syringe with 4x dialysis buffer and pre-wet the extruder until no bubbles can be seen in the second syringe.
- Apply the lipid-detergent-micelles to the extruder and press the solution from one syringe to the other forth and back. Repeat this step 5 times until the solution appears homogenous.
Note: This solution can be stored at 4 °C for several days. Do not freeze!
- Incorporation of FCP complexes and removal of detergents and aggregates
Note: In this example we use a lipid/chl a ratio of 12:1, which corresponds to a lipid/protein ratio of roughly 100:1.- Add FCP equal to 20 µg of chl a in a total volume of 500 µL of B1a buffer to 250 μL of the extruded lipid-micelles and 250 µL of 4x dialysis buffer. Incubate the samples for 3 x 3 min at 25 °C in a thermomixer at 1,500 - 3,000 rpm interrupted by a 30 s pause on ice.
- Cut the lid of four 1.5 mL reaction tube just under the top giving a ring which still fits on the lid. Prepare 1.5 cm x 1.5 cm pieces of dialysis membrane and wash them in 20 mL of 1x dialysis buffer
- Fill 250 µL of the sample to each lid. Carefully, lay the membrane on the lid so that the compartment is completely filled with the sample and no air bubbles occur. Tighten the reaction tube ring on the assembly in order to have a closed compartment.
- Dialyze the samples in 50 mL of 1x dialysis buffer overnight (12-16 h) on ice on a tumbling shaker. Replace the used dialysis buffer with fresh one and add 7 mg of adsorbent beads to remove the remaining detergents for at least 6 h.
- Replace the dialysis buffer again and dialyze for another 12 h. Recover the liposomes by piercing the dialysis membrane with a 200 µL micropipette tip and aspirate all liposomes from the reaction tube lid.
- Optional step: If high purity (>95%) is needed. Prepare a discontinuous density gradient in 17 mL ultracentrifugation vials with steps containing 6%, 10%, 15% and 20% sucrose epichlorhydrin copolymer in dialysis buffer. Load the liposomes on top and ultracentrifuge at 100,000 x g for 4 h in a swinging bucket rotor.
- Recover the upper brown band with a syringe, dilute the sample 1:5 with DP and proceed to the next step.
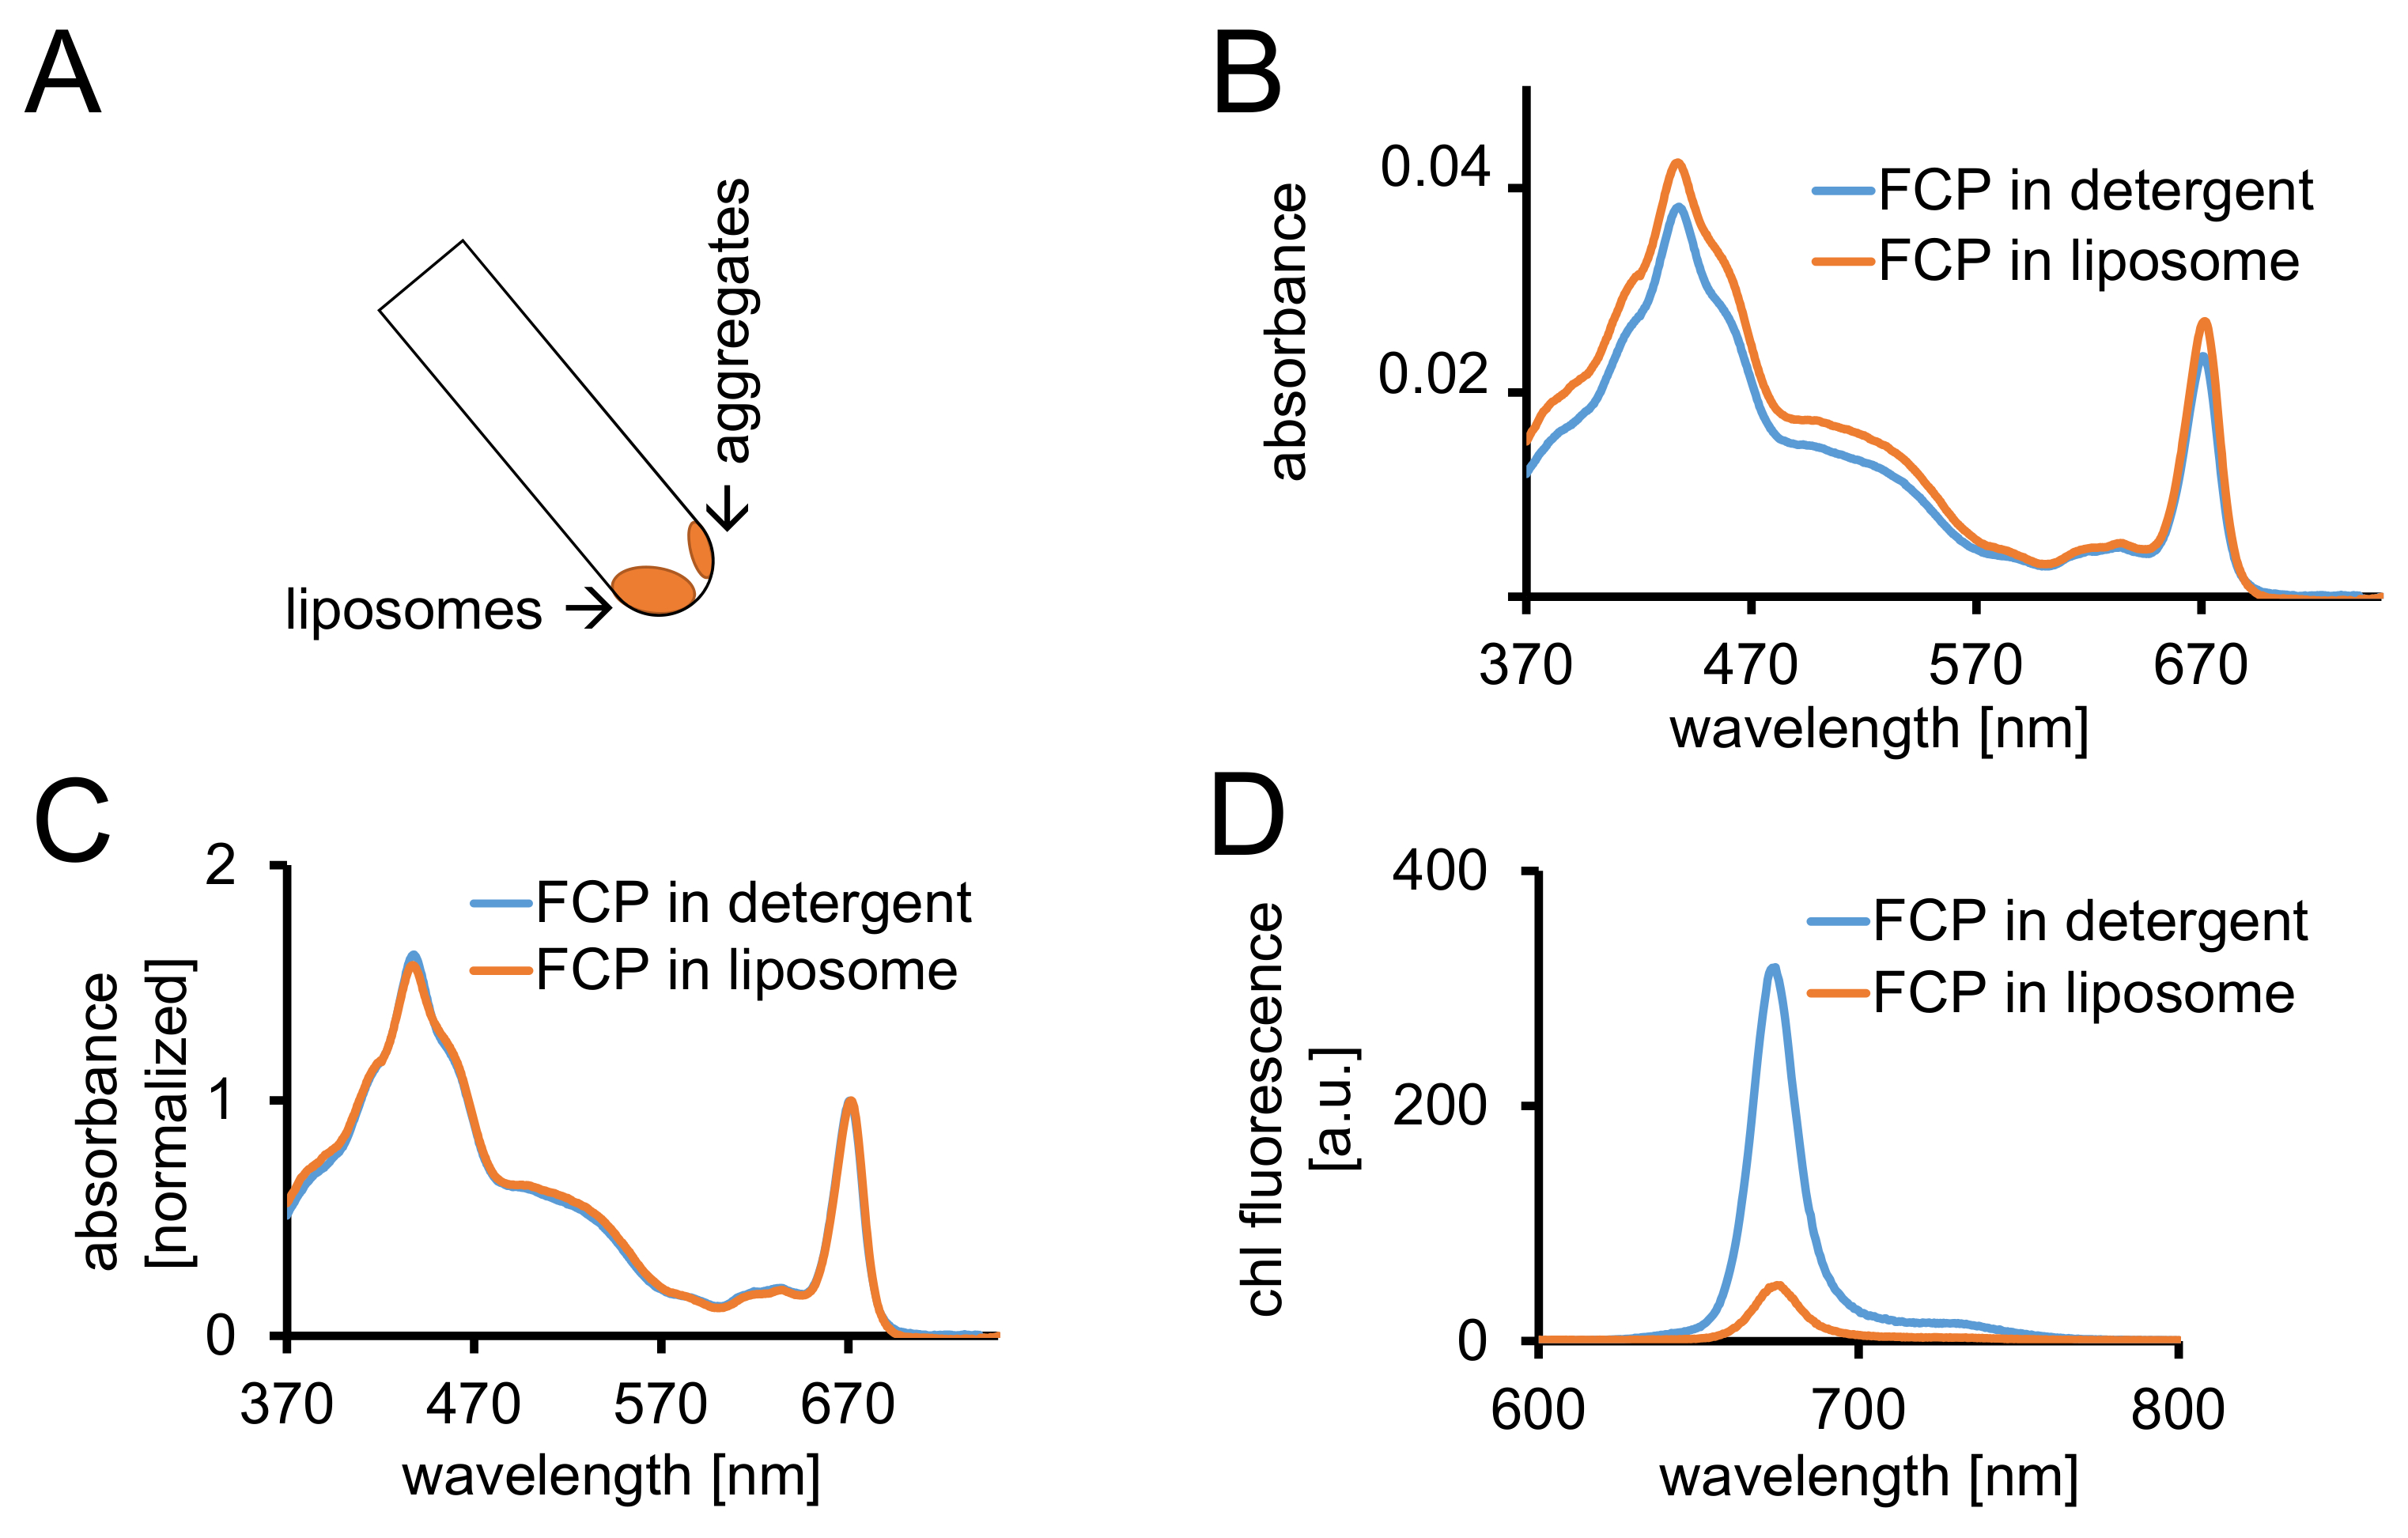
- Centrifuge the FCP liposomes in at least 2 mL of 1x dialysis buffer for 1.5 h at 100,000 x g and 4 °C. Recover the liposomes by turning the centrifuge tube at an angle of 45°. Allow the liposomes to move down for 1 min (Figure 3A).
- Recover the FCP liposomes in a final volume of 25-50 µL. Avoid disturbing the precipitate.
- Controls 1: absorbance, fluorescence spectroscopy
- Add a 3 µL aliquot of the FCP-liposomes to a 1 mL final volume of 1x dialysis buffer and centrifuge for 5 min at 12,000 x g.
- Record the absorbance between 370 and 750 nm of FCP-liposomes with the same equipment as described in 1.2.4. Normalize the spectrum to the maximum in the Qy region of chl a (670-680 nm) and compare it to the normalized spectrum of solubilized FCP (Figure 3C).
- Prepare FCP-liposomes in 1 mL of DP with an absorbance (ABS)=0.03 with respect to the maximum between 670-680 nm. Adjust the solubilized FCP in detergent from step 1.2.6 to the same ABS diluting with B1a.
- Record absorbance spectra of both samples as described in 1.2.4. Record chl a fluorescence emission spectrum of both samples as described in 1.3.3.
Note: The fluorescence yield is decreased in the FCP-liposome sample (Figure 3D and cf. discussion.)
- Add a 3 µL aliquot of the FCP-liposomes to a 1 mL final volume of 1x dialysis buffer and centrifuge for 5 min at 12,000 x g.

Figure 3: Isolation of FCP proteoliposomes followed by spectroscopic controls and confocal imaging. (A) Recovery of FCP liposomes after centrifugation. Turn the centrifugation tube to 45° and wait approximately 1 min - the liposomes will move down whereas the FCP aggregates which are not incorporated into liposomes stick to the tube wall. (B) Comparison of absorbance spectra of solubilized FCP in detergent (blue) and FCP in liposomes (orange) (C) The same spectra as in (B) normalized to chl a maximum in the red region (~670 nm - Qy peak); solubilized FCP in detergent (blue) and FCP in liposomes (orange). Potentially, there could be a pigment loss mainly of carotenoids visible in the 500-550 nm region. The clustering of FCP in the liposomes may lead to a peak broadening and a slight shift of the chl a maximum (~670 nm) to the red. (D) Emission spectra of solubilized FCP in detergent and FCP in liposome. Clustering of FCP in the liposome enhances energetic interactions of FCP complexes which lowers the fluorescence yield (orange curve) and shifts the emission maxima slightly to the red. Please click here to view a larger version of this figure.
Wyniki
The protocol describes the isolation of total FCP fraction from Cyclotella meneghiniana and incorporation into liposomes with native lipid composition. The thylakoid isolation is highly reproducible, but the thylakoid yield may change. The result is acceptable if more than 50% of all pigments are recovered in step 1.1.4. More than 80% is optimal.
The solubilization of the thylakoids is a critical step. Well-solubilized ...
Dyskusje
FCP liposomes with natural lipid composition provide a handy, simple and reproducible tool to investigate spectroscopic properties in vitro. The lipid environment in FCP liposomes resembles the situation within the thylakoid membrane, giving rise to experimental results that are closer to natural conditions.
There are several advantages of using C. meneghiniana as a model system for FCP antenna. It grows relatively fast and is more robust in comparison to other diatom model s...
Ujawnienia
The authors have nothing to disclose.
Podziękowania
We thank Rana Adeel Ahmad for assistance in FCP purification. Prof. Claudia Büchel is acknowledged for helpful discussions and reading the manuscript. This work was supported by the German Research Foundation to LD (DI1956-1/1) and the Humboldt foundation for a Feodor-Lynen fellowship to LD.
Materiały
| Name | Company | Catalog Number | Comments |
| 500 ml centrifuge vials | |||
| high speed centrifuge | Heraeus | ||
| Bead Mill VI 2 | Edmund-Bühler (edmund-buehler.de) | newer version: Vibrogen-Zellmühle Vl 6 | |
| Silibeads S 400 µm | Sigmund-Lindner.com | 5223-7 | |
| Silibeads S 1,-1,3 mm | Sigmund-Lindner.com | 4504 | |
| VitraPOR filter funnel - por1 | ROBU GmbH | 21121 | |
| polycarbonate ultracentrifuagtion vials (30 mL) for T-865 | Beranek Laborgeräte (Laborgeraete-beranek.de) | 314348 | |
| Ultracentrifuge Discovery 90SE | Sorvall | n.a. | |
| rotor T 865 | ThermoFisher Scientific (thermofisher.com) | 51411 | |
| Neubauer Cell Counter Chamber (improved) | Carl Roth Laborbedarf (Carlroth.com) | T729.1 | |
| Zeiss Mikroskop Primostar (7) | Optik-Pro (optik-pro.de) | 51428 | |
| optical glass cuvettes (6040-OG) | Hellma Analytics (hellma-analytics.com) | "6040-10-10" | |
| V-630 UV-VIS Spectrophotometer (incl. software) | Jasco (jasco.de) | V-630 | |
| n-Dodecyl-β-D-Maltopyranoside | ANATRACE (anatrace.com) | D310LA | |
| Ultra-Clear tubes 17 ml for AH629 | Beranek Laborgeräte (Laborgeraete-beranek.de) | 344061 | |
| rotor AH629-17-mL | ThermoFisher Scientific (thermofisher.com) | 54285 | |
| Membrane concentrator_Centriprep 30 kDa cutoff | Millipore (merckmillipore.com) | 4307 | |
| Biometra Minigel-Twin | Analytik Jena AG (analytik-jena.de) | 846-010-100 | |
| Silver Stain Plus Kit | Bio-Rad (bio-rad.com) | 1610449 | |
| libre office spread sheet | The document foundation | https://de.libreoffice.org/download/libreoffice-still/ | |
| special glass cuvettes for fluorescence (101-0S) | Hellma Analytics (hellma-analytics.com) | 101-10-20 | |
| Spectrofluorometer FP-6500 (incl. Software) | Jasco (jasco.de) | FP-6500 | |
| SDS-loading buffer Roti-Load | ROTH (carlroth.com) | K929.1 | |
| n-octyl β-D-glucopyranoside | ANATRACE (anatrace.com) | O311 | |
| Monogalactosyl Diaclyglycerol (MGDG) | Larodan AB (larodan.com) | 59-1300 | make stock solution in chloroform |
| Digalactosyl Diacylglycerol (DGDG) | Larodan AB (larodan.com) | 59-1310 | make stock solution in chloroform |
| Sulphoquinovosyl Diacylglycerol (SQDG) | Larodan AB (larodan.com) | 59-1230 | make stock solution in chloroform |
| L-alpha-Phosphatidylglycerol (PG) | Larodan AB (larodan.com) | 37-0150 | make stock solution in chloroform |
| L-α-Phosphatidylcholine | Sigma-Aldrich (sigmaaldrich.com) | P3782 SIGMA | make stock solution in chloroform |
| sonicator bath S-50TH | Sonicor (getmedonline.com | SONICOR-S-50TH | |
| mini-Extruder | Avanti Polar Lipids (Avanti.com) | 610000 | |
| Nuleopore polycarbonate membrane | Avanti Polar Lipids (Avanti.com) | 610005 | |
| dialysis membrane Visking 14 kDa cutoff | ROTH (carlroth.com) | 0653.1 | boil in destilled water before use |
| Biobeads SM2 Adsorbent | Biorad (Bio-rad.com) | 152-3920 | |
| sucrose epichlorhydrin copolymer - Ficoll 400 | Sigma-Aldrich (sigmaaldrich.com) | F4375 | |
| Polycarbonate ultracentrifuagtion vials (2.7 mL) for TFT 80.4 | Beranek Laborgeräte (Laborgeraete-beranek.de) | 252150 | |
| rotor TFT 80.4 | Millipore (merckmillipore.com) | 54356 | |
| material listed in order of appearance | For specific safety instructions please refer to material safety sheets and repective manuals. Standard lab material and substances are not listed. |
Odniesienia
- Eberhard, S., Finazzi, G., Wollman, F. A. The Dynamics of Photosynthesis. Annual Review of Genetics. 42, 463-515 (2008).
- Li, Z. R., Wakao, S., Fischer, B. B., Niyogi, K. K. Sensing and Responding to Excess Light. Annual Review of Plant Biology. 60, 239-260 (2009).
- Niyogi, K. K., Truong, T. B. Evolution of flexible non-photochemical quenching mechanisms that regulate light harvesting in oxygenic photosynthesis. Current Opinion in Plant Biology. 16 (3), 307-314 (2013).
- Li, X. -. P., et al. A pigment-binding protein essential for regulation of photosynthetic light harvesting. Nature. 403 (6768), 391-395 (2000).
- Peers, G., et al. An ancient light-harvesting protein is critical for the regulation of algal photosynthesis. Nature. 462 (7272), 518-521 (2009).
- Correa-Galvis, V., et al. Photosystem II Subunit PsbS Is Involved in the Induction of LHCSR Protein-dependent Energy Dissipation in Chlamydomonas reinhardtii. The Journal of biological chemistry. 291 (33), 17478-17487 (2016).
- Bailleul, B., et al. An atypical member of the light-harvesting complex stress-related protein family modulates diatom responses to light. Proceedings of the National Academy of Sciences of the United States of America. 107 (42), 18214-18219 (2010).
- Taddei, L., et al. Multisignal control of expression of the LHCX protein family in the marine diatom Phaeodactylum tricornutum. Journal of experimental botany. 67 (13), 3939-3951 (2016).
- Lepetit, B., et al. The diatom Phaeodactylum tricornutum adjusts nonphotochemical fluorescence quenching capacity in response to dynamic light via fine-tuned Lhcx and xanthophyll cycle pigment synthesis. New Phytologist. 214 (1), 205-218 (2017).
- Büchel, C. Evolution and function of light harvesting proteins. Journal of Plant Physiology. 172, 62-75 (2015).
- Lavaud, J., Rousseau, B., van Gorkom, H. J., Etienne, A. -. L. Influence of the Diadinoxanthin Pool Size on Photoprotection in the Marine Planktonic Diatom Phaeodactylum tricornutum. Plant Physiology. 129 (3), 1398-1406 (2002).
- Ruban, A., et al. The super-excess energy dissipation in diatom algae: comparative analysis with higher plants. Photosynthesis Research. 82 (2), 165-175 (2004).
- Mann, D. G. The species concept in diatoms. Phycologia. 38 (6), 437-495 (1999).
- Papagiannakis, E., van Stokkum, I. H. M., Fey, H., Büchel, C., van Grondelle, R. Spectroscopic Characterization of the Excitation Energy Transfer in the Fucoxanthin-Chlorophyll Protein of Diatoms. Photosynthesis Research. 86 (1-2), 241-250 (2005).
- Premvardhan, L., Robert, B., Beer, A., Büchel, C. Pigment organization in fucoxanthin chlorophyll a/c2 proteins (FCP) based on resonance Raman spectroscgopy and sequence analysis. Biochimica et Biophysica Acta-Bioenergetics. 1797 (9), 1647-1656 (2010).
- Gildenhoff, N., Herz, J., Gundermann, K., Büchel, C., Wachtveitl, J. The excitation energy transfer in the trimeric fucoxanthin-chlorophyll protein from Cyclotella meneghiniana analyzed by polarized transient absorption spectroscopy. Chemical Physics. 373 (1), 104-109 (2010).
- Ramanan, C., et al. Exploring the mechanism(s) of energy dissipation in the light harvesting complex of the photosynthetic algae Cyclotella meneghiniana. Biochimica et Biophysica Acta-Bioenergetics. 1837 (9), 1507-1513 (2014).
- Haferkamp, S., Kirchhoff, H. Significance of molecular crowding in grana membranes of higher plants for light harvesting by photosystem II. Photosynthesis Research. 95 (2-3), 129-134 (2008).
- Wahadoszamen, M., et al. Stark fluorescence spectroscopy reveals two emitting sites in the dissipative state of FCP antennas. Biochimica et Biophysica Acta-Bioenergetics. 1837 (1), 193-200 (2014).
- Zhou, F., et al. Effect of monogalactosyldiacylglycerol on the interaction between photosystem II core complex and its antenna complexes in liposomes of thylakoid lipids. Photosynthesis Research. 99 (3), 185-193 (2009).
- Moya, I., Silvestri, M., Vallon, O., Cinque, G., Bassi, R. Time-resolved fluorescence analysis of the photosystem II antenna proteins in detergent micelles and liposomes. Biochemistry. 40 (42), 12552-12561 (2001).
- Natali, A., et al. Light-harvesting Complexes (LHCs) Cluster Spontaneously in Membrane Environment Leading to Shortening of Their Excited State Lifetimes. Journal of Biological Chemistry. 291 (32), 16730-16739 (2016).
- Gundermann, K., Büchel, C. Factors determining the fluorescence yield of fucoxanthin-chlorophyll complexes (FCP) involved in non-photochemical quenching in diatoms. Biochimica et Biophysica Acta-Bioenergetics. 1817 (7), 1044-1052 (2012).
- Ahmad, R. A., Dietzel, L. Relaxation of cellular K+ gradients by valinomycin induces diatoxanthin accumulation in Cyclotella meneghiniana cells and alters FCPa fluorescence yield in vitro. Physiologia Plantarum. , 171-180 (2017).
- Provasoli, L., McLaughlin, J. J. A., Droop, M. R. The development of artificial media for marine algae. Archiv für Mikrobiologie. 25 (4), 392-428 (1957).
- Jeffrey, S., Humphrey, G. New spectrophotometry equations for determining chlorophyll a, chlorophyll b, chlorophyll c-1 and chlorophyll c-2 in higher plants, algae and natural phytoplankton. Biochemie und Physiologie der Pflanzen. 167, 191-194 (1975).
- Beer, A., Gundermann, K., Beckmann, J., Büchel, C. Subunit Composition and Pigmentation of Fucoxanthin−Chlorophyll Proteins in Diatoms: Evidence for a Subunit Involved in Diadinoxanthin and Diatoxanthin Binding. Biochemistry. 45 (43), 13046-13053 (2006).
- Schägger, H., von Jagow, G. Tricine-sodium dodecyl sulfate-polyacrylamide gel electrophoresis for the separation of proteins in the range from 1 to 100 kDa. Analytical Biochemistry. 166 (2), 368-379 (1987).
- Büchel, C. Fucoxanthin-Chlorophyll Proteins in Diatoms: 18 and 19 kDa Subunits Assemble into Different Oligomeric States. Biochemistry. 42 (44), 13027-13034 (2003).
- Vieler, A., Wilhelm, C., Goss, R., Süß, R., Schiller, J. The lipid composition of the unicellular green alga Chlamydomonas reinhardtii and the diatom Cyclotella meneghiniana investigated by MALDI-TOF MS and TLC. Chemistry and Physics of Lipids. 150 (2), 143-155 (2007).
- Gundermann, K., Büchel, C. The fluorescence yield of the trimeric fucoxanthin-chlorophyll-protein FCPa in the diatom Cyclotella meneghiniana is dependent on the amount of bound diatoxanthin. Photosynthesis Research. 95 (2-3), 229-235 (2008).
- Miloslavina, Y., et al. Ultrafast fluorescence study on the location and mechanism of non-photochemical quenching in diatoms. Biochimica et Biophysica Acta-Bioenergetics. 1787 (10), 1189-1197 (2009).
- Grouneva, I., Jakob, T., Wilhelm, C., Goss, R. The regulation of xanthophyll cycle activity and of non-photochemical fluorescence quenching by two alternative electron flows in the diatoms Phaeodactylum tricornutum and Cyclotella meneghiniana. Biochimica et Biophysica Acta-Bioenergetics. 1787 (7), 929-938 (2009).
- Chukhutsina, V. U., Büchel, C., van Amerongen, H. Disentangling two non-photochemical quenching processes in Cyclotella meneghiniana by spectrally-resolved picosecond fluorescence at 77 K. Biochimica et Biophysica Acta-Bioenergetics. 1837 (6), 899-907 (2014).
- Ghazaryan, A., Akhtar, P., Garab, G., Lambrev, P. H., Büchel, C. Involvement of the Lhcx protein Fcp6 of the diatom Cyclotella meneghiniana in the macro-organisation and structural flexibility of thylakoid membranes. Biochimica Et Biophysica Acta-Bioenergetics. 1857 (9), 1373-1379 (2016).
- Darley, W. M. Biochemical composition. The biology of diatoms. 13, 198-223 (1977).
- Milsman, M. H. W., Schwendner, R. A., Weder, H. G. Preparation of large single bilayer liposomes by a fast and controlled dialysis. Biochimica Et Biophysica Acta. 512 (1), 147-155 (1978).
- Zumbuehl, O., Weder, H. G. Liposomes of controllable size in the range of 40 to 180 nm by defined dialysis of lipid-detergent-mixed micelles. Biochimica Et Biophysica Acta. 640 (1), 252-262 (1981).
- Verchere, A., Broutin, I., Picard, M. Photo-induced proton gradients for the in vitro investigation of bacterial efflux pumps. Scientific Reports. 2 (306), (2012).
- Chevallet, M., Luche, S., Rabilloud, T. Silver staining of proteins in polyacrylamide gels. Nature Protocols. 1 (4), 1852-1858 (2006).
Przedruki i uprawnienia
Zapytaj o uprawnienia na użycie tekstu lub obrazów z tego artykułu JoVE
Zapytaj o uprawnieniaThis article has been published
Video Coming Soon
Copyright © 2025 MyJoVE Corporation. Wszelkie prawa zastrzeżone