
A subscription to JoVE is required to view this content. Sign in or start your free trial.
Method Article
Isolation of Murine Retinal Endothelial Cells for Next-Generation Sequencing
In This Article
Summary
This protocol describes a method for the isolation of murine postnatal retinal endothelial cells optimized for cell yield, purity, and viability. These cells are suitable for next-generation sequencing approaches.
Abstract
Recent improvements in next-generation sequencing have advanced researchers' knowledge of molecular and cellular biology, with several studies revealing novel paradigms in vascular biology. Applying these methods to models of vascular development requires the optimization of cell isolation techniques from embryonic and postnatal tissues. Cell yield, viability, and purity all need to be maximal to obtain accurate and reproducible results from next-generation sequencing approaches. The neonatal mouse retinal vascularization model is used by researchers to study mechanisms of vascular development. Researchers have used this model to investigate mechanisms of angiogenesis and arterial-venous fate specification during blood vessel formation and maturation. Applying next-generation sequencing techniques to study the retinal vascular development model requires optimization of a method for the isolation of retinal endothelial cells that maximizes cell yield, viability, and purity. This protocol describes a method for murine retinal tissue isolation, digestion, and purification using fluorescence-activated cell sorting (FACS). The results indicate that the FACS-purified CD31+/CD45- endothelial cell population is highly enriched for endothelial cell gene expression and exhibits no change in viability for 60 min post-FACS. Included are representative results of next-generation sequencing approaches on endothelial cells isolated using this method, including bulk RNA sequencing and single-cell RNA sequencing, demonstrating that this method for retinal endothelial cell isolation is compatible with next-generation sequencing applications. This method of retinal endothelial cell isolation will allow for advanced sequencing techniques to reveal novel mechanisms of vascular development.
Introduction
The high-throughput capacity of sequencing nucleic acids via next-generation sequencing approaches has greatly advanced researchers' knowledge of molecular and cellular biology. These advanced techniques include whole transcriptome RNA sequencing, DNA sequencing of targeted regions to identify Single Nucleotide Polymorphisms (SNPs), DNA sequencing of bound transcription factors in Chromatin Immunoprecipitation (ChIP) sequencing, or open chromatin regions in Assay for Transposase-Accessible Chromatin (ATAC) sequencing, and single-cell RNA sequencing1. In vascular biology, these advances have allowed researchers to elucidate complicated mechanisms of development and disease, along with distinguishing gene expression patterns along a continuum of varying phenotypes2,3. Future experiments can further define complex mechanisms by combining the next-generation sequencing with evaluated models of vascular development, but the methods for sample preparation need to be compatible with the advanced sequencing techniques.
The quality, accuracy, and reproducibility of next-generation sequencing approaches depend on the method of sample preparation. When isolating a subset of cells or generating single-cell suspensions from tissues, optimal digestion and purification methods are essential for maximizing cell number, viability, and purity of the cell population4,5. This requires a balance in the digestion method: strong digestion is necessary to release cells from the tissue and obtain enough cells for downstream approaches, but cell viability will be negatively affected if the digestion is too strong6,7. Additionally, purity of the cell population is necessary for robust results and accurate analysis of data, which can be accomplished through FACS. This highlights the importance of optimizing cell isolation methods to apply next-generation sequencing to established models of vascular development.
A well-characterized model for investigating vascular development is the murine retinal vascular development model. Murine retinal vasculature develops postnatally in a two-dimensional superficial plexus, with initial angiogenic sprouting from the optic nerve visible at postnatal day (P)3, angiogenic front with stalk- and tip-cells and initial vessel maturation visible at P6, and maturation of the vascular plexus visible after P98,9. During the remodeling of the initial vascular plexus, endothelial cells undergo specification toward arterial, capillary, and venous phenotypes in different vessels to generate a circulatory network10,11. Therefore, this method allows researchers to visualize angiogenic vascular plexus formation and endothelial arterial-venous specification and maturation at various time points during development9. Additionally, this model provides a method for investigating the effects of transgenic manipulation on angiogenesis and vascular plexus development, which has been applied for the investigation of vascular development, arterial-venous malformations, and oxygen-induced neovascularization12,13,14,15,16. In order to combine next-generation sequencing approaches with the murine retinal vascular development model, an optimized protocol for the isolation of endothelial cells from retinal tissue is necessary.
This protocol describes an optimized method for digesting retinal tissue from mice at P6 to maximize cell yield, purity, and viability. Retinal tissue is isolated from P6 mice, digested for 20 min, immunostained for CD31 and CD45, and purified through FACS to isolate a single cell suspension of endothelial cells in about 2.5 h (Figure 1A). These endothelial cells were found to maintain high viability for 60 min post-isolation17, allowing library preparations for next-generation sequencing methods. Additionally, representative results are provided for FACS gating and quality control results from two separate next-generation sequencing methods using this isolation protocol: whole transcriptome RNA sequencing and single-cell RNA sequencing. This method allows for next-generation sequencing approaches to be used in conjunction with the retinal vascularization model to elucidate novel mechanisms of vascular development.
Access restricted. Please log in or start a trial to view this content.
Protocol
The Institutional Animal Care and Use Committees of Yale University and the University of Virginia approved all animal experiments listed in this protocol.
1. Obtain mouse eyes for retinal isolation
- Prepare 1x ice-cold PBS and add 500 μL to each well of a 48-well plate.
- Euthanize neonatal mice at postnatal day six (P6) according to approved institutional guidelines. For this experiment, litters of approximately 4-8 neonatal mice are euthanized at P6 via isoflurane inhalation for at least three minutes after the respiratory arrest, followed by decapitation.
- Remove the eyes from each of the mice. Cut away the skin and membrane over the eye by cutting perpendicular to the eyelid using dissection scissors. Then, use forceps to press down gently above and below the eye so that the eye moves out of the socket.
- Carefully pinch underneath the eye with the forceps and cut the optic nerve that is keeping the eye attached. Then, place each eye in the 48-well plate in the prepared 1x ice-cold PBS until finished harvesting.
NOTE: Use one well per mouse, with both eyes from a single mouse in the same well.
- Carefully pinch underneath the eye with the forceps and cut the optic nerve that is keeping the eye attached. Then, place each eye in the 48-well plate in the prepared 1x ice-cold PBS until finished harvesting.
2. Isolate mouse retinal tissue
- Fill a Petri dish, lined with a dissection pad on the bottom, with 500 μL of 1x ice-cold PBS to submerge the eyes and place it under a dissection microscope set to 4.0x magnification.
- Suspend eyes in the dissection pad using a transfer pipette with a wide tip so as not to damage the eyes.
NOTE: Ensure the eyes are completely covered with PBS.
- Suspend eyes in the dissection pad using a transfer pipette with a wide tip so as not to damage the eyes.
- Using two fine dissection forceps, hold the optic nerve with one of the forceps for stabilization, and with the second forceps pierce a hole through the anterior chamber where the cornea and sclera connect (Figure 1B). Tear the hole in a circle about 75% of the way around the cornea.
- While still holding the optic nerve with one of the forceps, use the second forceps to gently tear the sclera off of the retinal tissue.
- As above, use the second forceps to gently tear off the vitreous body of the retinal tissue.
- Again, using the second forceps, gently remove the lens and hyaloid plexus vessels that did not come off when the vitreous body was removed. To do this, reach into the retina with open forceps until almost touching the retina, close the forceps to grab the lens and hyaloid plexus vessels, and pull the forceps out from the retina. This can be repeated until all vessels are removed.
NOTE: The hyaloid plexus resembles a clear, web-like structure.
- Fill 2 mL microcentrifuge tubes with 500 μL of 1x ice-cold PBS and place the retinas in the tubes. Isolate all retinas from the eyes and place them into ice-cold PBS before moving on.
NOTE: Use one tube per mouse, with two retinas from the same mouse sharing a tube. If retinal tissue is torn, transfer it in multiple pieces. The total time of retinal tissue dissection for a litter of mice should take 15-60 min, starting with euthanasia and ending with final retinal tissue isolation.

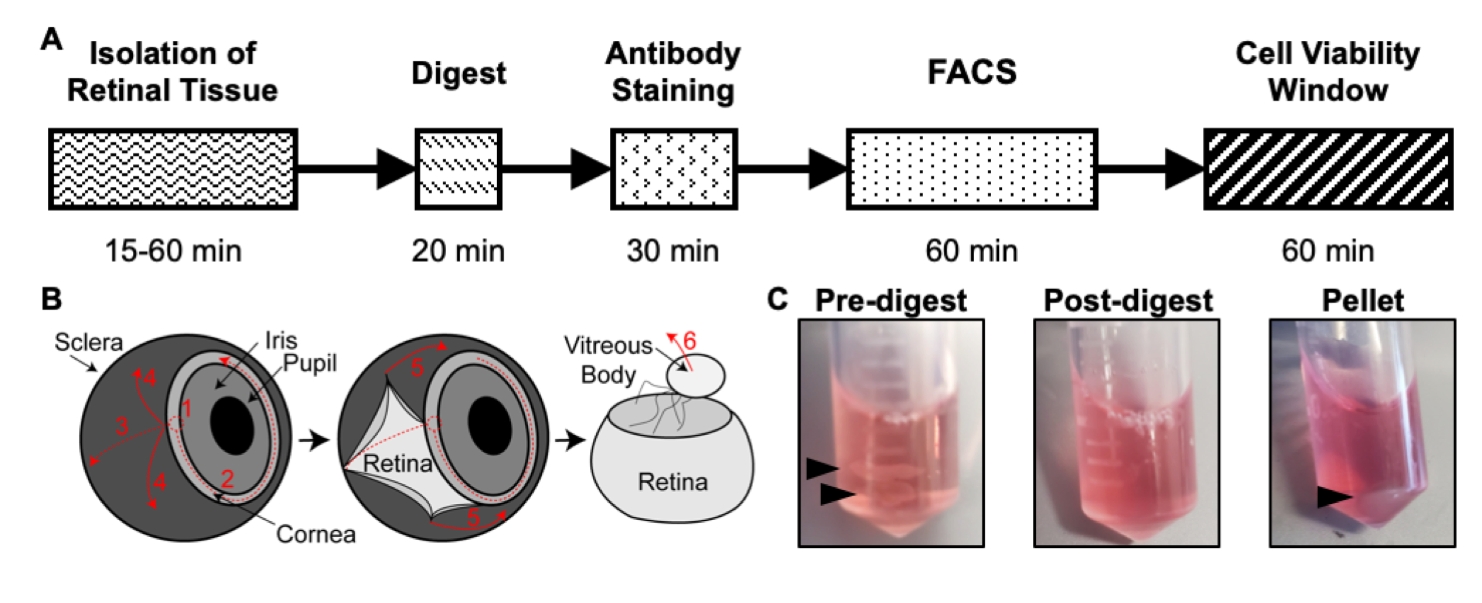
Figure 1: Overview of the isolation protocol. (A) Schematic of the isolation timeline with an estimated time for each step: Isolation of Retinal Tissue, Digest, Antibody Staining, FACS, and Cell Viability Window. (B) Step-by-step guide for isolation of retinal tissue from the eye, with numbered dissection steps: 1) pierce cornea, 2) tear cornea, 3) tear sclera, 4) remove sclera from the retina, 5) further remove sclera and connecting tissue from the retina, 6) remove the vitreous body and vitreous vessels from the retina. (C) Representative images of retinal tissue during various digestion steps: Pre-digest, Post-digest, Pellet (black arrows highlight retinal tissue or cell pellet). Republished with permission from Chavkin et al. published in S. Karger AG, Basel17. Please click here to view a larger version of this figure.
3. Digest retinal tissue into a single cell suspension
- Prepare 500 μL digestion solution for every two retinas isolated. Add FBS and Collagenase Type II to DMEM to a final concentration of 10% FBS and 1 mg/mL Collagenase Type II. Mix and warm the solution to 37 °C using a water bath.
- Remove excess PBS from the 2 mL microcentrifuge tubes by carefully pipetting. Leave enough PBS to completely cover the retinal tissue, about 100 μL in each tube.
- Add 500 μL of the digestion solution to each tube with retinal tissue (Figure 1C).
- Use a P1000 pipettor and pipette tip to pipette up and down the retinal tissue in the digestion solution five times.
- Incubate the digestion mixture in a 37 °C water bath for 20 min.
- Use a P1000 pipettor and pipette tip to pipette the digestion mixture up and down every 5 min. After incubation, the retinal tissue has dissolved into a single cell suspension, so the digestion mixture should be cloudy (Figure 1C).
4. Count cells
- Set a tabletop centrifuge at 4 °C and place the digestion mixture tubes inside. Pellet the digestion mixture by centrifugation at 375 x g for 5 min.
- Carefully remove the supernatant digestion solution by pipetting. Do not disturb the cell pellet (Figure 1C). Re-suspend the pellet in 500 μL of ice-cold 1x PBS by gently mixing up and down with the pipette.
- Count the cells with a hemocytometer under a microscope.
NOTE: Cell counts are approximately 1 x 10⁶ cells per two retinas. - Ensure the cells are properly resuspended by gentle mixing, and then aliquot 20 μL of cell suspension into three tubes for control staining (tube 1: IgG control, tube 2: CD31 control, and tube 3: CD45 control), as described and used previously17,18.
- Set a tabletop centrifuge at 4 °C and place tubes containing cells inside. Pellet the cells by centrifugation at 375 x g for 5 min.
5. Immunostain the cells with antibodies
- Prepare 100 μL of staining buffer per two retinas stained plus four control tubes. Add FBS, HEPES, and D-Glucose to HBSS buffer to a final concentration of 10% FBS, 10 mM HEPES, and 1 mg/mL D-Glucose.
- Obtain fluorescently conjugated antibodies against CD31 and CD45. Add the antibodies at a 1:100 dilution into the staining buffer (tube 1: IgG antibody only, tube 2: CD31 antibody only, and tube 3: CD45 antibody only). Add 1 μL of antibody per 100 μL of the staining buffer for a final antibody concentration of 2 μg/mL.
- Carefully remove the PBS from the washed cell pellet by pipetting.
- Resuspend the pellet in 100 μL of antibody staining solution per 0.5 x 10⁶ cells.
- Incubate the single-cell suspension with the antibody staining solution for 30 min on ice in dark. Tap the tubes every 10 min to gently mix the cells.
6. Prepare for fluorescence-activated cell sorting
- Set a tabletop centrifuge at 4 °C and place the tubes containing cells inside. Pellet cells by centrifugation at 375 x g for 5 min.
- Remove the supernatant and resuspend these cells in 500 μL of 1x PBS to wash.
- Set a tabletop centrifuge at 4 °C and place the tubes containing cells inside. Pellet cells by centrifugation at 375 x g for 5 min
- Prepare 1.5 mL of FACS Buffer (1% FBS in 1x PBS).
- Remove the supernatant and resuspend the cell pellet in 300 μL of FACS Buffer by gently mixing with a pipettor.
- Add propidium iodide (PI) to the sample tubes containing the FACS buffer to a final concentration of 0.5 μg/mL. PI is used as a viability marker.
- Transfer and combine the cell suspensions into 5 mL test tubes through a cell strainer snap cap. The cell strainer snap cap should contain a 35 μm filter, and the cell suspensions can be pipetted directly onto the filter.
- Keep the FACS tubes on ice in the dark and transfer them to the cell sorter.
7. Set up the FACS instrument
- Install a 100 µm nozzle into a FACS instrument.
NOTE: This size nozzle minimizes collection volume and maximizes isolated cell density. - Prepare 250 μL of 1x PBS into a 1.5 mL microcentrifuge tube as a collection tube to be installed into the FACS instrument.
8. Isolate viable endothelial cells via FACS
- Turn on the FACS instrument and the computer. Click on the FACS software icon to open the FACS software on the computer to run and operate the FACS instrument. Perform routine quality control tests.
- Load the control-stained samples into the FACS instrument to adjust the axes. Start with IgG antibody only cells to generate and adjust FSC and SSC, then CD31-antibody only to generate and adjust CD31, and then CD45-antibody only to generate and adjust CD45. Record data from control samples.
- Load stained sample cells into the FACS instrument and run the sample.
- Gate the cells based on forward-scatter and side-scatter (FSC-A and SSC-A, respectively) parameters (Figure 2A).
NOTE: The FSC-A and SSC-A parameters are used to select cells based on size, density, granularity, surface properties, and refractive index. - Gate cells by FSC-A and FSC-H to identify cell doublets and only collect single cells (Figure 2A).
NOTE: The FSC-A and FSC-H parameters are used to select single cells based on the principle that during forward scattering, cell doublets will be droplets containing a greater area-to-height ratio. - Gate cells by PI and SSC-A to identify viable cells (Figure 2A).
NOTE: Viable cells will be PI-negative. - Make a CD31+/CD45- gate with controls and gate cells by CD31 and CD45 (Figure 2A,B).
- Insert a collection tube with 250 μL of FACS buffer.
- Start sorting cells that are CD31-positive/CD45-negative into the installed collection tube.
- Keep the collection tubes on ice for further analysis. Samples can be processed for next-generation sequencing applications at this step1.
9. Perform viability assay
- Mix 10 μL of cells with 10 μL of 0.4% trypan blue solution to assess cell viability.
- Count viable cells by pipetting the stained mixture onto a hemocytometer slide. Place the slide under a microscope for accurate viability counts. Count blue cells as non-viable and count clear cells as viable.
- Divide the viable cell count by the total cell count to calculate percent viability.
10. Perform gene expression assay
- Obtain 10,000-20,000 cells per sample and perform RNA isolation to analyze murine retinal endothelial cell gene expression. RNA isolation is performed using a commercially available kit that uses ethanol-based RNA precipitation, and then centrifugation and membrane columns to wash and elute purified RNA from cell lysate. Samples can be processed for some next-generation sequencing applications at this step1.
- Convert the RNA to cDNA using reverse transcriptase enzyme and supporting reagents19.
- Quantify using a DNA binding dye and a quantitative PCR (qPCR) machine20. Load cDNA samples in a 384-well qPCR plate with primers to amplify genes of interest. Reaction volume should total to 10 µL, including DNA binding dye, which will be used to quantify gene amplification.
- Use CD31, VE-Cadherin, CD45, and β-actin forward and reverse primers to measure gene expression.
- Use the sample for next-generation sequencing applications1.
Access restricted. Please log in or start a trial to view this content.
Results
Digestion of retinal tissue and immunostaining for CD31 and CD45 results in an identifiable population of CD31+/CD45- endothelial cells after gating for cells, single cells, and viability (Figure 2A). CD45 immunostaining is required to eliminate CD31+/CD45+ cells, which include platelets and some leukocytes21. Controls should be performed for each experiment to show antibody specificity and guide gating strategy (Figure 2B). This percenta...
Access restricted. Please log in or start a trial to view this content.
Discussion
This protocol describes a method for the isolation of endothelial cells from postnatal murine retinal tissue that has been optimized for high cell number, purity, and viability. Cell purity is obtained by FACS isolation of endothelial cell populations from the digested single-cell suspension by CD31+/CD45- immunostaining. Quality of isolation is quantified in assays for viability by Trypan blue staining and gene expression by qPCR for CD31, CD45, and VE-Cadherin (although VE-Cadherin was not used for immunostaining). The...
Access restricted. Please log in or start a trial to view this content.
Disclosures
The authors have no relevant disclosures.
Acknowledgements
Thank you to the Yale Flow Cytometry Facility, the University of Virginia Flow Cytometry Core Facility, the Yale Center for Genomic Analysis, and the University of Virginia Genome Analysis and Technology Core for their effort, expertise, and advice in contributing to the presented experiments. This study was funded by NIH grants to N.W.C. (T32 HL007224, T32 HL007284), S.C. (T32 HL007284), K.W. (R01 HL142650), and K.K.H. (R01 HL146056, R01 DK118728, UH3 EB025765).
Access restricted. Please log in or start a trial to view this content.
Materials
| Name | Company | Catalog Number | Comments |
| 2 mL Eppendorf safe-lock tubes | USA Scientific | 4036-3352 | |
| 5 ml Falcon Test Tubes with Cell Strainer Snap Cap | Corning | 352235 | |
| 60 mm Non TC-treated Culture Dish | Corning | 430589 | |
| APC Rat Anti-Mouse CD31 | BD Biosciences | 551262 | |
| APC Rat IgG2a κ Isotype Control | BD Biosciences | 553932 | |
| BD FACSChorus Software | BD Biosciences | FACSCHORUS | |
| BD FACSMelody Cell Sorter | BD Biosciences | FACSMELODY | |
| Collagenase Type II | Sigma-Aldrich | 234115 | |
| Costar 48-well Clear TC-treated Multiple Well Plates, Individually Wrapped, Sterile | Corning | 3548 | |
| D-Glucose | Gibco | A2494001 | |
| Disposable Graduated Transfer Pipettes | Fisher Scientific | 12-711-9AM | |
| Dissecting Pan Wax | Carolina | 629100 | |
| Dissection scissors | Fine Science Tools | 14085-08 | |
| Dissection Stereo Microscope M165 FC | Leica | M165FC | |
| Dulbecco's Modified Eagle Medium (DMEM) | Gibco | 11965-052 | |
| Dulbecco’s Phosphate Buffered Saline (PBS) | Gibco | 14190144 | |
| Eppendorf Flex-Tubes Microcentrifuge Tubes 1.5 mL | Sigma-Aldrich | 22364120 | |
| Fetal Bovine Serum (FBS) | Gemini Bio | 100-106 | |
| Fine dissection forceps | Fine Science Tools | 11250-00 | |
| Hank's Buffered Salt Solution (HBSS) | Gibco | 14175095 | |
| HEPES (1M) | Gibco | 15630130 | |
| iScript cDNA Synthesis Kit | Bio-Rad | 1708890 | |
| Isoflurane, USP | Covetrus | 11695067772 | |
| Isotemp General Purpose Deluxe Water Bath | Fisher Scientific | FSGPD20 | |
| Primer: ActB_Forward: 5’- agagggaaatcgtgcgtgac -3’ | Integrated DNA Technologies | N/A | |
| Primer: ActB_Reverse: 5’- caatagtgatgacctggccgt -3’ | Integrated DNA Technologies | N/A | |
| Primer: CD31_Forward: 5’- gagcccaatcacgtttcagttt -3’ | Integrated DNA Technologies | N/A | |
| Primer: CD31_Reverse: 5’- tccttcctgcttcttgctagct -3’ | Integrated DNA Technologies | N/A | |
| Primer: CD45_Forward: 5’- gggttgttctgtgccttgtt -3’ | Integrated DNA Technologies | N/A | |
| Primer: CD45_Reverse: 5’- ctggacggacacagttagca -3’ | Integrated DNA Technologies | N/A | |
| Primer: VE-Cadherin_Forward: 5’- tcctctgcatcctcactatcaca -3’ | Integrated DNA Technologies | N/A | |
| Primer: VE-Cadherin_Reverse: 5’- gtaagtgaccaactgctcgtgaat -3’ | Integrated DNA Technologies | N/A | |
| Propidium iodide | Sigma-Aldrich | P4864 | |
| RNeasy Plus Mini Kit | Qiagen | 74134 | |
| Sorvall Legend Micro 21R Centrifuge, Refrigerated | ThermoFisher | 75002477 | |
| SYBR-Green iTaq Universal SYBR Green Supermix | Bio-Rad | 172-5120 | |
| Trypan Blue Solution | ThermoFisher | 15250061 | |
| V450 Rat Anti-Mouse CD45 | BD Biosciences | 560501 | |
| V450 Rat IgG2b, κ Isotype Control | BD Biosciences | 560457 |
References
- Slatko, B. E., Gardner, A. F., Ausubel, F. M. Overview of next-generation sequencing technologies. Current Protocols in Molecular Biology. 122 (1), 59(2018).
- Chavkin, N. W., Hirschi, K. K. Single cell analysis in vascular biology. Frontiers in Cardiovascular Medicine. 7, 42(2020).
- Ma, F., Hernandez, G. E., Romay, M., Iruela-Arispe, M. L. Single-cell RNA sequencing to study vascular diversity and function. Current Opinion in Hematology. 28 (3), 221-229 (2021).
- Potter, A. S., Potter, S. S., S, Dissociation of tissues for single-cell analysis. Methods in Molecular Biology. 1926, 55-62 (2019).
- Braga, F. A. V., Miragaia, R. J. Tissue handling and dissociation for single-cell RNA-seq. Single Cell Methods: Methods in Molecular Biology. 1979, 9-21 (2019).
- Brink, S. C., et al. Single-cell sequencing reveals dissociatin-induced gene expression in tissue subpopulations. Nature Methods. 14 (10), 935-936 (2017).
- Skulska, K., Wegrzyn, A. S., Chelmonska-Soyta, A., Chodaczek, G. Impact of tissue enzymatic digestion on analysis of immune cells in mouse reproductive mucosa with a focus on gammadelta T cells. Journal of Immunological Methods. 474, 112665(2019).
- Connolly, S., Hores, T., Smith, L., D'Amore, P. Characterization of vascular development in the mouse retina. Microvascular Research. 36 (3), 275-290 (1988).
- Crist, A., Young, C., Meadows, S. Characterization of arteriovenous identity in the developing neonate mouse retina. Gene Expression Patterns: GEP. 23-24, 22-31 (2017).
- dela Paz, N. G., D'Amore, P. A. Arterial versus venous endothelial cells. Cell and Tissue Research. 335 (1), 5-16 (2009).
- Fang, J. S., Hirschi, K. K. Molecular regulation of arteriovenous endothelial cell specification. F1000Res. 8, (2019).
- Smith, L. E., et al. Oxygen-induced retinopathy in the mouse. Investigative Ophthalmology and Visual Science. 35 (1), 101-111 (1994).
- Pitulescu, M. E., Schmidt, I., Benedito, R., Adams, R. H. Inducible gene targeting in the neonatal vasculature and analysis of retinal angiogenesis in mice. Nature Protocols. 5 (9), 1518-1534 (2010).
- Ruiz, S., et al. A mouse model of hereditary hemorrhagic telangiectasia generated by transmammary-delivered immunoblocking of BMP9 and BMP10. Scientific Reports. 6, 37366(2016).
- Fang, J. S., et al. Shear-induced Notch-Cx37-p27 axis arrests endothelial cell cycle to enable arterial specification. Nature Communication. 8 (1), 2149(2017).
- Ola, R., et al. SMAD4 prevents flow induced arterial-venous malformations by inhibiting Casein Kinase 2. Circulation. 138 (21), 2379-2394 (2018).
- Chavkin, N. W., Walsh, K., Hirschi, K. K. Isolation of highly purified and viable retinal endothelial cells. Journal of Vascular Research. 58 (1), 49-57 (2020).
- Hulspas, R., O'Gorman, M. R. G., Wood, B. L., Gratama, J. W., Sutherland, D. R. Considerations for the control of background fluorescence in clinical flow cytometry. Cytometry PartB: Clinical Cytometry. 76 (6), 355-364 (2009).
- Bachman, J. Reverse-transcription PCR (RT-PCR). Methods in Enzymology. 530, 67-74 (2013).
- Green, M. R., Sambrook, J. Quantification of RNA by real-time Reverse Transcription-Polymerase Chain Reaction (RT-PCR). Cold Spring Harbour Protocols. 2018 (10), (2018).
- Liu, L., Shi, G. P. CD31: beyond a marker for endothelial cells. Cardiovascular Research. 94 (1), 3-5 (2012).
- Zarkada, G., et al. Specialized endothelial tip cells guide neuroretina vascularization and blood-retina-barrier formation. Developmental Cell. 56 (15), 2237-2251 (2021).
- Su, X., Sorenson, C. M., Sheibani, N. Isolation and characterization of murine retinal endothelial cells. Molecular Vision. 9, 171-178 (2003).
- Benedito, R., et al. The notch ligands Dll4 and Jagged1 have opposing effects on angiogenesis. Cell. 137 (6), 1124-1135 (2009).
- Daneman, R., et al. Wnt/beta-catenin signaling is required for CNS, but not non-CNS, angiogenesis. Proceedings of the National Academy of Sciences of the United States of America. 106 (2), 641-646 (2009).
- Okabe, K., et al. Neurons limit angiogenesis by titrating VEGF in retina. Cell. 159 (3), 584-596 (2014).
- Crist, A. M., Lee, A. R., Patel, N. R., Westhoff, D. E., Meadows, S. M. Vascular deficiency of Smad4 causes arteriovenous malformations: a mouse model of Hereditary Hemorrhagic Telangiectasia. Angiogenesis. 21 (2), 363-380 (2018).
- Kim, Y. H., Choe, S. W., Chae, M. Y., Hong, S., Oh, S. P. SMAD4 deficiency leads to development of arteriovenous malformations in neonatal and adult mice. Journal of the American Heart Association. 7 (21), 009514(2018).
- Ma, W., et al. Absence of TGFbeta signaling in retinal microglia induces retinal degeneration and exacerbates choroidal neovascularization. eLife. 8, 42049(2019).
- Luo, W., et al. Arterialization requires the timely suppression of cell growth. Nature. 589 (7842), 437-441 (2021).
- Lawson, N. D., Vogel, A. M., Weinstein, B. M. sonic hedgehog and vascular endothelial growth factor act upstream of the Notch pathway during arterial endothelial differentiation. Developmental Cell. 3 (1), 127-136 (2002).
- Larrivee, B., et al. ALK1 signaling inhibits angiogenesis by cooperating with the Notch pathway. Developmental Cell. 22 (3), 489-500 (2012).
- Wythe, J. D., et al. ETS factors regulate Vegf-dependent arterial specification. Developmental Cell. 26 (1), 45-58 (2013).
- Davis, D. M., Purvis, J. E. Computational analysis of signaling patterns in single cells. Seminars in Cell and Developmental Biology. 0, 35-43 (2015).
- Gaudet, S., Miller-Jensen, K. Redefining signaling pathways with an expanding single-cell toolbox. Trends in Biotechnology. 34 (6), 458-469 (2016).
- Aibar, S., et al. SCENIC: single-cell regulatory network inference and clustering. Nature Methods. 14 (11), 1083-1086 (2017).
- Trapnell, C., et al. The dynamics and regulators of cell fate decisions are revealed by pseudotemporal ordering of single cells. Nature Biotechnology. 32 (4), 381-386 (2014).
Access restricted. Please log in or start a trial to view this content.
Reprints and Permissions
Request permission to reuse the text or figures of this JoVE article
Request PermissionExplore More Articles
This article has been published
Video Coming Soon
Copyright © 2025 MyJoVE Corporation. All rights reserved