
A subscription to JoVE is required to view this content. Sign in or start your free trial.
Method Article
Measurement of Tumor T2* Relaxation Times after Iron Oxide Nanoparticle Administration
In This Article
Summary
We present a standardized protocol for the quantification of T2* relaxation times of tumors using external software. Multi-echo gradient echo images are acquired and fed into the software to create tumor T2* maps and measure tumor T2* relaxation times.
Abstract
T2* relaxometry is one of the established methods to measure the effect of superparamagnetic iron oxide nanoparticles on tumor tissues with magnetic resonance imaging (MRI). Iron oxide nanoparticles shorten the T1, T2, and T2* relaxation times of tumors. While the T1 effect is variable based on the size and composition of the nanoparticles, the T2 and T2* effects are usually predominant, and T2* measurements are the most time-efficient in a clinical context. Here, we present our approach to measuring tumor T2* relaxation times, using multi-echo gradient echo sequences, external software, and a standardized protocol for creating a T2* map with scanner-independent software. This facilitates the comparison of imaging data from different clinical scanners, different vendors, and co-clinical research work (i.e., tumor T2* data obtained in mouse models and patients). Once the software is installed, the T2 Fit Map plugin needs to be installed from the plugin manager. This protocol provides step-by-step procedural details, from importing the multi-echo gradient echo sequences into the software, to creating color-coded T2* maps and measuring tumor T2* relaxation times. The protocol can be applied to solid tumors in any body part and has been validated based on preclinical imaging data and clinical data in patients. This could facilitate tumor T2* measurements for multi-center clinical trials and improve the standardization and reproducibility of tumor T2* measurements in co-clinical and multi-center data analyses.
Introduction
Noninvasive quantification of tumor T2* relaxation times in various tissues of the body with magnetic resonance imaging (MRI) is widely established1. The rationale for this article is to provide a protocol for the measurement of tumor T2* relaxation times which is independent of scanner software like Osirix2. This will allow uniform analyses of imaging data from different centers, different scanners, and different vendors. Indeed, thousands of users could potentially use the same approach, thereby increasing the standardization of tumor T2* measurements. T2* measurements are used for different purposes by neuroradiologists, cardiac imaging experts, and abdominal imaging experts, among others. MRI pulse sequences for measurements of tissue T2* relaxation times have been applied and optimized for the assessment of intracranial bleeds3, hepatic iron content1,4, and cardiac iron content5,6, among others. Other investigators have used T2* measurements to generate quantitative estimates of iron oxide nanoparticle accumulations in malignant tumors7,8. However, many of these previous approaches utilized institutional software or specific scanner software, which would be limited to use at a specific institution or for processing data obtained on a specific scanner. Here, we describe a universally applicable approach for generating tumor T2* maps and tumor T2* relaxation times based on preclinical or clinical MRI data from any scanner that can generate multi-echo gradient echo images. The required gradient echo sequence should have very short first echo times and close inter-echo spacing9,10. The multi-echo gradient echo images are then fed into the external software, tumor T2* maps are calculated, and tumor T2* relaxation times are measured. The T2 Fit Map plugin in the external models' T2* decay curves as a monoexponential fit to S(t) = Soe-t/T2* 11 where S(t) represents the signal or process value at a given time t; S0 is the initial value of the signal or process at t = 0; t denotes time; T2*, also known as the apparent transverse relaxation time, characterizes the decay rate of the signal or process; and e is the base of the natural logarithm (approximately equal to 2.71828). The equation describes an exponential decay, where the signal or process decreases over time as a function of the decay rate T2*. The larger the value of T2*, the slower the decay rate, and vice versa. The same software can also be used to input multi-echo spin echo images and generate tumor T2 values by fitting the T2 decay curve to S(t) = Soe-t/T2. The curve fitting was performed using external software, without incorporating a constant offset. Both decay curves exhibit single exponential behavior, with T2* demonstrating a shorter duration compared to T2.
In patients with hemosiderosis and hemochromatosis, the quantification of liver iron content by tissue biopsy is the gold standard, whereas noninvasive MR imaging is the point of care for establishing baseline values and monitoring changes over time noninvasively12,13. While generating T2* maps for liver iron quantification is well established4, there is no standardized protocol to measure tumor T2* relaxation times. While T2* maps can also be generated by scanner software, it is limited to a specific scanner and vendor. In the field of oncology, serial imaging studies of a given patient often occur on different scanners, and multicenter MRI data are acquired based on imaging studies from different scanners and different vendors. In addition, co-clinical imaging research is being increasingly implemented and requires the comparison of MRI data of patients and mouse models that simulate their tumor. The purpose of this protocol is to provide a protocol for the measurement of tumor T2* relaxation times that are independent of the scanner software. This will allow uniform analysis of imaging data from different centers and different scanners. Indeed, thousands of users could potentially use the same approach, thereby increasing the standardization and reproducibility of tumor T2* measurements. Our protocol utilizes external software, which can be downloaded from the internet. Multi-echo gradient echo images are fed into the software and fit to a formula for monoexponential decay to generate a T2* map, on which tumor T2* relaxation times can be measured using operator-defined regions of interest (ROIs)5. Iron oxide nanoparticles can be infused at different doses14, In our study, the patient received a Ferumoxytol injection (30 mg/mL) containing 510 mg of elemental iron in a 17 mL volume, at a dosage of 5 mg elemental iron per kg body weight. Subsequently multi-echo gradient echo sequences were obtained15 using set sequence parameters for data acquisition.
Protocol
This protocol has been generated for a prospective clinical trial and co-clinical research. The study was compliant with the Health Insurance Portability and Accountability Act (HIPAA) and approved by the Stanford University institutional review board (IRB). All patients or their legally authorized representative signed a written informed consent, and all children between 7 and 18 years of age signed an assent form.
1. Installing and starting the T2 Fit Map plugin
- Start the Osirix software. Install the T2 Fit Map plugin from the plugin manager and restart the software.
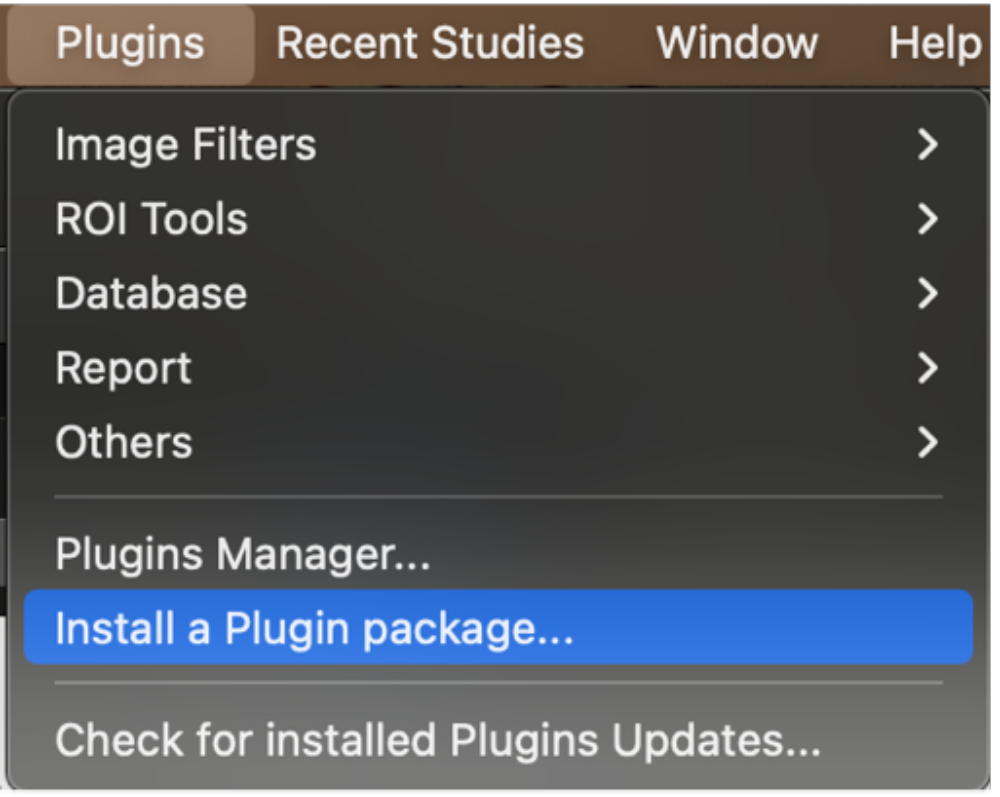
- On the menu bar, click the Plugins button. Click on the drop-down menu and select Install a plugin package (Figure 1).
- Once the plugin manager is loaded, select the available plugins from the drop-down menu and then T2 Fit Map (Figure 2).
- Click download & install. Close the plugin manager and restart the software.
- Load the multi-echo gradient echo sequence images as DICOM files into the software.
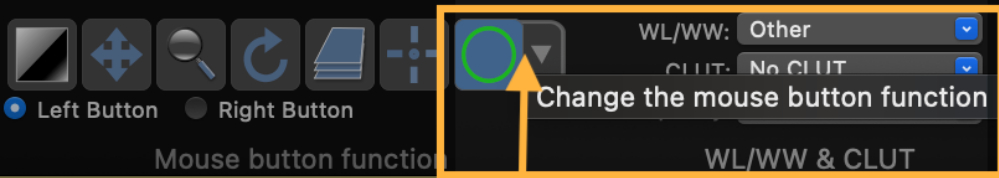
- Change the mouse button function to draw a Region of Interest (ROI) (Figure 3).
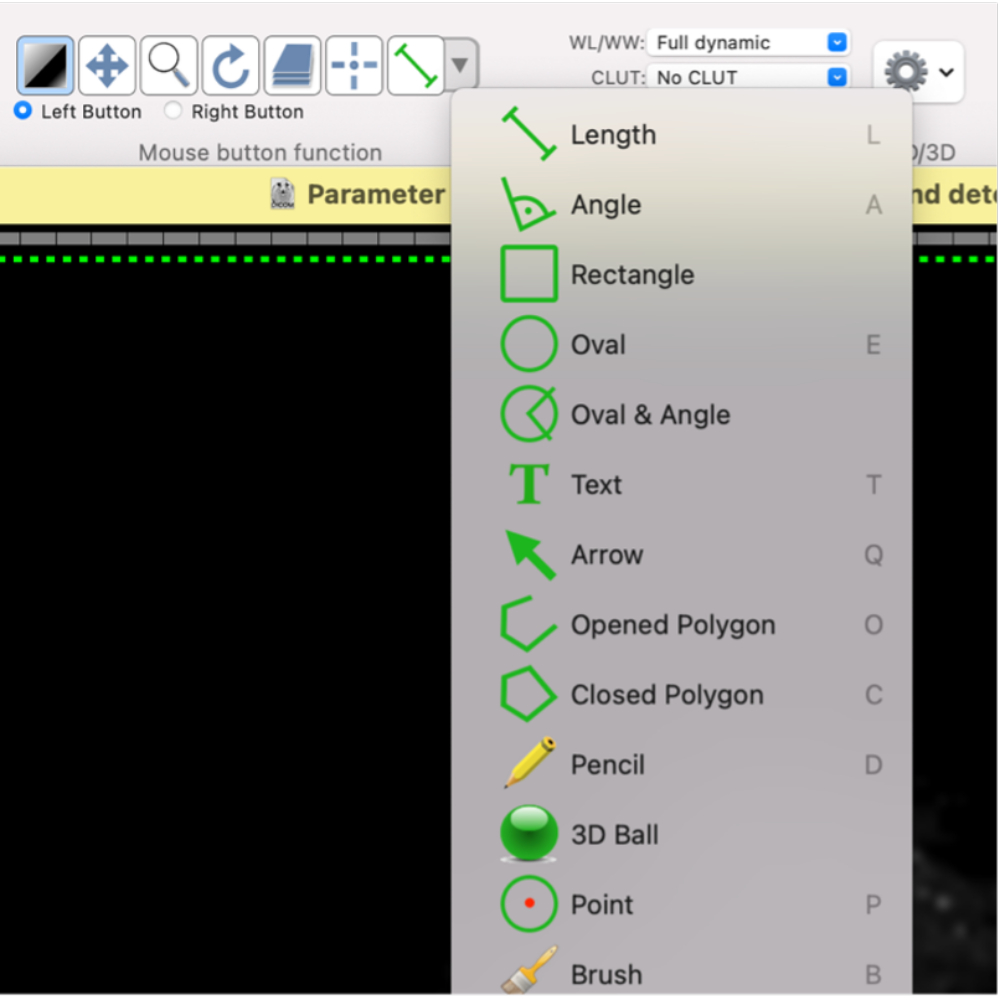
- Using this mouse button function, define a shape for the required ROI: select Oval or Closed Polygon, or the desired shape from the drop-down menu (Figure 4).
- Draw ROIs in the required images with different echo times (TEs).
- Select the ROIs in all the images with different TEs for which the T2* map is required.
- Click the Plugins button, select Image filters from the drop-down menu, and then select T2 Fit Map.
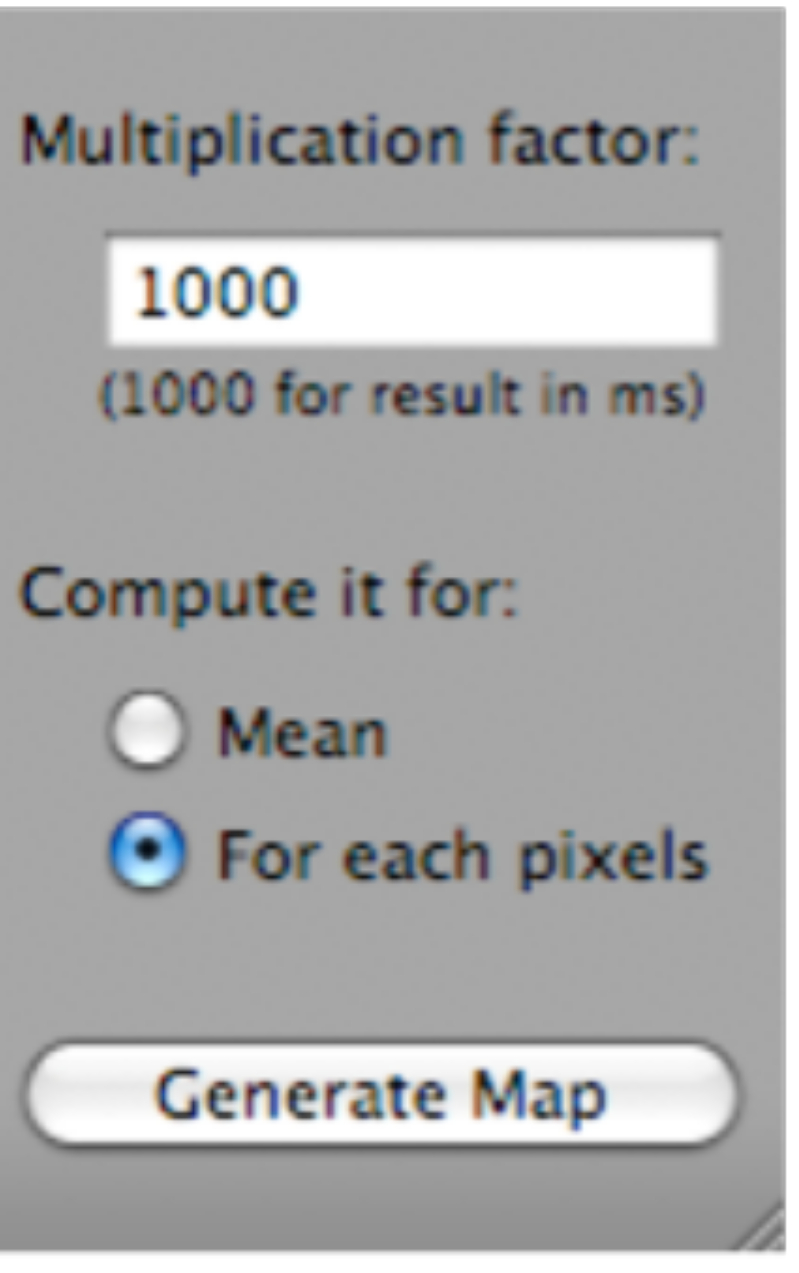
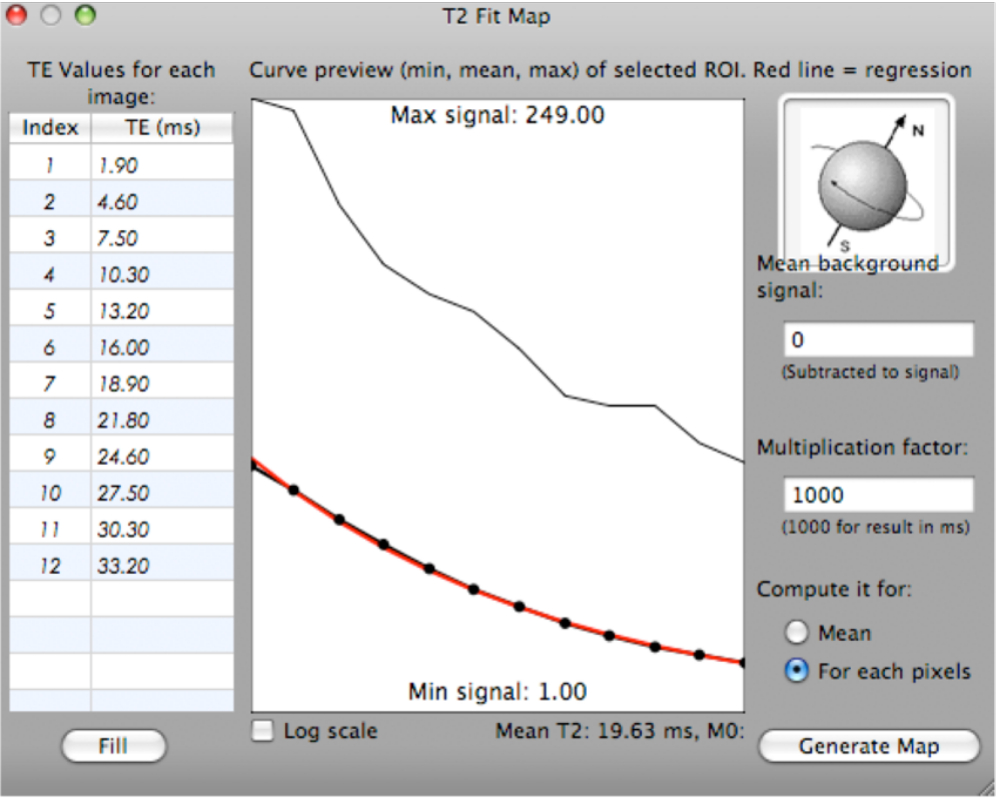
- Click on T2 Fit Map. A dialog box will open; click on Generate Map (which is located at the bottom of the dialog box) (Figure 5).
NOTE: A fitting curve is generated with minimum, mean, and maximum T2* values for the selected ROIs with various TEs (ms). The mean T2* value is calculated and displayed below the curve (Figure 6).

Figure 1: Selecting 'Install a plugin package' from the drop-down menu. Please click here to view a larger version of this figure.

Figure 2: Selecting 'T2 Fit Map' from the available plugins. Please click here to view a larger version of this figure.

Figure 3: Screenshot demonstrating how to change the mouse button function to draw a region of interest (ROI). Please click here to view a larger version of this figure.

Figure 4: Screenshot showing how to select different shapes for the ROI. Please click here to view a larger version of this figure.

Figure 5: Screenshot showing how to select 'Generate Map' after selecting 'T2 Fit Map'. Please click here to view a larger version of this figure.

Figure 6: Screenshot showing the generation of a fitting curve for T2* values. Please click here to view a larger version of this figure.
2. Exclusion of noise using the definition of mask
NOTE: To define a mask on the first echo of the T2map_MSME data used to calculate the parametric maps, set a lower first-echo signal threshold for T2* value calculation (the T2* map volume will now exclude the pixels with signals too low for accurate calculation at the first multi-spin multi-echo (MSME) echo. The threshold can be increased to exclude more pixels, or decreased to include more pixels).
- To define the mask ROI on an image series outside the parametric data, open the desired series (e.g., first echo of the T2map_MSME with TE = 15) and select a slice.
- At bottom of the ROI drop-down menu, select Grow Region….
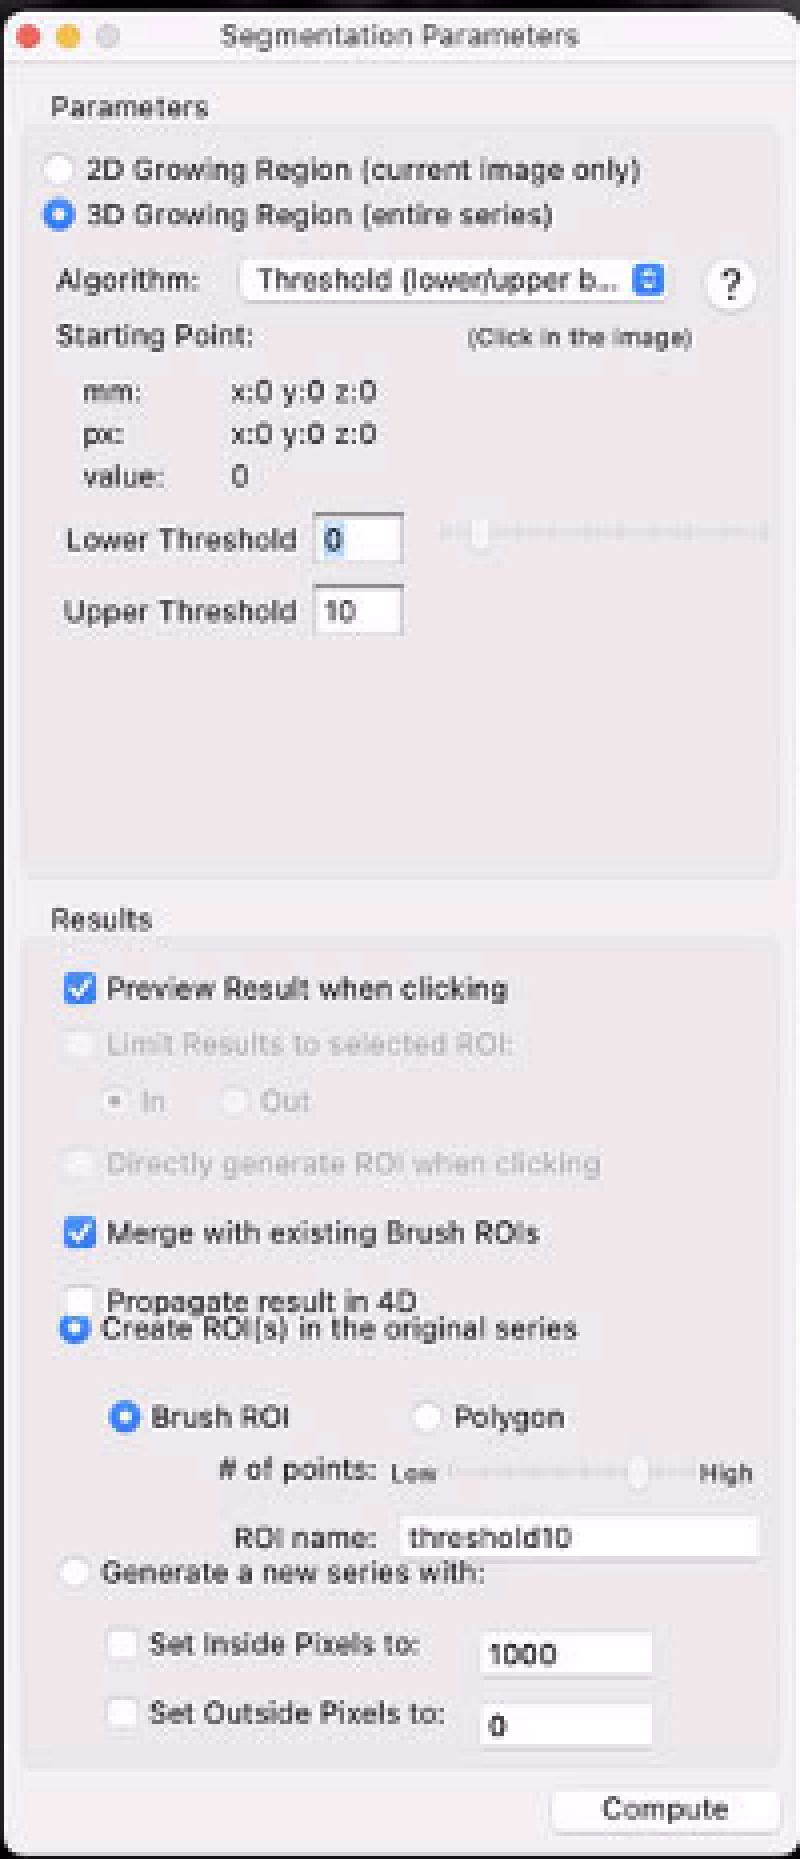
- Select the 3D Growing Region… radio button (Figure 7).
- In the Algorithm drop-down menu, select Threshold (lower/upper bounds).
- Set the lower and upper thresholds to 0 and X% of the contralateral calf muscle signal, respectively (e.g., set the threshold to the value that will mask out the most speckle in the tumor ROI and will leave the most evaluable tumor T2(*)s).
- Set the ROI name as desired.
- Click on the image to place a seed for ROI growing.
- Click the Compute button.
- In the ROI menu, select Save All ROIs of this Series… (Figure 8).
NOTE: Now, the ROI defining the area to mask out of the parametric maps has been saved and can be applied to the parametric data. - Open the Parametric dataset in the 4D viewer.
- In the ROI menu, select Import ROI(s)....
NOTE: The mask ROI is now in the first parametric series. - Check that the ROIs are in the first 3D volume and not 4D.
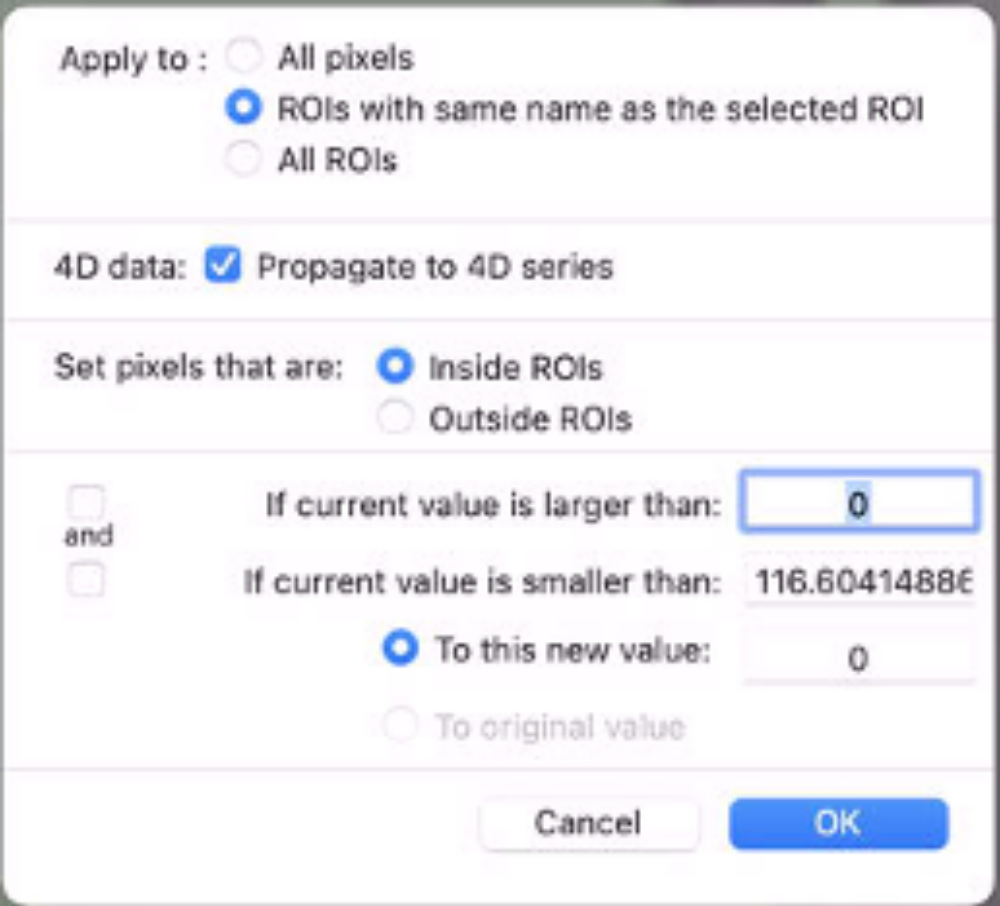
- Apply mask to map the data. To do so, at the bottom of the ROI drop-down menu, select Set Pixel Values To. Then, select apply to: ROIs with same name… (Figure 9).
- Check the Propagate to 4D series box.
- Set pixels that are Inside ROIs.
- Set To this new value: as 0.

Figure 7: Screenshot showing the segmentation parameters. Please click here to view a larger version of this figure.

Figure 8: Screenshot showing how to select "Save All ROIs of this Series…". Please click here to view a larger version of this figure.

Figure 9: Screenshot showing the values to be inputted in "Set Pixel Values To". Please click here to view a larger version of this figure.
Results

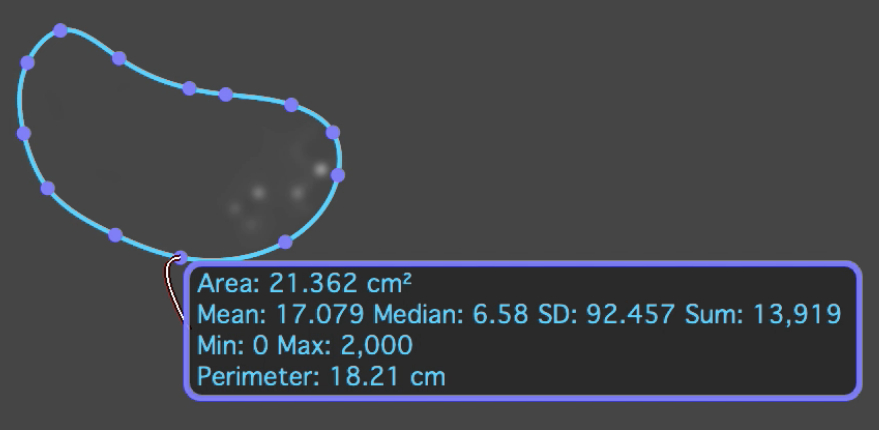
Figure 10: The T2* map with an ROI overlaid on the metastatic osteosarcoma lesion which shows the mean and standard deviation T2* value. Please click here to view a larger version of this figure.
Discussion
Our protocol allows us to measure tumor T2* relaxation times based on multi-echo gradient-echo sequences, an external software, and a plugin for creating T2* maps. The critical steps within the protocol are the inclusion of the multi-echo gradient-echo sequence with very short TEs into the scanning protocol, and the monoexponential fit of the multi-echo gradient-echo images using external software. It is important to arrange the input multi-echo gradient-echo images according to their acquisition times. This can be achie...
Disclosures
The authors have nothing to disclose.
Acknowledgements
This work was in part supported by a grant from the National Cancer Institute, grant number U24CA264298. We thank Dawn Holley, Kim Halbert, and Mehdi Khalighi from the PET/MRI Metabolic Service Center for their assistance with the acquisition of PET/MRI scans at the Lucas Research Center at Stanford. We thank the members of the Daldrup-Link lab for valuable input and discussions regarding this project.
Materials
| Name | Company | Catalog Number | Comments |
| OsiriX | Pixmeo SARL | https://www.osirix-viewer.com/ | |
| 3T GE MR 750 | GE Healthcare, Chicago, IL | ||
| FERAHEME (ferumoxytol injection) | AMAG Pharmaceuticals, Inc. 1100 Winter Street Waltham, MA 02451 |
References
- Garbowski, M. W., et al. Biopsy-based calibration of T2* magnetic resonance for estimation of liver iron concentration and comparison with R2 Ferriscan. Journal of Cardiovascular Magnetic Resonance. 16 (1), 40 (2014).
- . OsiriXDICOM Viewer Available from: https://www.osirix-viewer.com/ (2023)
- Linfante, I., Llinas, R. H., Caplan, L. R., Warach, S. MRI features of intracerebral hemorrhage within 2 hours from symptom onset. Stroke. 30 (11), 2263-2267 (1999).
- Labranche, R., et al. Liver iron quantification with MR imaging: a primer for radiologists. Radiographics. 38 (2), 392-412 (2018).
- Triadyaksa, P., Oudkerk, M., Sijens, P. E. Cardiac T2* mapping: Techniques and clinical applications. Journal of Magnetic Resonance Imaging. 52 (5), 1340-1351 (2020).
- Anderson, L. J., et al. Cardiovascular T2-star (T2*) magnetic resonance for the early diagnosis of myocardial iron overload. European Heart Journal. 22 (23), 2171-2179 (2001).
- Seo, M., et al. Estimation of T2* relaxation time of breast cancer: correlation with clinical, imaging and pathological features. Korean Journal of Radiology. 18 (1), 238-248 (2017).
- Serkova, N. J. Nanoparticle-based magnetic resonance imaging on tumor-associated macrophages and inflammation. Frontiers in Immunology. 8, 590 (2017).
- Chen, X., Qiu, B. A pilot study of short T2* measurements with ultrashort echo time imaging at 0.35 T. BioMedical Engineering OnLine. 17 (1), 70 (2018).
- Yi, J., Lee, Y. H., Song, H. -. T., Suh, J. -. S. Comparison of T2* between regular echo time and ultrashort echo time with 3D cones at 3 tesla for knee meniscus. Medicine. 97 (48), e13443 (2018).
- Weishaupt, D., et al. . How Does MRI Work?: An Introduction to the Physics and Function of Magnetic Resonance Imaging. , (2006).
- Wood, J. C. Guidelines for quantifying iron overload. Hematology. American Society of Hematology. 2014 (1), 210-215 (2014).
- Branisso, P. P. F., et al. Non-invasive methods for iron overload evaluation in dysmetabolic patients. Annals of Hepatology. 27 (4), 100707 (2022).
- Schaefer, B., Meindl, E., Wagner, S., Tilg, H., Zoller, H. Intravenous iron supplementation therapy. Molecular Aspects of Medicine. 75, 100862 (2020).
- Haacke, E. M., Mittal, S., Wu, Z., Neelavalli, J., Cheng, Y. -. C. N. Susceptibility-weighted imaging: technical aspects and clinical applications, part 1. AJNR: American Journal of Neuroradiology. 30 (1), 19-30 (2009).
- . T2 Mapping Slicer Extension Available from: https://github.com/gattia/Slicer-T2mapping (2021)
- 3D Slicer image computing platform. 3D Slicer Available from: https://slicer.org/ (2023)
- Messroghli, D. R., et al. An open-source software tool for the generation of relaxation time maps in magnetic resonance imaging. BMC Medical Imaging. 10, 16 (2010).
- . GNU Octave Available from: https://octave.org/ (2023)
- Chavhan, G. B., Babyn, P., Thomas, B., Shroff, M., Haacke, E. M. Principles, techniques, and applications of T2*-based MR imaging and its special applications. Radiographics. 29 (5), 1433-1449 (2009).
- Aghighi, M., et al. Magnetic resonance imaging of tumor associated macrophages: clinical translation. Clinical Cancer Research. 24 (17), 4110-4118 (2018).
- Trujillo-Alonso, V., et al. FDA-approved ferumoxytol displays anti-leukaemia efficacy against cells with low ferroportin levels. Nature Nanotechnology. 14 (6), 616-622 (2019).
- Ishiyama, K., et al. Tumor-liver contrast and subjective tumor conspicuity of respiratory-triggered T2-weighted fast spin-echo sequence compared with T2*-weighted gradient recalled-echo sequence for ferucarbotran-enhanced magnetic resonance imaging of hepatic malignant tumors. Journal of Magnetic Resonance Imaging. 27 (6), 1322-1326 (2008).
- Hirokawa, Y., et al. Hepatic lesions: improved image quality and detection with the periodically rotated overlapping parallel lines with enhanced reconstruction technique-evaluation of SPIO-enhanced T2-weighted MR images. Radiology. 251 (2), 388-397 (2009).
- Tonan, T., et al. Evaluation of small (≤2cm) dysplastic nodules and well-differentiated hepatocellular carcinomas with ferucarbotran-enhanced MRI in a 1.0-T MRI unit: Utility of T2*-weighted gradient echo sequences with an intermediate-echo time. European Journal of Radiology. 64 (1), 133-139 (2007).
- Rief, M., et al. Detection of focal liver lesions in unenhanced and ferucarbotran-enhanced magnetic resonance imaging: a comparison of T2-weighted breath-hold and respiratory-triggered sequences. Magnetic Resonance Imaging. 27 (9), 1223-1229 (2009).
Reprints and Permissions
Request permission to reuse the text or figures of this JoVE article
Request PermissionThis article has been published
Video Coming Soon
Copyright © 2025 MyJoVE Corporation. All rights reserved