A subscription to JoVE is required to view this content. Sign in or start your free trial.
Methods Article
Hydrogen Production and Utilization in a Membrane Reactor
* These authors contributed equally
In This Article
Summary
Membrane reactors enable hydrogenation in ambient conditions without direct H2 input. We can track the hydrogen production and utilization in these systems using atmospheric mass spectrometry (atm-MS) and gas chromatography mass spectrometry (GC-MS).
Abstract
Industrial hydrogenation consumes ~11 Mt of fossil-derived H2 gas yearly. Our group invented a membrane reactor to bypass the need to use H2 gas for hydrogenation chemistry. The membrane reactor sources hydrogen from water and drives reactions using renewable electricity. In this reactor, a thin piece of Pd separates an electrochemical hydrogen production compartment from a chemical hydrogenation compartment. The Pd in the membrane reactor acts as (i) a hydrogen-selective membrane, (ii) a cathode, and (iii) a catalyst for hydrogenation. Herein, we report the use of atmospheric mass spectrometry (atm-MS) and gas chromatography mass spectrometry (GC-MS) to demonstrate that an applied electrochemical bias across a Pd membrane enables efficient hydrogenation without direct H2 input in a membrane reactor. With atm-MS, we measured a hydrogen permeation of 73%, which enabled the hydrogenation of propiophenone to propylbenzene with 100% selectivity, as measured by GC-MS. In contrast to conventional electrochemical hydrogenation, which is limited to low concentrations of starting material dissolved in a protic electrolyte, the physical separation of hydrogen production from utilization in the membrane reactor enables hydrogenation in any solvent or at any concentration. The use of high concentrations and a wide range of solvents is particularly important for reactor scalability and future commercialization.
Introduction
Thermochemical hydrogenation reactions are used in ~20% of all chemical synthesis1. These reactions require large quantities of H2 gas, which are usually derived from fossil fuels, temperatures between 150 °C and 600 °C, and pressures up to 200 atm2. Electrochemical hydrogenation is an appealing way to bypass these requirements and to drive hydrogenation reactions using water and renewable electricity3. For conventional electrochemical hydrogenation, an unsaturated feedstock is dissolved in a protic electrolyte in an electrochemical cell. When a potential is applied to the cell, water oxidation occurs at the anode, while hydrogenation occurs at the cathode. In this reaction setup, both electrochemical water oxidation and chemical hydrogenation occur in the same reaction environment. The organic substrate is dissolved in a protic electrolyte to enable both electrochemical water splitting and hydrogenation of the feedstock. The proximity of these reactions can lead to byproduct formation and electrode fouling when the reactant is susceptible to nucleophilic attack or if the reactant concentration is too high (>0.25 M)4.
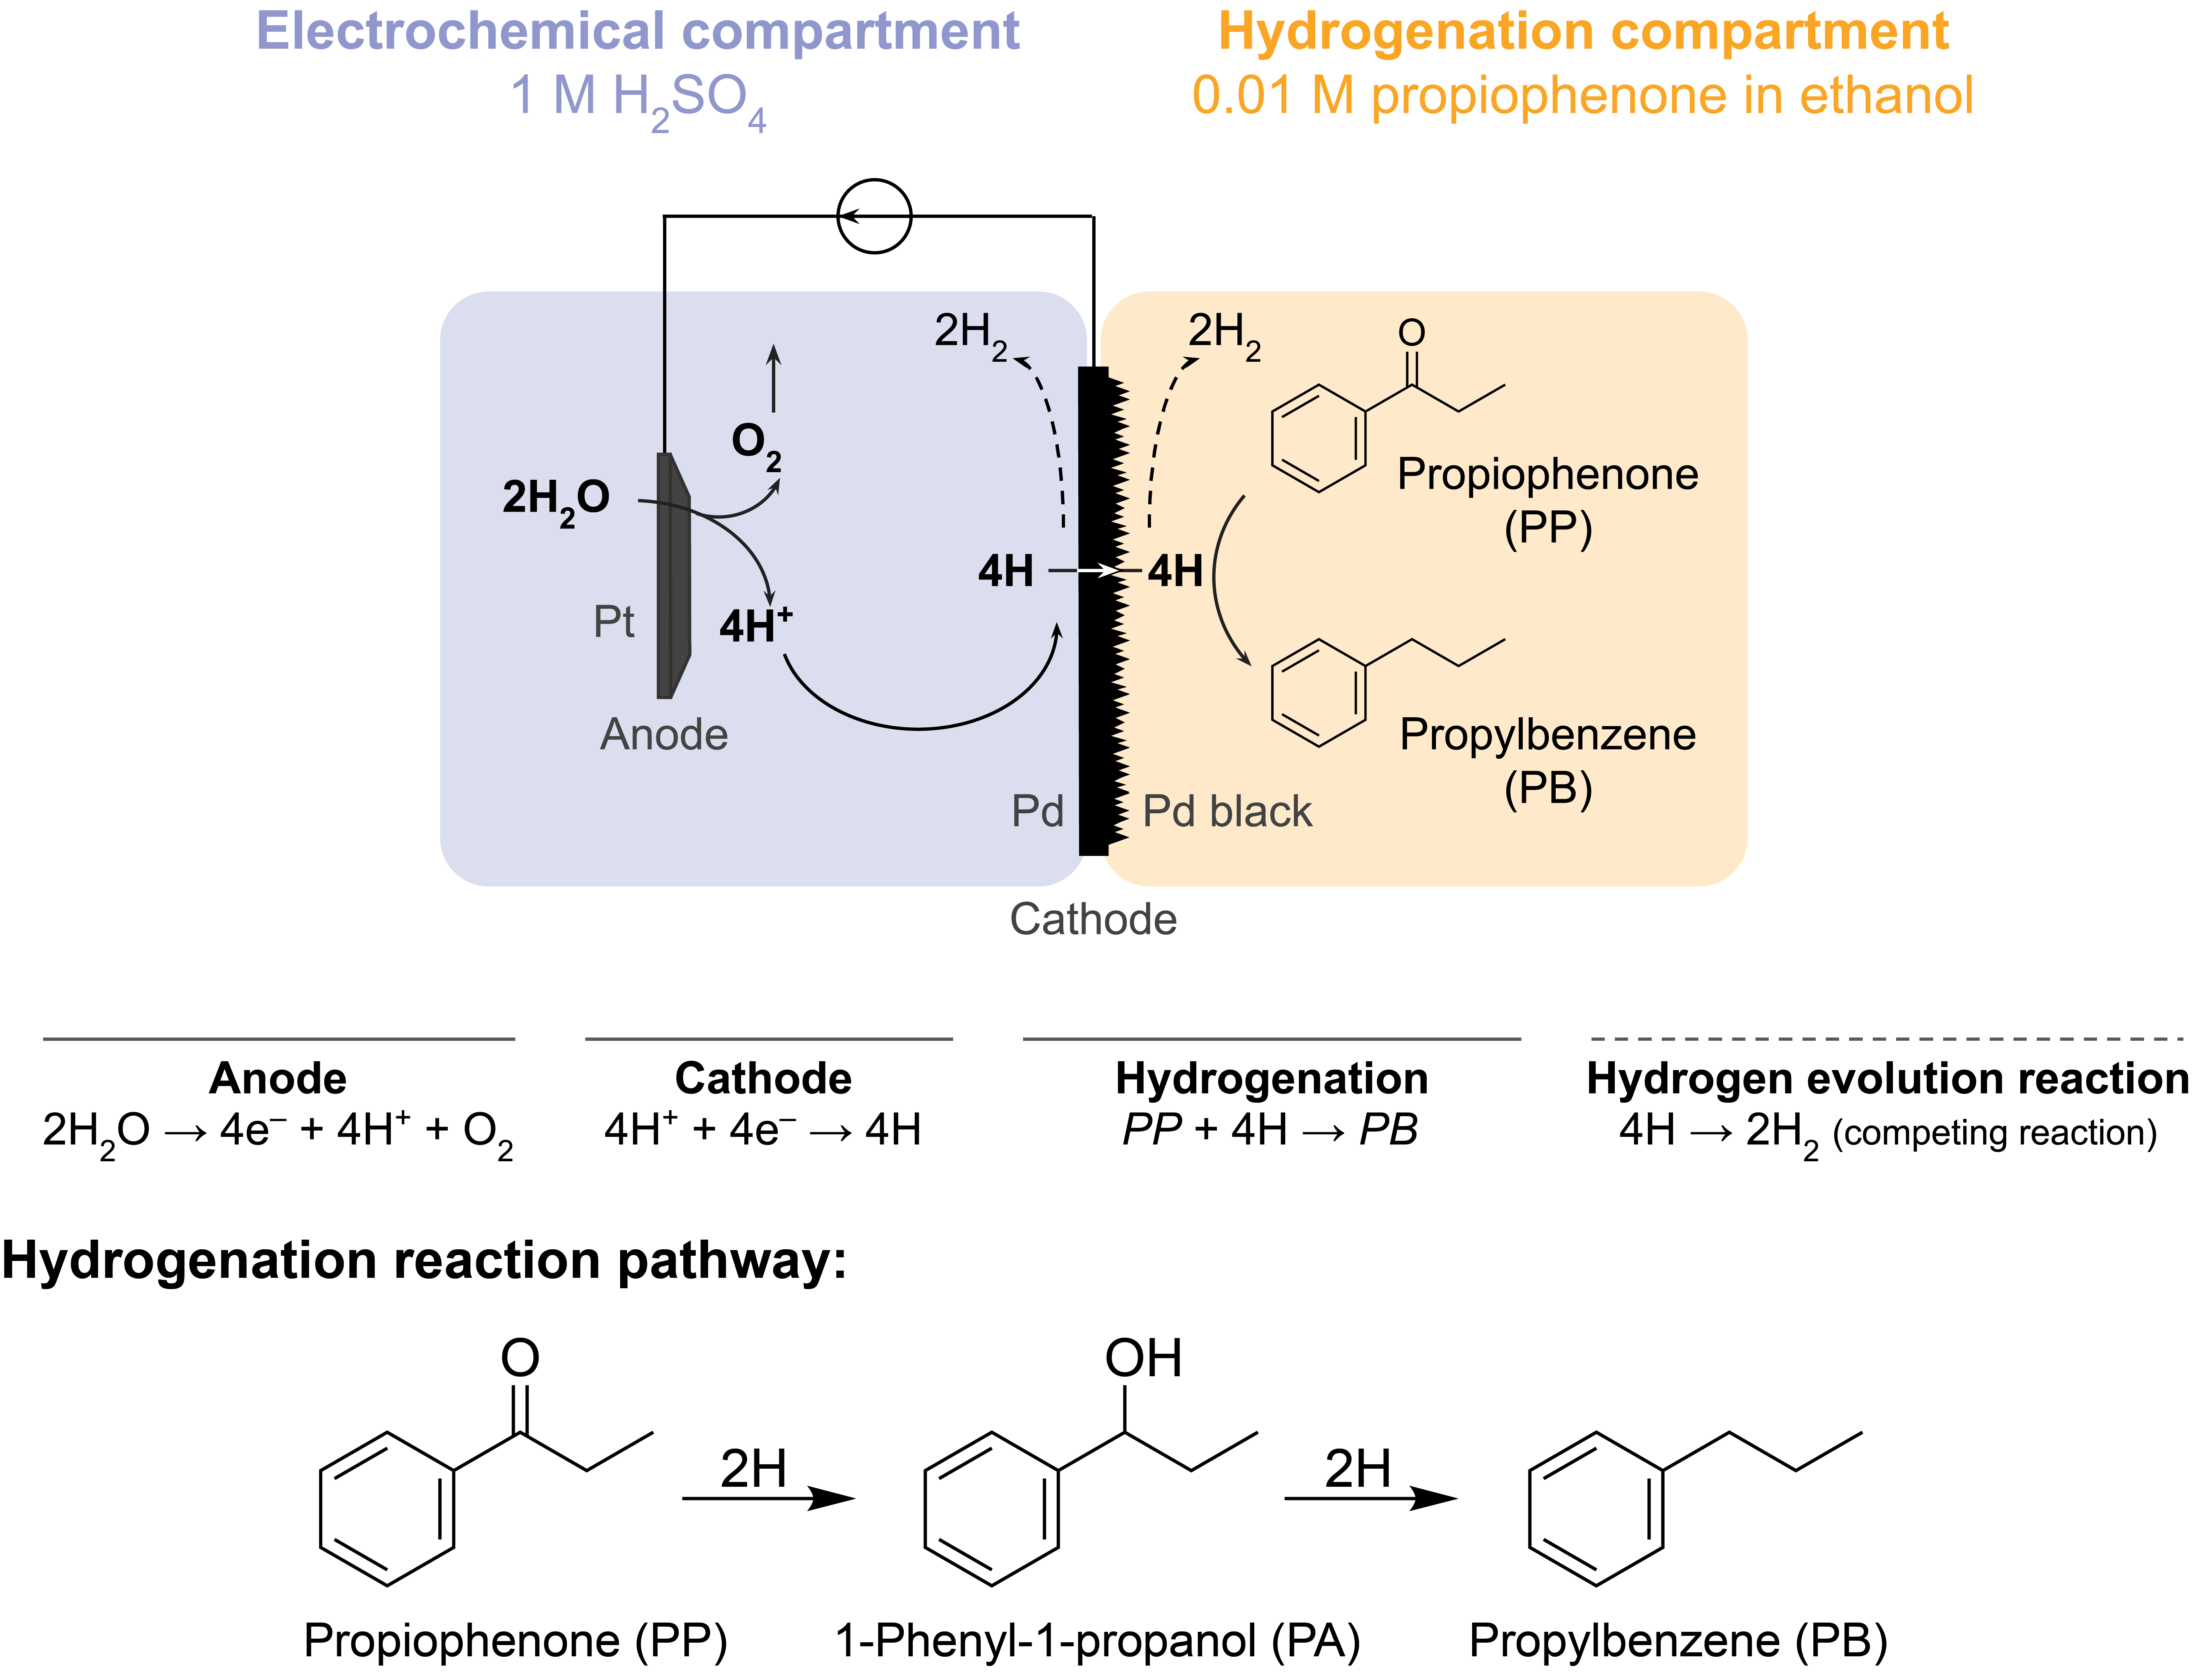
These challenges prompted our group to explore alternative ways to electrochemically drive hydrogenation reactions5,6,7. This search resulted in the use of a Pd membrane, which is conventionally used in hydrogen gas separation8. We use it as an electrode for water electrolysis on the electrochemical reactor side. This novel application of a palladium membrane enables the physical separation of the site of electrochemical water oxidation from the site of chemical hydrogenation. The resulting reactor configuration has two compartments: 1) an electrochemical compartment for hydrogen production; and 2) a chemical compartment for hydrogenation (Figure 1). Protons are generated in the electrochemical compartment by applying a potential across the Pt anode and the Pd membrane, which also serves as the cathode. These protons then migrate to the Pd membrane, where they are reduced to surface-adsorbed hydrogen atoms. The electrochemical compartment can be subdivided to include an optional cation exchange membrane to facilitate this proton migration. The surface-adsorbed hydrogen atoms permeate through the interstitial octahedral sites of the Pd fcc lattice9 and emerge on the opposite face of the membrane in the hydrogenation compartment, where they react with the unsaturated bonds of a given feedstock to form hydrogenated products7,10,11,12,13,14,15,16. The Pd in the membrane reactor, therefore, acts as (i) a hydrogen-selective membrane, (ii) a cathode, and (iii) a catalyst for hydrogenation.

Figure 1: Hydrogenation in a membrane reactor. Water oxidation at the anode produces protons, which are reduced on the palladium cathode. H permeates through the Pd membrane and reacts with propiophenone to form propylbenzene. Hydrogen evolution is a competing reaction that can occur on either side of the palladium membrane. For atmospheric mass-spectrometry, no chemical feedstock is used, necessitating H to leave the reactor in the form of H2 gas in either the electrochemical or hydrogenation compartments. Please click here to view a larger version of this figure.
The membrane reactor is assembled by sandwiching a Pd membrane between the anode and cathode compartments of an electrochemical H-cell12. Chemical-resistant O-rings are used to secure the membrane into place and ensure a leak-free seal. The electrochemical compartment of the membrane reactor contains a hydrogen-rich aqueous solution. In this study, we use 1 M H2SO4 and an anode that consists of a Pt wire enveloped in a 5 cm2 piece of platinum mesh. The anode is submerged in the electrolyte solution through a hole in the top of the electrochemical compartment. The chemical hydrogenation compartment contains a solvent and hydrogenation feedstock7,10,11,12,16,17. The hole at the top of the H-cell compartment is used for sampling. The experiments shown here use 0.01 M propiophenone in ethanol as the hydrogenation feed. However, the starting material (and concentration) can be varied to fit the experimental needs. For instance, a starting material that contains a long hydrocarbon chain and an alkyne functional group may be dissolved in pentane to improve solubility11. The applied current for the reaction can be between 5 mA/cm2 and 300 mA/cm2. All reactions are carried out under ambient temperature and pressure.
Atmospheric mass spectrometry (atm-MS) is used to measure the percent of hydrogen in the electrochemical compartment that permeates to the hydrogenation compartment11,12. This measurement is important to understand the energy inputs required for the membrane reactor, because it reveals the maximum possible hydrogen utilization (i.e., how much of the hydrogen being produced can actually be used for hydrogenation reactions). Hydrogen permeation through the Pd membrane is calculated by measuring the amount of H2 that evolves from both the electrochemical and hydrogenation compartments11,12. A permeation value of 100% means that all the hydrogen produced in the electrochemical compartment is transported through the Pd membrane to the hydrogenation compartment and then subsequently combines to form hydrogen gas. A permeation value of <100% means that hydrogen evolution occurs in the electrochemical compartment prior to permeating through the membrane. As H2 is produced from either the electrochemical or hydrogenation compartment, it enters the instrument and is ionized to H2+. The quadrupole selects fragments of m/z = +2, and the corresponding charge is measured by the detector. The plot obtained by this technique is the ionic charge over time. The ionic charge is measured for the hydrogenation compartment first, and when the signal stabilizes, the channels are changed to measure the electrochemical compartment. Hydrogen permeation is calculated by dividing the average ionic charge in the hydrogenation compartment by the total ionic charge measured in the reactor (Equation 1)11,12. To calculate hydrogen permeation, H2 from the hydrogenation and electrochemical compartments are measured separately using atm-MS.
 (Eq. 1)
Gas chromatography mass spectrometry (GC-MS) is used to monitor the progress of the hydrogenation reaction12,14,15,16. To collect data for the example, the hydrogenation compartment of the reactor is filled with 0.01 M propiophenone in ethanol. By applying a potential across the Pt anode and the Pd cathode, reactive hydrogen is supplied to the hydrogenation compartment. The reactive hydrogen atoms then hydrogenate the unsaturated feedstock, and the products are quantified using GC-MS, where the sample is fragmented and ionized. By analyzing the mass of these fragments, the composition of the hydrogenation solution can be determined, and reaction rates can be calculated12,14,15,16.
Protocol
1. Pd rolling
- Clean the Pd wafer bar with a mixture of hexanes using a cotton cloth.
CAUTION: Hexane is flammable, a health hazard, an irritant, and environmentally damaging. Work under proper ventilation (i.e., a snorkel or a fume hood). - Roll the Pd wafer using a manual roller until reaching a thickness of ≤150 µm, as determined by a digital micrometer.
- Roll the Pd using an automatic roller to a thickness of 25 µm, as determined by a digital micrometer. Then, cut the resulting Pd into the desired dimensions (e.g., 3.5 cm x 3.5 cm).
2. Pd annealing
- Load the rolled Pd foils into a muffle oven with an N2 atmosphere.
- Heat the Pd foils starting at 25 °C, and ramp the temperature to 850 °C at a rate of 60 °C/h. Hold the temperature at 850 °C for 1.5 h, and then cool the oven to room temperature at a rate of 60 °C/h.
3. Pd cleaning
- Prepare a cleaning solution by combining 10 mL of nitric acid, 20 mL of 30% (v/v) hydrogen peroxide, and 10 mL of deionized water.
CAUTION: Nitric acid is corrosive, an oxidant, and toxic. Hydrogen peroxide is corrosive, an oxidant, and harmful. - Submerge the annealed Pd foils in the cleaning solution until the vigorous bubbling subsides or the solution turns yellow (20-30 min).
- Rinse the Pd foils twice with DI water and once with isopropyl alcohol, and then dry with air.
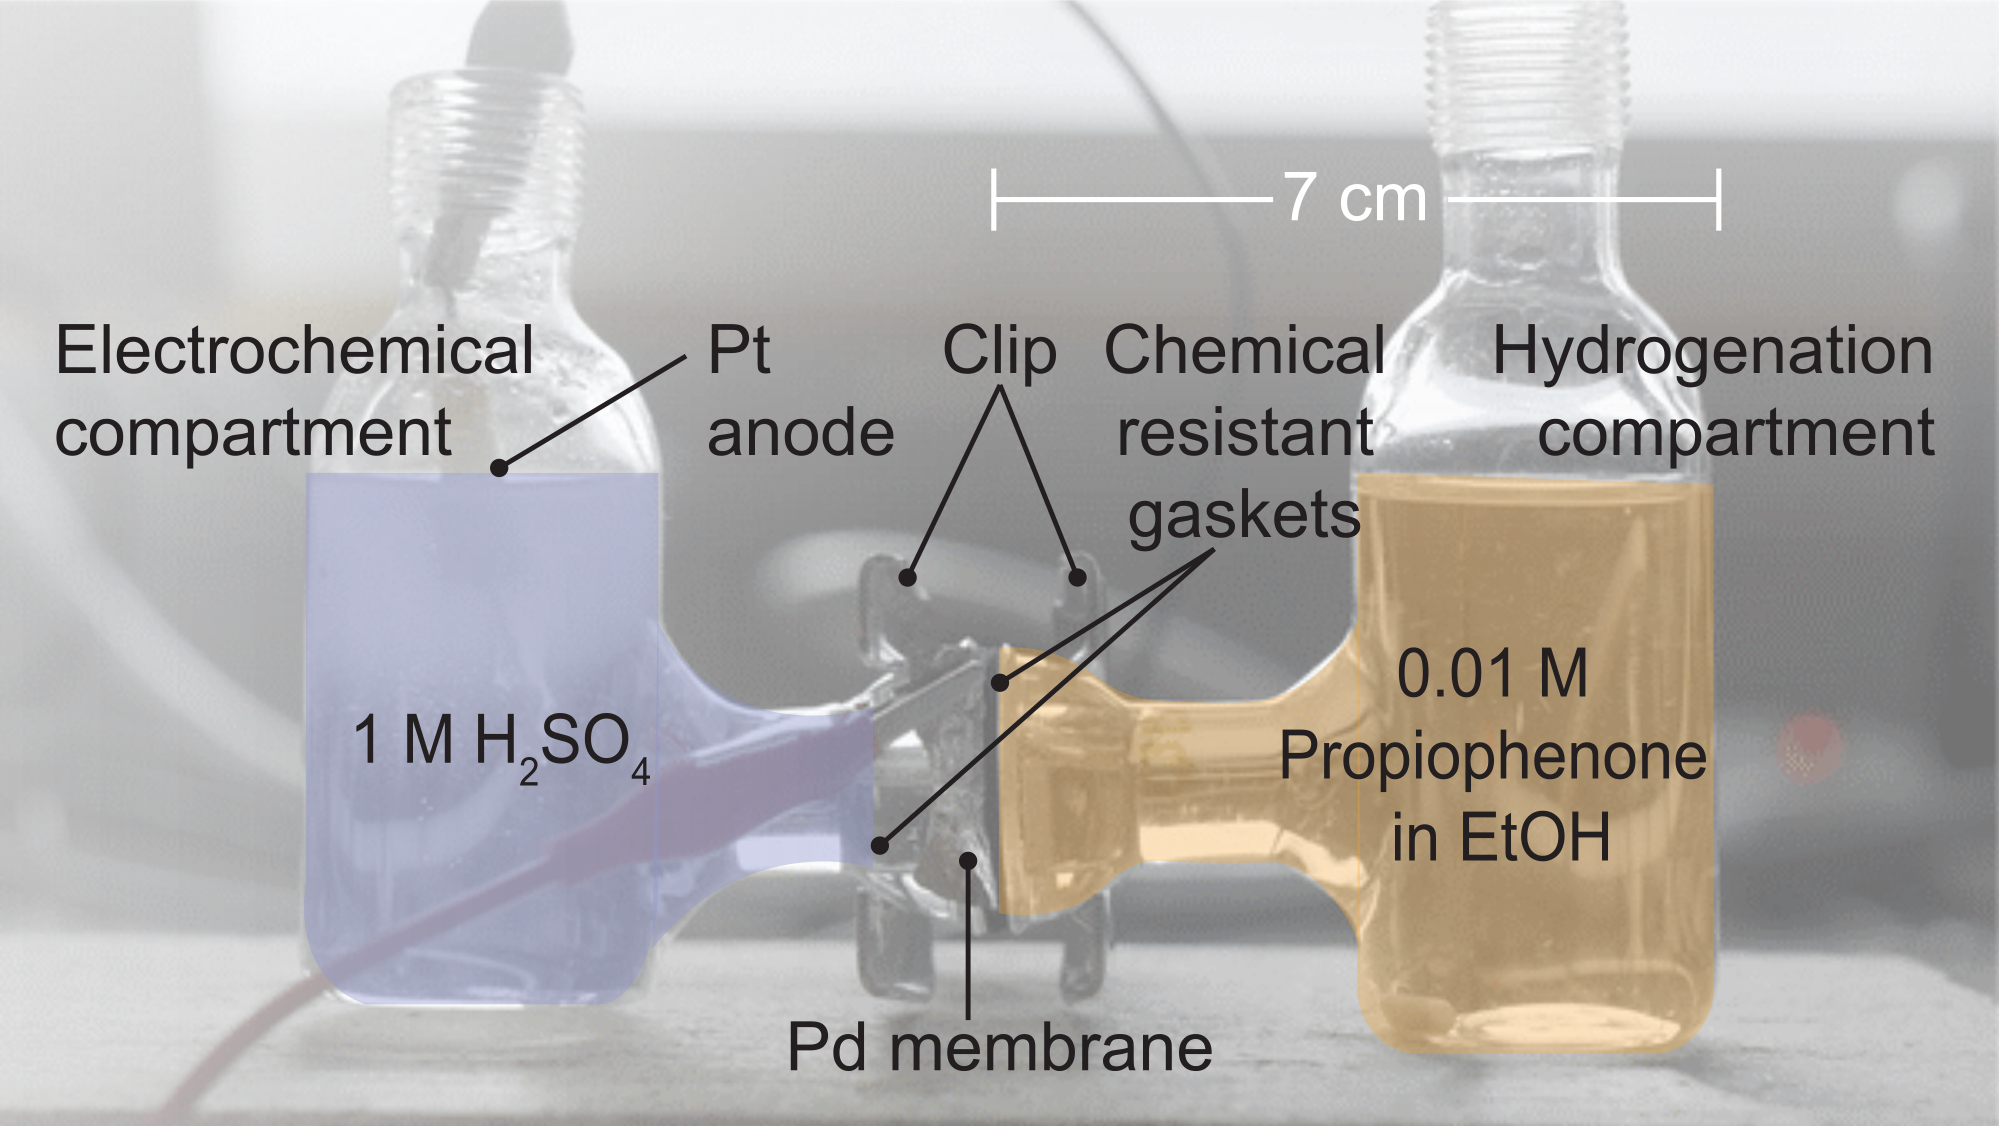
4. Reactor assembly (Figure 2, left to right)
- Assemble the reactor by sandwiching the Pd membrane between two halves of an electrochemical H-cell.
- Place a chemical-resistant gasket between the left-hand side of the cell and the Pd membrane.
- Place an additional chemical-resistant gasket between the Pd membrane and the right- hand side of the electrochemical cell.
- Seal the resulting cell configuration with a clip.

Figure 2: An image of the H-cell assembly. The electrochemical compartment contains 1 M H2SO4 electrolyte; this is where water oxidation occurs. The palladium membrane separates the two halves of the H-cell, and the gaskets provide a leak-free seal. The hydrogenation compartment contains 0.01 M propiophenone in ethanol (EtOH). Please click here to view a larger version of this figure.
5. Pd electrodeposition
- Prepare an electroplating solution by dissolving PdCl2 into 1 M HCl to reach a concentration of 15.9 mM.
CAUTION: PdCl2 is harmful and corrosive. HCl is corrosive and an irritant. - Assemble the reactor using a clean Pd foil from step 3.
- Fill the electrochemical compartment of the reactor with 24 mL of the prepared electroplating solution, and leave the hydrogenation compartment empty.
- Place a Pt mesh anode and an Ag/AgCl reference electrode into the solution in the electrochemical compartment.
- Connect the electrodes to a potentiostat, and apply a potential of -0.2 V versus Ag/AgCl to the Pd foil until a charge of 15 C has passed.
- Disassemble the reactor, rinse the resulting Pd membrane twice with deionized water and once with isopropyl alcohol, and then dry the membrane under a stream of air or N2. The Pd membrane will now have a visible deposition of Pd black on the surface that was exposed to the electroplating solution.
6. Atm-MS reactor setup
- Assemble the reactor as indicated in step 4. Fill the electrochemical compartment with 1 M H2SO4, and fill the hydrogenation compartment with ethanol. Do not add hydrogenation feedstock.
CAUTION: H2SO4 is harmful and corrosive. Ethanol is flammable, harmful, and a health hazard. - Submerge a Pt counter electrode in the electrolyte. Connect the Pt counter electrode and the Pd membrane to a power supply using alligator clips. Connect the Pt counter electrode as the positive electrode and the Pd membrane as the negative electrode.
- Apply a constant current of 25 mA.
7. Atm-MS instrument setup
- Turn on the power switch on the back of the atm-MS unit, just below the power cord.
- Press the pump button on the front to turn on the pump (it will light up blue when on). Then, turn on the bake jacket (green round switch, the light will come on).
- Turn on the capillary channel to be used (red round switches next to the channels, the light will come on). Check that the channel used is turned on by feeling the tube being heated.
NOTE: The green LED next to "vac ok" will come on within a few minutes of turning the pump on. To turn off the system after finishing the experiments, turn off all the switches that have been turned on. - Connect the hydrogenation cell outlet to the atm-MS capillaries. This connection must be airtight.
8. Atm-MS software setup
- Click on the Service desktop shortcut. Go to Setup | SEM/Emission Control, and check the boxes for both SEM and emissions. Press OK. Close the service window.
- Click on the Measure shortcut, and go to Sequence | Execute.
- Fill in the following parameters: Measurements = 30, Purge time = 30 s. Press File Manager, and create a folder to save the output data in. These settings will take 30 measurements with a purge time of 30 s between each measurement set; this can be changed if needed.
- The MID measurements file will then open. Select File Management, and open a program to measure the mass spectrometry signal for m/z = 2. This signal corresponds to the ionic current from H2+, the ionized form of hydrogen gas.
- Press OK to start the program. Do not close the measurement window as this will stop the instrument running.
- After the signal has stabilized (1-3 h), disconnect the atm-MS capillary from the hydrogenation compartment, and connect it to the electrochemical compartment.
- Save the data, and terminate the experiment when the signal for the electrochemical compartment has stabilized (about 30 min).
- Calculate the percentage of hydrogen permeation through the Pd membrane using Equation 1.
9. Electrochemical hydrogenation
- Assemble the reactor according to step 4.
- Fill the electrochemical compartment with 24 mL of 1 M H2SO4.
- Insert a Pt counter electrode into the electrochemical compartment through the counter electrode opening. Connect the Pt counter electrode to the positive terminal of a power supply, and connect the Pd membrane to the negative terminal via Cu tape.
- Apply a galvanostatic current of 25 mA (corresponds to 40 mA/cm2) across the cell for 15 min. The voltage will read between 3 V and 5 V.
- After 15 min has passed, fill the chemical compartment with 24 mL of reaction solution (e.g., 0.01 M propiophenone in ethanol). Maintain the galvanostatic current during reactant addition.
NOTE: Sample the initial reaction solution before it is added to the reactor. See step 9.6.
CAUTION: Propiophenone is harmful. - Sample the chemical compartment periodically (e.g., every 15 min) by taking 30 µL of reaction solution from the chemical compartment using a micropipette and dissolving the sample in 1 mL of dichloromethane. Store the samples in GC-MS vials until the reaction is complete.
CAUTION: Dichloromethane is harmful and a health hazard.
10. Gas chromatography-mass spectrometry
- Load the sample vials into the autosampling tray.
- Launch the GC-MS software by clicking on the green Masshunter icon.
- Click on Sequence | Edit Sequence to open the sequence editing window. Fill in the desired sample names, vial (position in the autosampling tray), method path, method file, data path, and data file into the chart. Set the sample type to "sample" and the dilution to 1, and ensure that the data file matches the sample name.
- Adjust the method by clicking on Method | Edit Entire Method.
- Ensure both Method information and Instrument acquisition are checked. Click on OK. Add Method comments (if desired).
- Ensure Data Acquisition and Data analysis are checked. Leave every other field blank. Click on OK.
- Ensure that the sample inlet is set to GC and the injection source is set to GC ALS. Check the Use MS box. Ensure that the inlet location is set to Front and the MS is connected to Front. Click on OK.
- Under the Inlet tab, ensure the heater temperature is set to 250 °C. Set the pressure to 7.2 psi and the He flow to 23.1 mL/min.
- Under the Oven tab, set the initial temperature to 50 °C, and hold for 1 min. Next, set the ramp rate to 25 °C/min and the temperature to 200 °C, and hold for 0 min. Click on OK.
- Ensure none of the display signals are checked. Click on OK.
- Set the solvent delay to 2.50 min. Click on OK.
- Ensure that the selected monitors include the following: GC oven temperature, GC inlet F temperature, GC inlet F pressure, GC column 2 flow calc, MS EM volts, MS MS source, MS MS quad. Click on OK.
- Save the method under the desired method name.
- Start the sequence by clicking on Sequence | Start Sequence | Run Sequence.
- When the sequence is complete, view the data by opening the Masshunter software and clicking on the file name that was programmed in step 10.3.
- Identify the product peaks by clicking on Spectrum | Library search report to compare the acquired mass spectra to the NIST database.
- Calculate the relative composition of starting materials and products by using Equation 2.
 (Eq. 2)
where A is the chemical component of interest, and n is the number of components measured by GC-MS. An example is as follows:

Results
Atm-MS is used to measure the ionic current of the hydrogen that is produced in the membrane reactor. We can use these measurements to quantify how much hydrogen permeates through the Pd membrane during electrolysis. First, the hydrogen evolving from the hydrogenation compartment is measured (Figure 3, left of the dotted lines). When the signal reaches a steady state, the channel is switched to the electrochemical compartment. The H2 gas evolving from the electrochemical compartme...
Discussion
The Pd membrane enables hydrogen permeation and chemical hydrogenation. The preparation of this membrane is, therefore, important to the efficacy of the membrane reactor. The Pd membrane size, crystallography, and surface are tuned to improve the experimental results. Although Pd metal can evolve hydrogen at any thickness, the Pd membranes are rolled to 25 µm. This standardization of membrane thickness ensures that the time it takes for hydrogen to permeate through the membrane is constant for all the experiments. M...
Disclosures
Patent applications based on the technology described in this work have been filed and published: Berlinguette, C. P.; Sherbo, R. S. "Methods and Apparatus for Performing Chemical and Electrochemical Reactions" US Patent Application No. 16964944 (PCT filed January 2019, national entry July 2020), Publication No. US20210040017A1 (published February 2021). Canadian Patent Application No. 3089508 (PCT filed January 2019, national entry July 2020), Publication No. CA3089508 (published August 2019). Priority data: US Provisional Patent Application No. 62/622,305 (filed January 2018).
Acknowledgements
We are grateful to the Canadian Natural Sciences and Engineering Research Council (RGPIN-2018-06748), the Canadian Foundation for Innovation (229288), the Canadian Institute for Advanced Research (BSE-BERL-162173), and Canada Research Chairs for financial support. This research was undertaken thanks in part to funding from the Canada First Research Excellence Fund, Quantum Materials and Future Technologies Program. We thank Ben Herring at the UBC Shared Instrument Facility for assistance with the GC-MS instrument and method development. We thank Dr. Monika Stolar for contributions to the development and editing of this manuscript. Finally, we thank the entire Berlinguette Group at the University of British Columbia for their continued support and collaboration in studying the membrane reactor.
Materials
| Name | Company | Catalog Number | Comments |
| Ag/AgCl Reference Electrode | BASi research products | MW-2021 | Reference electrode |
| Analytical Balance | Cole-Parmer | RK-11219-03 | Instrument |
| Atmospheric Mass Spectrometer | ESS CatalySys | NA | Instrument |
| Bench Power Supply | Newark | 1550 | Instrument |
| Conductive Copper Foil Electrical Tape | McMaster Carr | 76555A711 | Electrochemical cell assembly |
| Dichloromethane | Sigma Aldrich | 270997 | Reagent |
| Electric Rolling Press with Dual Micrometer | MTI Corporation | MR100A | Equipment |
| Electrochemical glass H-cell | University of British Columbia glass blowing | NA | Electrochemical cell assembly |
| ESS catalysis QUADSTAR | ESS CatalySys | NA | Software |
| Ethanol | Sigma Aldrich | 493511 | Reagent |
| Flat Rolling Mill | Pepetolls | 18700A | Equipment |
| Gas Chromatography Mass Spectrometer | Agilent | NA | Instrument |
| GC-MS vial | Agilent | 5067-0205 | Vial for GC-MS |
| Hexanes | Sigma Aldrich | 1.0706 | Reagent |
| Hydrochloric Acid | Sigma Aldrich | 258148 | Reagent |
| Hydrogen peroxide solution (30% v/v) | Sigma Aldrich | H1009 | Reagent |
| Isopropyl Alcohol | Sigma Aldrich | W292907 | Reagent |
| Masshunter Aquisition Software | Agilent | G1617FA | Software |
| Micropipette (100 µL - 1000 µL) | Gilson | F123602 | instrument |
| Micropipette (20 µL - 200 µL) | Gilson | F123601 | Instrument |
| Mitutoyo Digital Micrometer | Uline | H-2780 | Instrument |
| Muffle Furnace | MTI Corporation | KSL-1100X | Equipment |
| Nitric acid | Sigma Aldrich | 438073 | Reagent |
| Nitrogen gas | Sigma Aldrich | 608661 | Reagent |
| Palladium (II) Chloride | Sigma Aldrich | 520659 | Reagent |
| Pd wafer bar, 1 oz, 99.95% | Silver Gold Bull. | NA | Reagent |
| Platinum Auxiliary Electrode | BASi research products | MW-1032 | Anode |
| Potentiostat | Metrohm | PGSTAT302N | Instrument |
| Propiophenone | Sigma Aldrich | P51605 | Reagent |
| Proton Exchange Membrane, Nafion 212 | Fuel cell store | NA | Electrochemical cell assembly |
| Sulfuric acid | Sigma Aldrich | 258105 | Reagent |
References
- Rytter, E., Hillestad, M., Austbø, B., Lamb, J. J., Sarker, S., Lamb, J. J., Pollet, B. G. Chapter six - Thermochemical production of fuels. Hydrogen, Biomass and Bioenergy. , 89-117 (2020).
- Arpe, H. -. J. . Industrial Organic Chemistry. , (2017).
- Orella, M. J., Román-Leshkov, Y., Brushett, F. R. Emerging opportunities for electrochemical processing to enable sustainable chemical manufacturing. Current Opinion in Chemical Engineering. 20, 159-167 (2018).
- May, A. S., Biddinger, E. J. Strategies to control electrochemical hydrogenation and hydrogenolysis of furfural and minimize undesired side reactions. ACS Catalysis. 10 (5), 3212-3221 (2020).
- Tang, B. Y., Bisbey, R. P., Lodaya, K. M., Toh, W. L., Surendranath, Y. Reaction environment impacts charge transfer but not chemical reaction steps in hydrogen evolution catalysis. ChemRxiv. , (2022).
- Iwakura, C., Yoshida, Y., Inoue, H. A new hydrogenation system of 4-methylstyrene using a palladinized palladium sheet electrode. Journal of Electroanalytical Chemistry. 431 (1), 43-45 (1997).
- Inoue, H., Abe, T., Iwakura, C. Successive hydrogenation of styrene at a palladium sheet electrode combined with electrochemical supply of hydrogen. Chemical Communications. , 55-56 (1996).
- Conde, J. J., Maroño, M., Sánchez-Hervás, J. M. Pd-based membranes for hydrogen separation: Review of alloying elements and their influence on membrane properties. Separation and Purification Reviews. 46 (2), 152-177 (2017).
- Wicke, E., Brodowsky, H., Züchner, H., Alefeld, G., VÖlkl, J. Hydrogen in palladium and palladium alloys. Hydrogen in Metals II. Topics in Applied Physics., edited by Alefeld, G., Völkl, J. 29, (1978).
- Sato, T., Sato, S., Itoh, N. Using a hydrogen-permeable palladium membrane electrode to produce hydrogen from water and hydrogenate toluene. International Journal Hydrogen Energy. 41 (12), 5419-5427 (2016).
- Sherbo, R. S., Delima, R. S., Chiykowski, V. A., MacLeod, B. P., Berlinguette, C. P. Complete electron economy by pairing electrolysis with hydrogenation. Nature Catalysis. 1, 501-507 (2018).
- Sherbo, R. S., Kurimoto, A., Brown, C. M., Berlinguette, C. P. Efficient electrocatalytic hydrogenation with a palladium membrane reactor. Journal of American Chemical Society. 141 (19), 7815-7821 (2019).
- Kurimoto, A., Sherbo, R. S., Cao, Y., Loo, N. W. X., Berlinguette, C. P. Electrolytic deuteration of unsaturated bonds without using D2. Nature Catalysis. 3, 719-726 (2020).
- Jansonius, R. P., et al. Hydrogenation without H2 using a palladium membrane flow cell. Cell Reports Physical Science. 1 (7), 100105 (2020).
- Huang, A., et al. Electrolysis can be used to resolve hydrogenation pathways at palladium surfaces in a membrane reactor. Journal of American Chemical Society Au. 1 (3), 336-343 (2021).
- Delima, R. S., et al. Selective hydrogenation of furfural using a membrane reactor. Energy and Environmental Science. 15 (1), 215-224 (2021).
- Sato, T., Takada, A., Itoh, N. Low-temperature hydrogenation of toluene by electrolysis of water with hydrogen permeable palladium membrane electrode. Chemistry Letters. 46 (4), 477-480 (2017).
- Maoka, T., Enyo, M. Overpotential decay transients and the reaction mechanism on the Pd-H2 electrode. Surface Technology. 8 (5), 441-450 (1979).
- Kurimoto, A., et al. Physical separation of H2 activation from hydrogenation chemistry reveals the specific role of secondary metal catalysts. Angewandte Chemie International Edition. 60 (21), 11937-11942 (2021).
Reprints and Permissions
Request permission to reuse the text or figures of this JoVE article
Request PermissionThis article has been published
Video Coming Soon
Copyright © 2025 MyJoVE Corporation. All rights reserved