Method Article
Using Vertically Aligned Carbon Nanofiber Arrays on Rigid or Flexible Substrates for Delivery of Biomolecules and Dyes to Plants
In This Article
Summary
Here we describe methods for microfabricating vertically aligned carbon nanofibers (VACNFs), transferring VACNFs to flexible substrates, and applying VACNFs on both rigid and flexible substrates to plants for biomolecule and dye delivery.
Abstract
The delivery of biomolecules and impermeable dyes to intact plants is a major challenge. Nanomaterials are up-and-coming tools for the delivery of DNA to plants. As exciting as these new tools are, they have yet to be widely applied. Nanomaterials fabricated on rigid substrate (backing) are particularly difficult to successfully apply to curved plant structures. This study describes the process for microfabricating vertically aligned carbon nanofiber arrays and transferring them from a rigid to a flexible substrate. We detail and demonstrate how these fibers (on either rigid or flexible substrates) can be used for transient transformation or dye (e.g., fluorescein) delivery to plants. We show how VACNFs can be transferred from rigid silicon substrate to a flexible SU-8 epoxy substrate to form flexible VACNF arrays. To overcome the hydrophobic nature of SU-8, fibers in the flexible film were coated with a thin silicon oxide layer (2-3 nm). To use these fibers for delivery to curved plant organs, we deposit a 1 µL droplet of dye or DNA solution on the fiber side of VACNF films, wait 10 min, place the films on the plant organ and employ a swab with a rolling motion to drive fibers into plant cells. With this method, we have achieved dye and DNA delivery in plant organs with curved surfaces.
Introduction
Plant transformation (both transient and stable) has yet to become widely achievable in all plant tissues and species. The transient transformation of plants is a process by which genes encoded in plasmids are temporarily introduced into plants but are not stably incorporated into the genome. Traditional methods that use particle bombardment, Agrobacteria, electroporation, or polyethylene glycol treatment of protoplasts are slow or can be cumbersome. Furthermore, they are not applicable to every plant species1,2,3,4. The use of nanomaterials for DNA delivery is a burgeoning field that is still in its infancy5. Nanomaterials, specifically carbon nanofibers have also successfully been used to deliver proteins, dextrans and dyes to plant leaves without causing wound response6. The goal of this work is to provide a detailed protocol for using one type of nanomaterial, carbon nanofibers, for delivering biomolecules or dyes to plants. Here, we focus on DNA as the biomolecule of choice, which permits the transient transformation of cells in various plant organs.
Previously, Morgan et al.7 demonstrated the use of carbon nanofibers affixed to rigid silicon substrate to transiently transform leaves of lettuce, N. benthamiana, and poplar, and both leaves and roots of Arabidopsis. Although transformations were successful on a variety of organs, fibers were more difficult to apply to plant tissues with curved surfaces, such as roots or fruits. We reasoned that a flexible backing for nanofibers might improve their efficiency of delivery by conforming better to the shape of the organ.
Herein, we detail methods utilized for fabricating and designing vertically aligned carbon nanofibers, transferring VACNFs to flexible substrates, and applying VACNFs on both rigid and flexible substrates to plants to deliver biomolecules and dyes. Carbon nanofibers were produced using direct current catalytic plasma-enhanced chemical vapor deposition (dc C-PECVD) with Ni catalyst. The position, diameter, and height of Ni catalyst dots were controlled using a combination of electron beam lithography, metal evaporation, and lift-off processes as described by Melechko et al.8,9. Using a double-layer e-beam resist, a thicker Ni catalyst can be deposited on the substrate to give longer fibers10. Fiber transfer from a rigid to a flexible substrate is based on a modification of methods described in Fletcher et al.11, with the current methods foregoing the use of an amorphous carbon layer or a sacrificial photoresist layer. SU-8 lift-off with fiber transfer is achieved by utilizing the intrinsic tensile stress resulting from underbaking and underexposing the SU-812,13,14. SU-8, a complex polymer, is naturally hydrophobic, which makes its use for facilitating DNA delivery difficult. To counteract the hydrophobic nature of SU-8, we apply a thin layer of silicon oxide via atomic layer deposition15 after fibers are embedded in SU-8. Application of fibers on a rigid substrate for biomolecule/dye delivery utilizes the impact force of tweezer tapping described in Davern et al.6 and the on-plant and on-chip methods described in Morgan et al.7. Flexible VACNF films are applied to curved plant surfaces by first semidrying DNA or dye droplets on the film as with the on-chip method from Morgan et al.7and then rolling the films on curved plant surfaces using a small makeup applicator16,17. Figure 1 depicts various approaches for applying fibers in rigid and flexible substrates to plants.
Protocol
1. VACNFs production (Figure 2 and Figure 3)
- Spincoat a silicon wafer with polymethyl methacrylate (PMMA) 495 A4 resist at 4000 rpm and bake it at 180 °C for 5 min.
NOTE: Let the wafer cool for 10 s before proceeding to the next step. - Spincoat a second layer of resist (PMMA 950 A2) and bake it at 180 °C for 5 min.
- Use electron beam lithography to define the catalyst dots with diameters of 300 nm at a specified lateral spacing (pitch: 10 µm, or 35 µm) in 3 mm x 3 mm arrays.
- Develop the resist in 30-40 mL of 1:3 methyl-isobutyl ketone: isopropyl alcohol (IPA) for 1.5 min, followed by rinsing it with IPA and drying it with N2.
NOTE: Check for the array of dots using a brightfield microscope (20x objective). - Clean the wafer of the residual resist with a 6 s exposure in oxygen plasma (descum) in a silicon etcher.
- Use electron beam evaporation to deposit first an adhesive layer of metal (Ti or Cr, 10 nm) and then deposit a second layer, which is the Ni catalyst (130 nm or 150 nm). During Ti or Ni metal deposition, keep the current below 0.2 A at 10 kV, the pressure below 5 x 10⁻⁶ Torr, and the deposition rate at ~1 A/s for line-of-sight deposition.
- Use sequential bath sonication to remove the metal (Ni) deposited on the underlying resist layer, leaving the Ni deposited directly on the silicon wafer. This process is called lift-off.
- For this, prepare 3 containers with acetone and bath sonicate the wafer in acetone for 1 min; repeat 3 times at room temperature (RT, 20 °C) at a frequency of 35 kHz. Rinse with IPA and dry with N2.
NOTE: Never let acetone dry on the wafer. After the last acetone sonication, immediately rinse with IPA and then dry with N2 gas. If at any point the wafer becomes prematurely dry (prior to IPA rinse) there is the possibility that not all the excess metal and resist will be removed and the acetone can leave a residue.
- For this, prepare 3 containers with acetone and bath sonicate the wafer in acetone for 1 min; repeat 3 times at room temperature (RT, 20 °C) at a frequency of 35 kHz. Rinse with IPA and dry with N2.
- Check the geometry of catalyst shape using scanning electron microscopy (SEM). To capture SEM images of the VACNF chips, tilt the stage to a 30° angle and use a voltage of 1-3 kV, with a beam current of ~100 pA, and a ~5 mm working distance.
NOTE: The catalyst should look like a hockey puck (a compact cylinder) (Figure 4). The height of the compact cylinder should reflect the thickness of Ni deposited on the silicon wafer. If the profile of the Ni dot is tall and appears to be concave at the top, resembling a volcano (Figure 4), then the catalyst is more likely to dewet into multiple Ni droplets resulting in branching of the carbon nanofibers9(Figure 4 and Figure 5). Such problems can result from resist melting during metal evaporation because of long deposition times or issues with the lift-off procedure (Figure 4 and Figure 5). - Quarter the silicon wafer and place it in the direct current plasma enhanced chemical vapor deposition chamber (dc-PECVD) with the acetylene/ammonia mixture. Optimize the growth parameters to control the length and taper of nanofibers (tips <200 nm).
- Use a current of 1-1.5 A and a voltage range of 440-560 V. When growing the fibers, use a pre-treatment phase with ammonia flow while the machine and substrate heat up to 620 °C. Ensure to turn on the carbon source (acetylene) 10 s before starting the plasma.
NOTE: Quarter wafers are used in case the PECVD machine run parameters need to be optimized. To produce fibers with lengths greater than 40 µm and tips less than 200 nm in diameter, the following parameters are suggested: with a Ni catalyst thickness of 130 nm, use a current of 1.75 A, growth time of 70 min, and an acetylene : ammonia ratio of 45 standard cubic centimeter per minute (sccm) : 100 sccm. With a Ni thickness of 150 nm, use a current of 1.5 A, a growth time of 80 min, and an acetylene : ammonia ratio of 48 sccm : 100 sccm. Use the following parameters to grow VACNFs regardless of catalyst thickness: growth temperature of 620 °C, pressure of 10 torr during plasma, and a shower head height of 20 mm (Figure 6).
- Use a current of 1-1.5 A and a voltage range of 440-560 V. When growing the fibers, use a pre-treatment phase with ammonia flow while the machine and substrate heat up to 620 °C. Ensure to turn on the carbon source (acetylene) 10 s before starting the plasma.
- Assess the geometry of the resulting fibers using SEM at a 30° tilt with an acceleration potential of 1 kV.
NOTE: Optimal fibers will be straight and non-branching. It is impossible to control the crystal orientation of the Ni catalyst with the electron beam evaporator. As a result, there will be some fibers that branch because of catalyst dewetting9. Also, the crystal orientation causes the VACNFs to grow to different heights, so uniform heights on all VACNFs are difficult. - Spincoat a layer of photoresist (SPR955) onto the fibers at 1000 rpm for 45 s. Then dice the ¼ wafer into 3 mm x 3 mm arrays using a dicing saw. Store the fibers at this point for later use.
NOTE: Do not conduct step 1.11 if planning to transfer fibers to a flexible substrate.
2. Transferring VACNFs to a flexible substrate (Figure 7 and Figure 8)
- After the fibers are synthesized, spincoat SU-8 2015 photoresist onto the wafers or quarter wafers at 4000 rpm for 45 s.
- Softbake the wafer for 3 min at 95 °C.
- Using a contact aligner, expose the wafer with a 3 mm 3 mm array patterned mask that aligns with the defined pattern from electron beam lithography at 95 mJ/cm2.
NOTE: Use a proximity contact mode with an exposure gap that is at 20 µm greater than the tallest fiber. There is the possibility that fibers could be knocked over during this step in the process. - Perform a post-exposure bake for 6 min at 95 °C.
- Develop the wafer in SU-8 developer for 15 s, rinse it with IPA, and dry the wafer with N2, moving from top to bottom.
NOTE: When developing the wafer, ensure it is completely submerged. - Spincoat patterned wafers with a protective layer of thin photoresist (SPR 955 CM 0.7) at 3000 rpm for 45 s and softbake for 30 s at 90 °C.
- Deposit a thin silicon oxide layer to the wafer (2-3 nm) by placing it in an atomic layer deposition for 22 cycles at 100 °C.
- Use a dicing saw to cut the wafer into 3 mm x 3 mm squares. Align the dicing saw to the preexisting pattern on the wafer.
- Assess the geometry of the resulting fibers using SEM at a 30° tilt with an acceleration potential of 3 kV.
- Stop here if storing chips for long-term use (>1 week). Store chips in the dark.
- To separate flexible substrates from rigid substrates, place individual chips in acetone for 30 min or until the SU-8 starts to curl.
- Wash SU-8 films (either attached to or detached from rigid substrates) with IPA for 5 min and then with water for 5 min. Place the chips in a commercial box with a sticky pad when transporting them.
- OPTIONAL: Place the fiberless side of the SU-8 film on water-soluble tape or on top of thin silicone rubber with a thin polyethylene terephthalate (PET) (12.5 µm thick) backing.
- Use a pair of tweezers to transfer the SU-8 film. Press on the edges of the SU-8 square to help it stick to the tape/silicone rubber-PET; this is to avoid breaking off fibers. At this point, the VACNF films are ready for immediate use.
- To prepare a silicone rubber/PET holder, do the following: using a 2-part kit for silicone rubber, mix the two parts together (the elastomer and the crosslinker). Next, cut out a square of PET and tape it down in a clear plastic dish. Pour a very thin layer of silicone rubber on top of the PET and cure it at 80 °C for 1-2 h.
3. On-plant method (where a drop of solution to deliver is placed on a plant surface) using fibers in a rigid substrate (Figure 1A)
- Remove the photoresist with increment washes of acetone (100%, 5 min), IPA (100%, 5 min), and ddH2O (5 min) prior to use.
- Place the plant tissue to be impaled on a hard surface for support.
- Place a 1 µL droplet of dye or DNA (200 ng) onto the surface of the plant tissue.
- Place a VACNF chip with a rigid substrate on the top of the droplet, with the fibers oriented such that they will come into contact with the droplet.
NOTE: The orientation of the chips can be determined by the "shininess" of the wafer. The shiny side of the chip has fibers, and the opaque side does not. - Using the flat side of a pair of tweezers, tap the chip. Mark the area of the plant that the chip came into contact with using a soft-tipped marker. Remove the VACNF chips after delivery.
NOTE: The amount of force applied when tapping will vary depending on the type of plant tissue used. It is recommended to practice tapping chips prior to conducting the impalement of fibers. Avoid damage to plant tissues. Damage is apparent when one can see the outline of the VACNF chip in the plant tissue. - Repeat steps 3.1-3.5 for controls (+Dye/DNA, -Fibers; -Dye/DNA, +Fibers; and -Dye/DNA, -Fibers). -Fibers is the fiberless side of a chip.
- Store intact plants or excised plant organs in humid chambers in long-day conditions (16 h light, 8 h dark) if needed. For excised organs, use a plastic Petri dish with wet paper towels.
4. On-chip method (where a drop of solution to deliver is placed on a VACNF chip), rigid substrate (Figure 1B)
- Remove the photoresist with increment washes of acetone (100%, 5 min), IPA (100%, 5 min), and ddH2O (5 min) prior to use.
- Drop cast 1 µL droplet of dye or plasmid DNA (200 ng) onto the fiber side of VACNF chip with rigid substrate. Ensure to place the droplet in the center of the chip and cover several fibers. Let the droplet dry for 15 min.
NOTE: The orientation of the chips can be determined by the "shininess" of the wafer. The shiny side of the chip has fibers, and the opaque side does not. - When working with leaves or other excised organs, place them on top of a hard surface. When working with intact plants, place a hard surface beneath the organ to which VACNFs are applied.
- After the 15 min drying step, position the VACNF chip such that the fiber side comes in contact with the plant tissue. Tap the chip with the back end of a pair of tweezers.
NOTE: The amount of force applied when tapping will vary depending on the type of plant tissue used. It is recommended to practice tapping chips. - Repeat steps 3.6-3.7 of the on-plant method.
5. Applying VACNFs in SU-8 films to plant tissue using the on-chip method (Figure 1C)
- Place 1 µL droplet of dye or DNA (200 ng) onto the fiber side of the SU-8 film and let it dry for 10 min. Be sure to place the droplet in the center of the chip.
NOTE: There are different drying times depending upon the substrate used. - Using a pair of sharp tweezers, place the VACNF film onto the plant surface.
NOTE: The longer the SU-8 films are left out in the air, the more brittle the films become. To limit the risk of losing the SU-8 films, ensure to have all plants/samples and equipment near the SU-8 films. - Gently roll a small makeup applicator over the VACNF film. Mark the areas where the flexible substrates are placed with a soft-tipped marker. Remove the flexible substrates from the plant surface using tape.
NOTE: The amount of force applied when rolling the makeup applicator will vary among the plant tissues used. Practice applying the VACNF films prior to conducting biomolecule or dye delivery. Visible damage to plant tissues is apparent when one can see the outlines of VACNF film in the plant tissue. - Repeat steps 5.1-5.3 for controls and store plants as mentioned in step 3.7 of the on-plant method.
6. Microscopy and image analysis for all delivery methods
- Image the samples using a confocal microscope using emission and excitation wavelengths suitable for the delivered fluorescent probe/reporter.
NOTE: The time required for the transient transformation varies with the plant species and the marker delivered. For example, the expression of fluorescent markers was detected after 48 h in Arabidopsis versus 96 h in lettuce leaves7. - When imaging, try to focus on a region with detached fibers. Fibers will have different orientations. The success of delivery is not dependent on appearance of broken-off fibers.
NOTE: Fibers will be fluorescent with the most common excitation/emission settings due to the formation of silicon nitride layer resulting from the fiber formation in PECVD18. - Capture at least 5 images for each sample. The resulting signal will vary.
- Measure the fluorescence values as total fluorescence (integrated density) in 20 µm x 20 µm confocal image areas7 using ImageJ19.
Results
The distinct advantage of VACNF chips on rigid or flexible substrates is the ability to deliver biomolecules or dyes to specific locations on a plant (Figure 1). Here, we used fluorescence readouts to assess delivery. Using different plants, substrates, and delivery methods (on-chip or on-plant), there can be differences in the timing of the appearance of dye fluorescein. To determine whether VACNF chips/films work for delivery, a fast approach is to use fibers for dye delivery (Figure 9). Images labeled with different times in Figure 9 are different fields of view from the same samples. When using on-plant method, fluorescein dye can be observed immediately after delivery using fluorescence microscopy. Additionally, if the same field of view is imaged over time after delivering fluorescein dye to a plant, the signal intensity becomes less bright over time (Figure 10). The fluorescein dye could potentially be moving from the field of view to other areas of the leaf through plasmodesmata20,21. Compared to the on-plant method, in the on-chip method with fibers on the rigid substrate, the dye moves slower throughout the impaled area (Figure 9). This could be a result of the dye detaching from fibers/rehydrating in the cells and thus taking more time to move.
Fibers in the flexible substrate were suitable for dye delivery to curved surfaces such as strawberries and apples (Figure 11 and Figure 12). Using a flexible substrate with strawberries, a strong fluorescein signal was observed right away (Figure 11), whereas it took 2 h to see a strong fluorescein signal in apples (Figure 12B,D). The successful delivery of plasmids encoding fluorescent markers can be determined using fluorescence microscopy to find the resulting signal (Figure 12F, Figure 13, and Figure 14). Controls are necessary to determine whether the plant of choice has no autofluorescence similar to the fluorescent marker we want to deliver by fibers. Using fibers alone is helpful to determine if the impact force applied with tweezers results in damage to the plant tissue or if the observed fluorescence within the sample is due to the VACNFs, which are inherently fluorescent because of their silicon nitride layer18 (Figure 13C-D). Fibers impaled in plant tissue do not induce wound response as assessed by H2O2 production6. Lastly, using the control of +DNA, -Fibers is necessary to confirm that DNA is not entering into the plant through tapping alone and confirms that the fibers are necessary for delivery into plant cells (Figure 13E-F). There should be no distinct difference when using the on-plant or on-chip methods of delivery using the VACNFs on a rigid substrate, as indicated by the lack of significant difference in fluorescence values (Figure 13I). Using the flexible VACNF films with on-chip DNA delivery resulted in a successful transient transformation of epidermal cells in store-bought apples and onions (Figure 12F and Figure 14).
Failed experiments may have fibers broken off in different fields of view, but there will be no resulting fluorescence signal from the attempt to deliver plasmid DNA or dye. If too much pressure is applied to the plant, there will be apparent tissue damage (Figure 15). This mechanical damage may look like small holes or transparent areas in the plant as if a layer of cells has been removed when looking at the plant under a microscope. Sometimes imprints of the chip will be visible. An experiment in which fluorescent protein expression is not detected after DNA delivery may also be due to the use of low-quality DNA, so it may be useful to prepare fresh DNA.
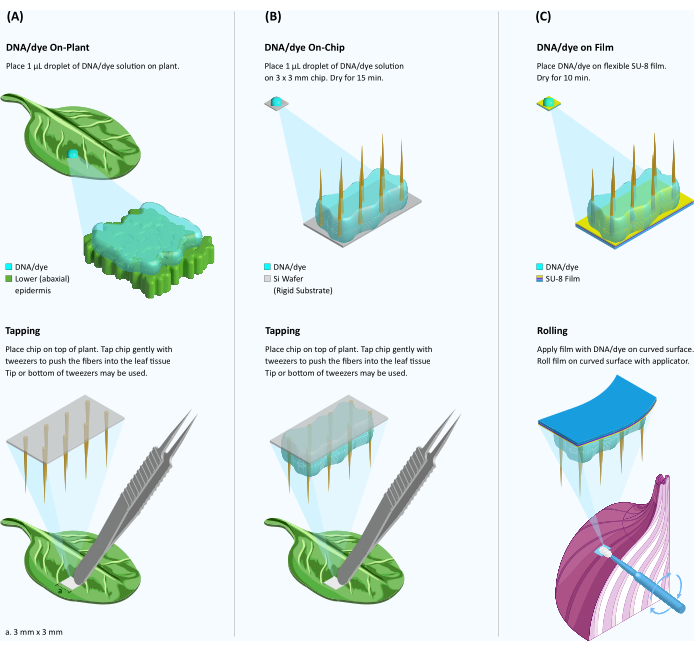
Figure 1: Schematic of dye/DNA delivery to plant tissue using fibers on rigid and flexible substrates. (A) On−plant, fiber-mediated dye/DNA delivery. A 1-µL droplet of dye/DNA solution is placed on the surface of a leaf and the VACNF chip is placed on top of the droplet. Using a pair of tweezers, the chip is gently tapped into the tissue. The rigid substrate is removed leaving nanofibers within the tissue. (B) On-chip fiber-mediated DNA delivery. A 1 µL droplet of dye or DNA solution is drop cast on the VACNF chip and dried for 15 min. The chip with semidried DNA is placed on top of the leaf surface and tapped into the tissue as in panel A. (C) On-chip SU-8 film DNA delivery. Fibers are transferred from the rigid silicon substrate to flexible SU-8 backing. A 1 µL droplet of dye/DNA solution is drop cast on the VACNF film and dried for 10 min. The VACNF film with the semidried dye/DNA is then rolled onto a curved plant surface using a makeup applicator. Please click here to view a larger version of this figure.
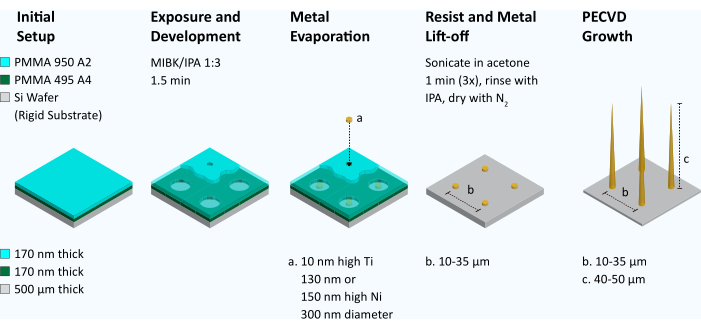
Figure 2: Workflow for making vertically aligned carbon nanofiber arrays. To produce VACNFs, a double layer of polymethyl methacrylate (PMMA 495 A4 followed by PMMA 950 A2) is spin-coated onto a silicon wafer. Electron beam lithography is used to define an array of dots 300 nm in diameter. The resist is then developed in methyl isobutyl ketone/isopropanol (MIBK/IPA), 1:3 for 1.5 min. Using a metal evaporator, an adhesive layer of Ti (10 nm) is applied to the wafer, followed by a layer of Ni (130 nm or 150 nm). The remaining resist is then removed via lift-off (bath sonication in acetone). The geometry of catalyst dots is inspected via SEM. If the catalysts resemble hockey pucks and are flat, they are placed in the plasma enhanced chemical vapor deposition (PECVD) machine and fibers are grown. The fibers were then inspected using SEM. Please click here to view a larger version of this figure.
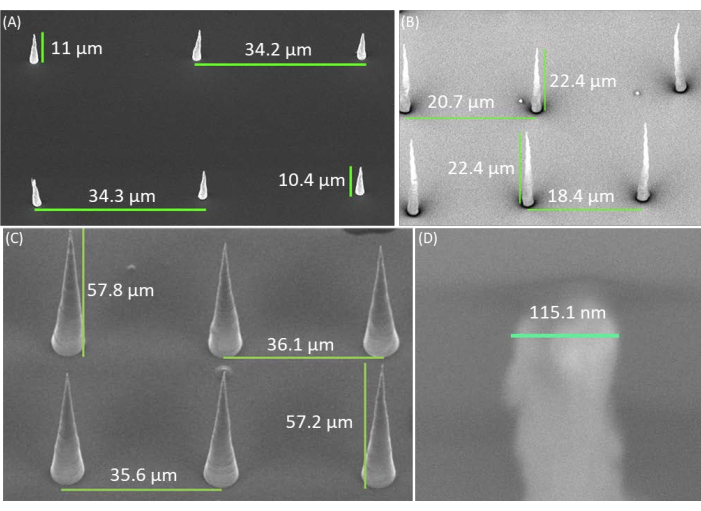
Figure 3: SEM images of ideal vertically aligned carbon nanofibers. (A) Electron micrograph of VACNFs with a ~35 µm pitch and a height of 10-15 µm, imaged at a 30° angle. This image is duplicated in Figure 7C. (B) Electron micrograph of VANCFs with ~20 µm pitch and 20-30 µm height, and imaged at a 30° angle. (C) Electron micrograph of VANCFs with ~35 µm pitch, 50-60 µm height, and imaged at a 30° angle. (D) Electron micrograph of VACNF tip with a diameter <200 nm. There is variation in the fiber tip diameters (150-300 nm). Because the fibers were imaged at 30° angle, the heights appear to be smaller than the actual height by a factor of sin(30°)=1/2. Panels A and B have been reprinted with permission from Morgan et al.7. Please click here to view a larger version of this figure.
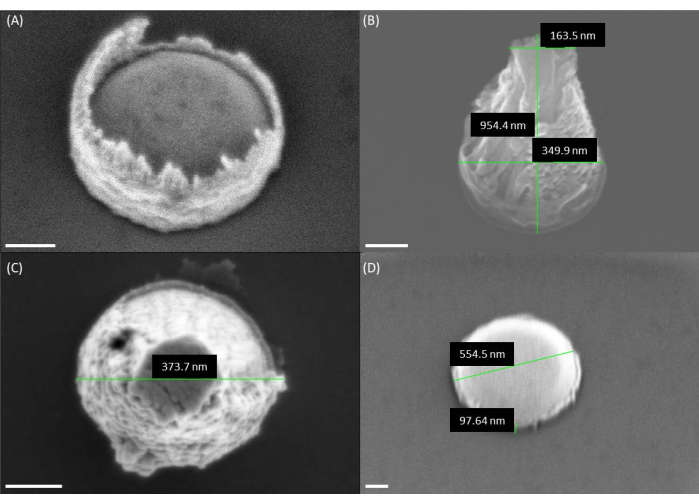
Figure 4: SEM images of catalyst geometry prior to growing VACNFs. (A) SEM image of the catalyst after lift-off. Note that photoresist is present around the rim of the catalyst, resulting in a volcano shape. (B,C) SEM images show the volcano shapes of the catalyst after using a single-layer PMMA resist. (D) Desired hockey puck catalyst shape made from double layers of PMMA. Because the fibers were imaged at 30° angle in panels A, B, and D, the heights appear to be smaller than the actual height by a factor of sin(30°) = 1/2. Scale bars represent 100 nm. Please click here to view a larger version of this figure.
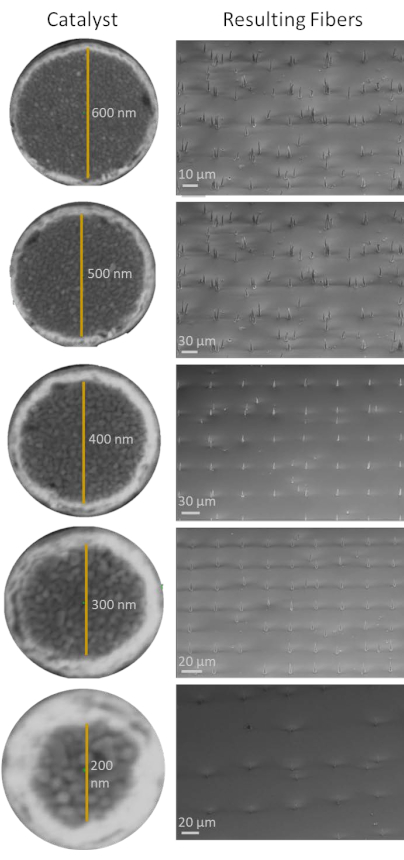
Figure 5: Effect of catalyst dot size on fiber growth: To establish the optimal diameter of the catalyst material, fibers were grown from dot sizes ranging from 200-600 nm. Dot sizes ranging from 400-600 nm led to dewetting of the catalyst and the growth of multiple fibers. The best fiber geometry was produced by 300 nm diameter. Smaller dots led to insufficient fiber height. Due to the fact that the fibers were imaged at 30° angle, the heights appear to be smaller than the actual height by a factor of sin(30°) = 1/2. Images were taken using scanning electron micrograph. Please click here to view a larger version of this figure.
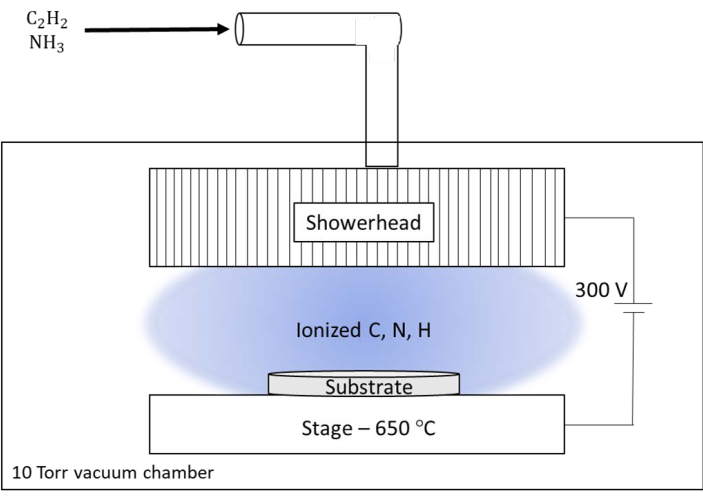
Figure 6: Schematic illustration of the direct current - plasma enhanced chemical vapor deposition (dc-PECVD) system used at Oak Ridge National Laboratory (ORNL). The custom system at ORNL has a large showerhead that serves as the reactor for feed gases and output for plasma. The showerhead was maintained at a DC potential of 300 V relative to the heated stage for the substrate. Please click here to view a larger version of this figure.
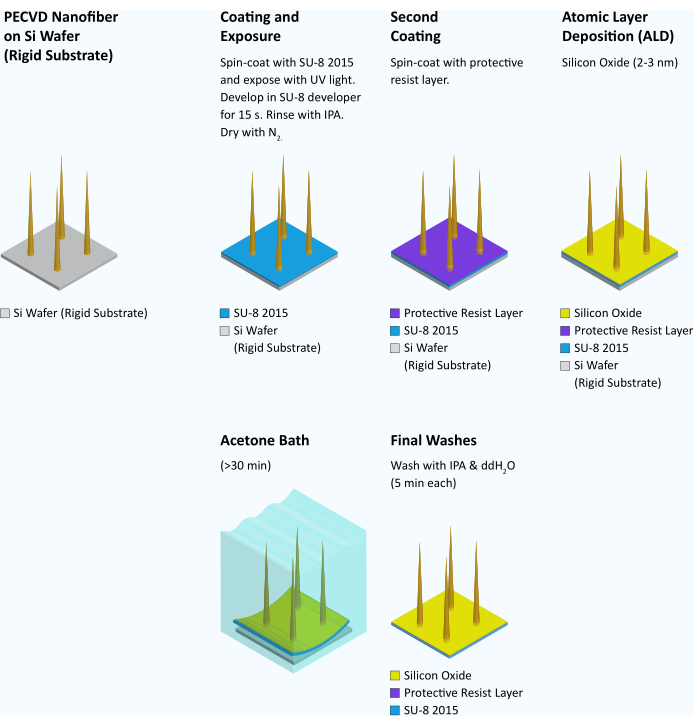
Figure 7: Workflow for transferring fibers from a rigid substrate to a flexible substrate. After nanofiber synthesis and inspection, each wafer is spin-coated with SU-8 2015 at 4000 rpm for 45 s. The wafer is then soft-baked for 3 min at 95 °C. Then the wafer is exposed to UV light and patterned in a mask aligner at 95 mJ/cm2. After postbaking for 6 min at 95 °C, the wafer is developed in the SU-8 developer for 15 s, rinsed with IPA, and dried with N2 gas. A protective resist layer of SPR 955 CM 0.7 is spin-coated on the wafer at 3000 rpm and softbaked at 90 °C for 30 s. A silicon oxide layer (2-3 nm) is then added to the wafer via atomic layer deposition (ALD) (22 cycles at 100 °C) to make the flexible substrate hydrophilic15. The wafer is then diced into 3 mm x 3 mm squares with a dicing saw. At the time of use, individual chips are placed in acetone until SU-8 starts to curl and becomes concave (>30 min). At this time, the SU-8 layer on most chips can be grabbed at the edge with sharp tweezers and peeled from the underlying silicon substrate as an intact 3 mm square film. The film is then washed successively in IPA and water for 5 min each and used immediately. Please click here to view a larger version of this figure.
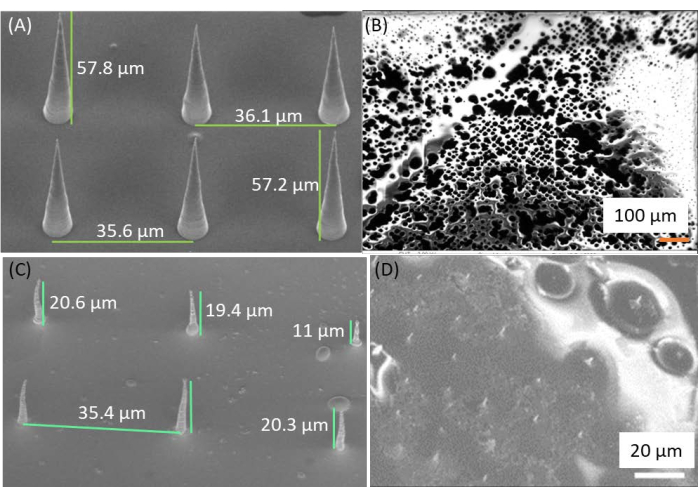
Figure 8: SEM images of fiber transfer from a rigid substrate to a flexible substrate. Images shown are representative but come from different samples. (A) Long fibers after PECVD growth (same image as in Figure 2C). (B,C) Fibers after application of SU-8. The epoxy wells up around the base of fibers. The exposed fiber length ranged from 5 µm to 30 µm. (D) Fibers embedded in Su-8 after lift-off retained their geometry. Due to the fact that the fibers were imaged at 30° angle, the heights appear to be smaller than the actual height by a factor of sin(30°)=1/2. Panel A has been reprinted with permission from Morgan et al.7. Please click here to view a larger version of this figure.
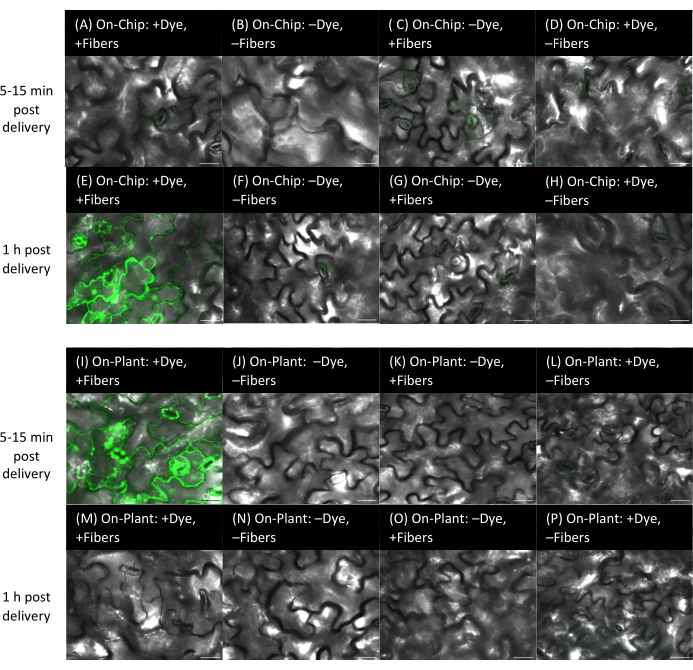
Figure 9: Dye delivery to Arabidopsis leaves using on-chip and on-plant methods with fibers on rigid substrates. (A-P) Images were acquired using confocal microscopy. On-chip method (A-H): 1 µL of 10 µM fluorescein dye was dried for 15 min on VACNF chips, and then the chips were tapped into the abaxial side of Arabidopsis leaves with tweezers. (A-D) Leaves imaged within 5-15 min post-delivery. (E-H) Leaves imaged 1 h after delivery. (A,E) +Dye, +Fibers. Controls: (B,F) -Dye, -Fibers; (C,G) -Dye, +Fibers; (D,H) +Dye, -Fibers. (I-P) On-plant method: 1 µL of 10 µM fluorescein dye was placed on the plant surface, chips were positioned such that they came into contact with the droplet, and tweezers were used to tap the chip into the abaxial side of Arabidopsis leaves. (I-L) imaged within 5-15 min post-delivery and (M-P) imaged 1 h after delivery. (I,M) +Dye, +Fibers. Controls: (J,N) -Dye, -Fibers; (K,O) -Dye, +Fibers; (L,P) +Dye, -Fibers. Panels A-P are single planar images from z-stacks. Scale bars are 20 µm. Fibers have a 35 µm pitch. Please click here to view a larger version of this figure.
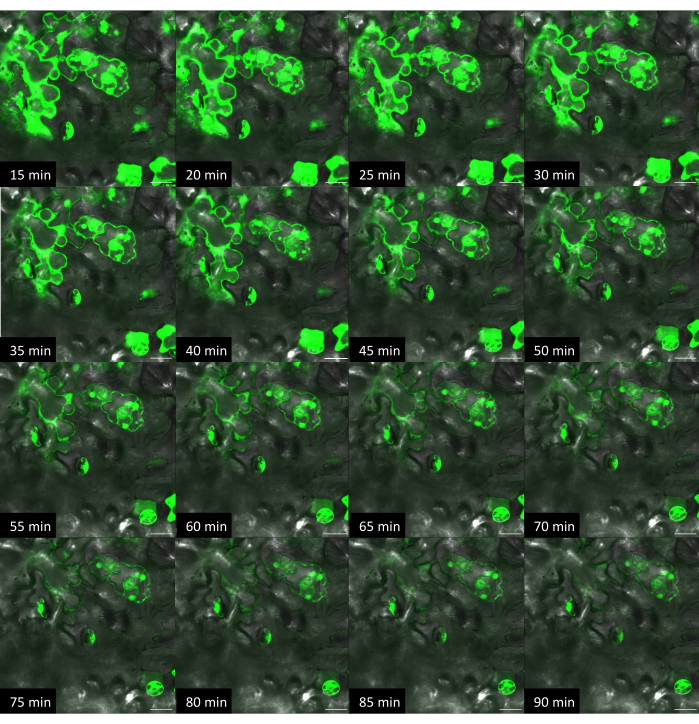
Figure 10: Time course of dye delivery in Arabidopsis via on-plant method with rigid substrate. Images were acquired using confocal microscopy. Using the on-plant method, 1 µL droplet of fluorescein dye solution (10 µM) was placed on the surface of a leaf, and the VACNF chip was placed on top of the droplet. Using a pair of tweezers, the chip was gently tapped into the tissue. +Dye, +Fibers images of the same area were acquired every 5 min. Scale bars are 20 µm. Fibers have a 35 µm pitch. Panels are single planar images from z-stacks. Please click here to view a larger version of this figure.
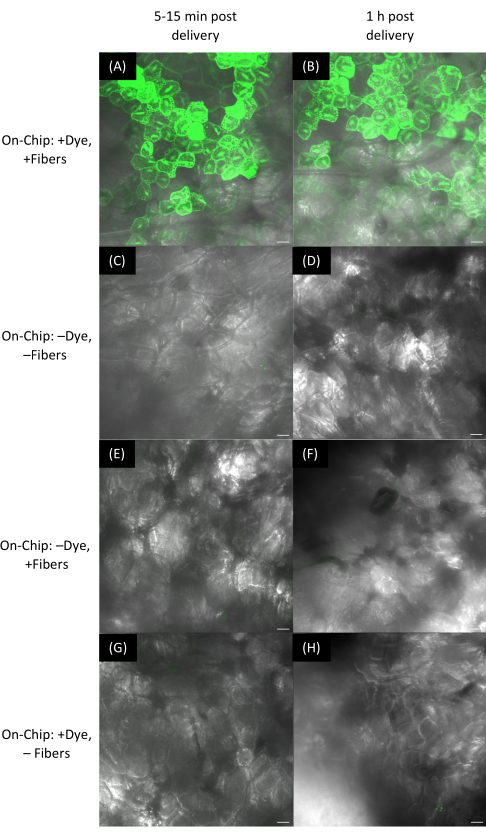
Figure 11: Dye delivery to strawberry fruit using VACNF films. (A-H) Images were acquired using confocal microscopy. Using the on-chip method, dye droplets were dried on VACNF films, which were then rolled onto fruit surfaces using a makeup applicator. Fluorescein dye (10 µM) was delivered to strawberry cells and imaged after (A) 10 min and (B) 1 h. (C,D) No treatment controls (-Dye, -Fibers). (E,F) -Dye, +Fibers controls after 10 min and 1 h, respectively. (G,H) +Dye, -Fibers controls after 10 min and 1 h, respectively. The scale bars are 40 µm. Panels A-H are maximum projections of 188 µm z-stacks. Fibers have a 35 µm pitch. Please click here to view a larger version of this figure.
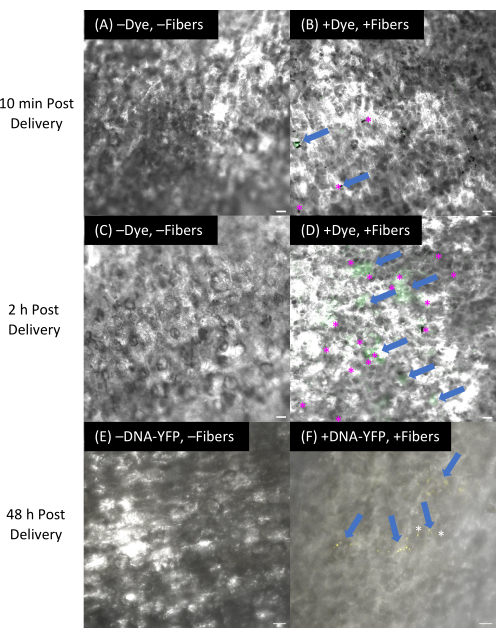
Figure 12: Dye delivery and transient transformation of apples via VACNF films. (A-F) Images were generated using confocal microscopy. Using the on-chip method, 1 µL droplets of fluorescein dye (10 µM, B and D) or 1 µL of plasmid encoding pUBQ10:YFP (DNA−YFP) (200 ng) were dried on VACNF films, which were then rolled onto fruit surfaces using a makeup applicator. Fluorescein dye was delivered to the apple epidermis and imaged after (B) 10 min and (D) 2 h. (D) The dye took some time to diffuse into the cells after delivery. DNA-YFP delivery and expression via VACNF films after (F) 48 h. (A,C,E) no treatment controls (-Dye/DNA-YFP, -Fibers). The scale bars are 40 µm. Panels A-D are single planar images from z-stacks. Panels E and F are the maximum projection of 53 µm z-stacks. The fiber pitch is 35 µm. Arrows denote fluorescein or YFP signals. * indicates fibers. Please click here to view a larger version of this figure.
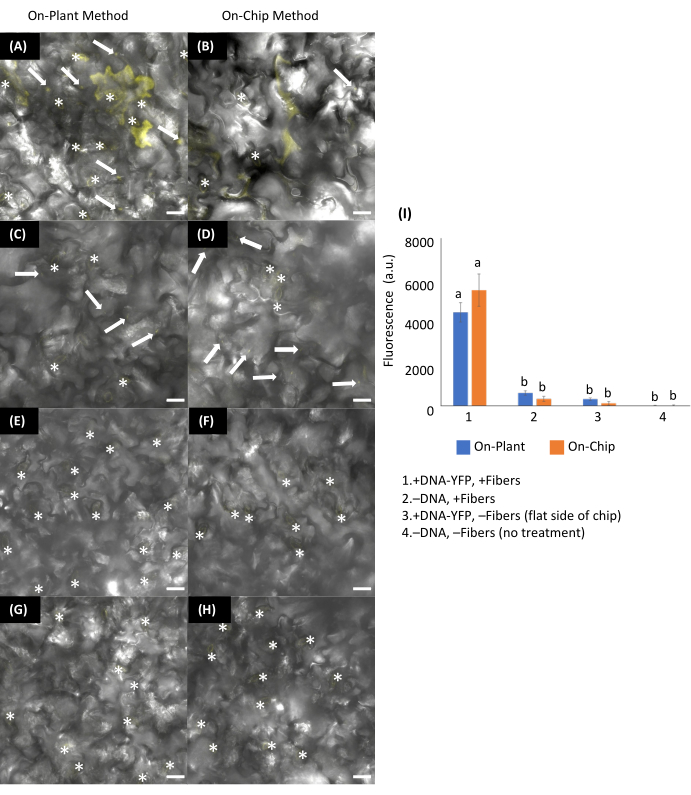
Figure 13: Transient transformation of Arabidopsis leaves using on−plant or on−chip VACNFs methods. (A-H) Images were acquired using confocal microscopy 48 h after DNA delivery. (A,C,E,G) On-plant method: 1 µL of plasmid encoding pUBQ10:YFP (DNA−YFP) (200 ng) was placed on the abaxial side of Arabidopsis leaves. Chips were positioned such that they came in contact with the droplet, and tweezers ware used to tap the chip into leaf tissue. (B,D,F,H) On-chip method : 1 µL of DNA−YFP (200 ng) was dried for 15 min on VACNF chips and then the chips ware tapped into the abaxial side of Arabidopsis leaves with tweezers. +DNA-YFP, +Fibers for (A) on-plant and (B) on-chip. Controls: (C,D) -DNA-YFP, + Fibers; (E,F) +DNA-YFP, -Fibers; and (G,H) -DNA, −Fibers. (I) Graph of relative average fluorescence signal intensity of 25 20 × 20 µm areas from images of 5 biological replicates combined from 2-3 experiments using fluorescence from the YFP channel. Regions containing stomata (*) were excluded due to autofluorescence. The average fluorescence intensity from the -DNA-YFP, -Fibers condition was subtracted from each average. 2−way ANOVA (and Tukey test) was used for significance testing, and error bars represent the standard error of the mean. Different letters show significant differences between treatments (P < 0.0001). All images shown are maximum projections of 40 µm z−stacks. Scale bars are 20 µm. White arrows indicate fibers in the images. The fiber pitch is 35 µm. This figure has been reprinted with permission from Morgan et al.7. Please click here to view a larger version of this figure.
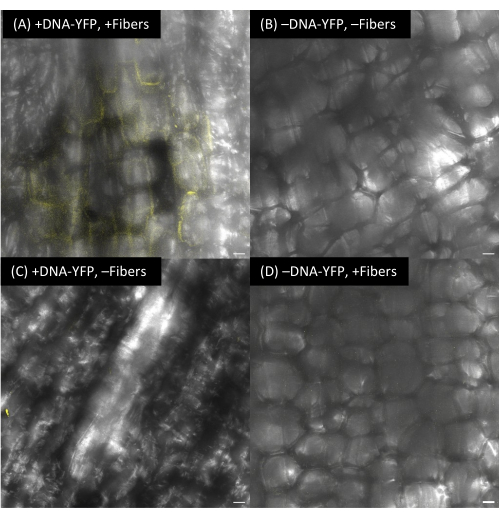
Figure 14: Transient transformation of onions using VACNF films. Images were acquired using confocal microscopy 48 h after DNA delivery. Using the on-chip method, 1 µL plasmid DNA encoding pUBQ10:YFP (DNA-YFP) (200 ng) droplets were dried on VACNF films for 10 min, which were then rolled onto plant organ surfaces. (A) DNA-YFP was delivered to, and YFP was expressed in the onion epidermis. (B) No treatment control; (C) control (+DNA-YFP, -Fibers) and (D) control (-DNA-YFP, +Fibers). The scale bars are 40 µm. Fibers have a 35 µm pitch. Images are maximum projections of 115 µm z-stacks. Please click here to view a larger version of this figure.
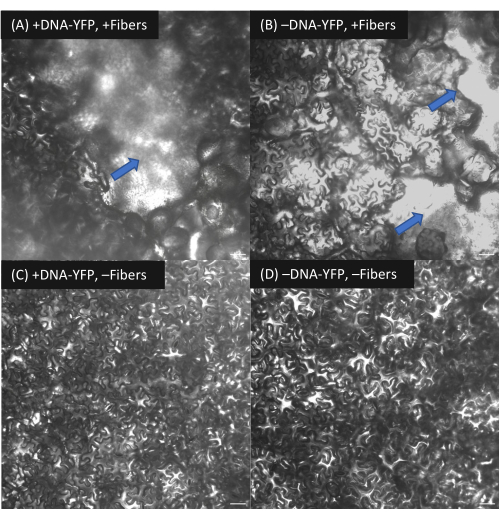
Figure 15: Tissue damage in lettuce from VACNF film application. (A-D) Images were generated using confocal microscopy. (A) The on-chip method was used to deliver DNA to lettuce leaves via VACNF films. pUBQ10:YFP DNA (200 ng) droplets were dried for 10 min on VACNF films, which were then rolled onto the abaxial side of detached lettuce leaves and stored in a humidity chamber for 4 days. (B) control (-DNA-YFP, +Fibers). (C) control (+DNA-YFP, -Fibers), and (D) no treatment (-DNA-YFP, -Fibers). Scale bars are 40 µm. VACNFs have a 35 µm pitch. Arrows point to plant damage resulting from rolling of the flexible substrate with too much force. Note that successful VACNF-mediated DNA delivery in lettuce was achieved in other experiments7. Please click here to view a larger version of this figure.
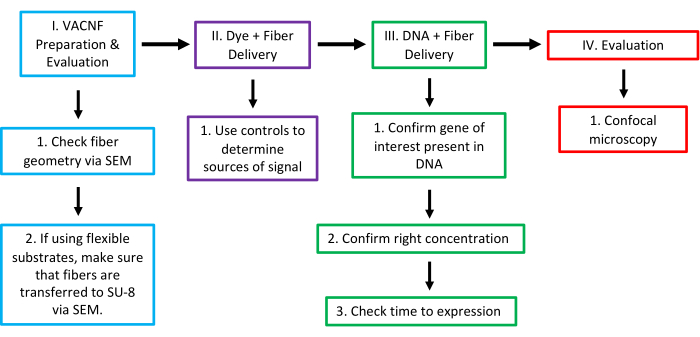
Figure 16: Workflow of VACNF-mediated delivery in plants. In Stage I, check the geometry of the fibers using SEM. For proper delivery, fibers need a tip with a diameter <200 nm. If using fibers on flexible substrate, the next step would be to confirm that fibers are being transferred to SU-8 and to check the height of the exposed fibers via SEM. In Stage II, we tested the usefulness of the fibers by trying to deliver dye into the plant/organ of choice using a rigid or flexible substrate. Use 1 µL droplet, either placing it on the plant surface or briefly drying it on the chip/film. With this step and all other steps, it is imperative to use the proper controls (-Dye,-Fibers; -Dye, +Fibers; and +Dye,-Fibers) to be confident that the signal comes from bona fide dye delivery. In Stage III, confirm that the gene of interest is present in the plasmid, determine the concentration of DNA to deliver, and test the optimal amount of time after delivery to check expression. In Stage IV, the outcome was evaluated using confocal microscopy to check the expression of the delivered marker. This figure has been modified with permission from Morgan et al.7. Please click here to view a larger version of this figure.
Discussion
In this paper, we presented methods for constructing vertically aligned carbon nanofiber arrays, transferring the fibers to a flexible substrate, and applying fibers in either a rigid or flexible substrate to plants for use in the delivery of biomolecules or dyes to plants. We described two general approaches, the on-chip and the on-plant methods, for deposition of the introduced materials and showed successful results in fibers on a rigid substrate as well as the on-chip method using VACNF films. The application of these fibers is simpler in practice and theory than traditional plant transformation methods (particle bombardment, protoplast transformation via PEG or electroporation) and may be used for plants recalcitrant to Agrobacterium-mediated transformation. However, only a few cells are transformed.
Vertically aligned carbon nanofibers were produced at Oak Ridge National Laboratory Center for Nanophase Materials Sciences through their user program. Users can apply to use this facility for the production of VACNFs. Alternatively, VACNF chips can be produced in clean rooms with direct current plasma-enhanced chemical vapor deposition machines with a carbon source22,23. With the methods described, there are a few steps that are critical to the production of the fibers, fiber transfer, and application of the VACNF chips/films. For fiber application to work, fibers must be straight and have a tapering diameter of <200 nm at the tip for delivery in plant cells to be successful6,7(Figure 3). To create carbon nanofibers of particular size and pitch, there are a variety of parameters that can be changed, including dot size, lateral pitch, and the amount of catalyst deposited. To select the optimal dot size to be used for the carbon nanofiber production, fibers were grown from various dot sizes (as shown in Figure 5). We found that 300 nm diameters produced the best fibers, hence this dot size was selected (Figure 5). After finding the right parameters, we looked to use chips that have >50% of fibers with the ideal geometry (straight and a tip diameter <200 nm). To check the geometry of the fibers, we used scanning electron microscopy to image random fields of view on a sample of VACNF chips/films.
Additionally, the fibers must have a certain minimum length to achieve delivery within plant cells. The importance of producing fibers of different length is that longer fibers could be used to penetrate deeper tissue layers. Longer fibers (>40 µm in length) are essential for flexible films as the fiber transfer works by breaking the fibers from their base and requires layering SU-8 on top of the fibers. The working thickness of the SU-8 layer used for this protocol is 20-35 µm. The minimum height necessary to accomplish delivery within the epidermis of various plants (curved or flat) is 10-15 µm6,7. As a result, fibers with lengths >40 µm are necessary for VACNF films. There are several different parameters to consider when producing carbon nanofibers: catalyst material, catalyst geometry, thickness of catalyst material as well as conditions within the PECVD chamber (gas ratio, pressure, temperature, current, showerhead height, and growth time)8,9,24,25. To produce carbon nanofibers longer than 25 µm used by Morgan et al.7 and Davern et al.6, we increased the amount of Ni catalyst, altered the acetylene : ammonia ratio, and increased the current and the growth time. Additionally, we paid more attention to the geometry of the catalyst material. To produce tall straight fibers, the deposited catalyst needed to have a hockey puck shape rather than a shape that resembles a volcano (Figure 4). Volcano structures arise from remnants of photoresist after lift-off. To prevent the formation of volcanoes, a double layer of PMMA was used to create an undercut during electron beam lithography26. The undercut aids in lift-off of the deposited metal catalyst (Figure 2). The thick layer of the catalyst is important for the growth of tall VACNFs. The morphology of the VACNFs has been examined by Merkulova et al.24. The vertical alignment of VACNFs is due to both the Ni catalyst tip-type growth and the alignments of the DC potential perpendicular to the substrate (Figure 6). The showerhead describes the geometry of PECVD reactor (Figure 6) and serves as the source for the potential for the electric field27.
To define the array of catalyst dots with electron beam lithography, we applied an electron beam resist (polymethyl methacrylate), then used the e-beam to make small holes in the resist with a specific shape and in specific locations on the wafer. Holes of the desired diameter were placed on a regular grid with the defined spacing (pitch) and a file specifying the desired pattern was loaded into the electron beam lithography tool prior to loading the substrate into the machine. In addition to fiber height, another critical parameter for successful fiber transfer is the amount of time spent in the acetone bath. The VACNF films need to be left in the acetone bath long enough that their edges begin to curl; if they are left in the acetone bath for too little time, they are more difficult to lift off the chips and may break. The older the chips are, the longer they will have to remain in the acetone bath. Following the acetone bath, the films/chips were placed in isopropanol and water to remove access acetone as well as to remove the protective photoresist on the fibers.
To perform spin coating, wafers or wafer pieces are placed on a vacuum chuck in the spin coater, and the central position of the wafer is verified using the test function of the spin coater. A small puddle (~2.5 cm in diameter) of resist is applied to the center of the wafer and spun (3000 rpm for 45 s) Images of the fibers before and after spin coating are included in Figure 8 showing the preservation of fiber geometry (height, orientation, and pitch). The presence of fibers causes resist to well-up at the base of the fibers and results in thicker-than-expected layers. Spin-coating after VACNF growth has been explored by other groups11,18.
Another step within the process that is of vital importance is to ensure that the right amount of force is applied to VACNF chips/films. The delivery mechanism is dependent upon fibers making small punctures in cell walls via the impulse force of the tweezer tapping on rigid substrates6,7 or rolling with the mini-makeup applicator on flexible substrates. Fibers may or may not break off and remain imbedded in plant cells6,7without impact on the outcome, but practice in conjunction with examination for dye uptake and tissue damage is necessary to get the pressure right. Additionally, it is important to choose appropriate imaging time points after DNA delivery with VACNF chips/films as the time to detectable expression varies between plant species and the types of vectors being delivered7 (Figure 16).
As broadly applicable as this method is to plants, it has a few limitations. For example, adding a thin layer of silicon oxide to the VACNF films does not always result in films being completely hydrophilic because of the protective layer of photoresist added on top of the SU-8. If this problem materializes, thicker layers of silicon oxide could be applied to VACNFs. To test if the films are hydrophobic or hydrophilic, they can be placed in water. If the films sink, they are hydrophilic, and if they float, they are hydrophobic. Additionally, there can be variation between batches of fibers produced. There are several parameters that can be altered when growing the fibers in the dc -PECVD machine; what is described in this protocol is a set of parameters for two different amounts of Ni catalyst. Additionally, the crystal orientation of the Ni catalyst cannot be controlled28 and some branching will inevitably result in the fibers.
While we demonstrated the delivery of fluorescein dye and DNA to plant cells using both rigid and flexible substrates for this paper, the method should be broadly applicable for other biomolecules and genetic modification approaches, for example, RNAi silencing for plant systems like apples or other fruits where it would take years to produce stable transgenic lines. Moreover, these fibers could also be used to deliver genetic editing materials or for stable transformations in plants.
Disclosures
The authors have nothing to disclose.
Acknowledgements
Nanofiber arrays were fabricated at the Center for Nanophase Materials Sciences, which is a Department of Energy Office of Science User Facility (Proposal ID: CNMS2019-103 and CNMS2022-A-1182). Support from CNMS is awarded through a peer-reviewed proposal system and is provided at no cost to successful applicants who intend to publish their results (http://www.cnms.ornl.gov/user/becoming_a_user.shtml). We thank Kevin Lester and CNMS for assistance with the production of nanofiber arrays. We thank Dr. John Caughmen, Dr. Timothy McKnight, Dr. Amber Webb, Daryl Briggs, and Travis Bee for critical discussions on experimental design. We thank Dr. Adam Rondinone for the schematic of the PECVD machine. We thank Leslie Carol for the scientific illustrations. This work was funded by the Bioimaging Science Program, U.S. Department of Energy, Office of Science, Biological and Environmental Research, DE-SC0019104, and United States Department of Agriculture, 2021-67013-34835. JMM was supported by the United States Department of Agriculture: National Institute of Food and Agriculture: Agriculture and Food Research Initiative Predoctoral Fellowship 2021-67034-35167.
Materials
| Name | Company | Catalog Number | Comments |
| 13" x 13" White 1/4-fold heavy duty Brawny industrial shop towel 70Ct | Fastenal | 690535 | |
| 2-Propanol (IPA) | Fischer Scientific | A451-4 | |
| 4" Lid | Entegris | H22-401-0615 | Wafer Carriers |
| 4" tray | Entegris | H22-40-0615 | Wafer Carriers |
| Accretech SS10 dicing saw | Accreteck | SS10 | |
| Acetone | Fischer Scientific | A18-4 | |
| Acetone used in the cleanroom at ORNL | JT Baker | 9005-05 | |
| Apples | Grocery store | No product number | |
| Arabidopsis thaliana | Seeds of accession Columbia from the laboratory of Professor Jean Greenberg at the University of Chicago | No product number | |
| Carbon direct current plasma enhanced chemical vapor deposition machine | Oak Ridge National Laboratory | Custom-built | |
| Cobham Green lettuce | Seeds from the laboratory of Professor Richard Michelmore at the University of California, Davis | No product number | Butterhead lettuce |
| Fluorescein dye | Sigma Aldrich | F2456-2.5G | |
| Gel-box | Gel-Pak | AD-23C-00-X4 | |
| Heidelberg DWL 66 direct-write lithography tool | Heidelberg | DWL 66 | |
| ImageJ | National Institues of Health | No product number | |
| Isoproponal (IPA) used in the cleanroom at ORNL | Doe and Ingalls | CMOS Grade 9079-05 | |
| JEOL 9300FS 100kV electron beam lithography system | JEOL | 8100 | |
| Kimwipes | Kimtech | Kimberly-Clark Professional 34120 | |
| Kord-Valmark disposable polystyrene petri dish | VWR | 11019-554 | |
| Layout Editor | juspertor GmbH | No product number | |
| LSM 710 confocal microscope | Zeiss | No product number | |
| LSM 800 confocal microscope | Zeiss | No product number | |
| Make-up applicator | Amazon | G2PLUS | 500 PCS Disposable Micro Applicators Brush for Makeup and Personal Care (Head Diameter: 1.5 mm)- 5 x 100 PCS |
| Merlin field emission scanning electron microscope | Zeiss | Merlin | |
| MIBK/IPA (methyl isobutyl ketone/isopropanol) (1:3) | Microchem | M089025 | |
| Onions | Grocery store | No product number | |
| Oxford FlexAl atomic layer deposition | Oxford | FlexAl | |
| PMMA 495 A4 | Microchem | M130004 | |
| PMMA 950 A4 | Microchem | M230004 | Can dilute down to A2 |
| Polyethylene terephthalate (PET) | Amazon | KS-6304-21-11 | Type D Clear PET (Polyester) Sheet .0005" Thick x 27" Width x 10 Ft Length 1 pc |
| Precision tweezers | Aven Inc. | 18032TT | |
| pUBQ10:YFP-GW | Arabidopsis Biological Resource Center | CD3-1948 | |
| Silicon etcher (used for descum) | Oxford | Plasmalab | |
| Silicon rubber kit | Smooth-On Inc | Ecoflex 00-20 | |
| Silicon wafers | Pure Wafer | 4N0.001-.005SSP-INV | |
| Spin coater | Brewer Sciences | Model 100CB | |
| SPR 955cm 0.7 | Megaposit | 10018314 | |
| Strawberries | Grocery store | No product number | |
| SU-8 2015 | Microchem | SU-8 2000 Series | Toxic. Handle with care. Wear chemical goggles, chemical gloves and suitable protective clothing when handling SU-8 2000 resists. Do not get into eyes, or onto skin or clothing. |
| SU-8 developer | Microchem | SU-8 2000 Series | Handle with care. Wear chemical goggles, chemical gloves and suitable protective clothing when handling SU-8 2000 resists. Do not get into eyes, or onto skin or clothing. |
| Suss MicroTec contact aligner | Suss MicroTec | MA6/BA6 | |
| Table top microscope | Phenom XL | used for checking Ni catalysts after metal deposition | |
| Thermionics VE-240 e-beam evaporator | Thermionics | VE-240 |
References
- Canto, T. Transient expression systems in plants: potentialities and constraints. Advances in Experimental Medicine and Biology. 896, 287-301 (2016).
- Gou, Y. J., et al. Optimization of the protoplast transient expression system for gene functional studies in strawberry (Fragaria vesca). Plant Cell, Tissue, and Organ Culture. 141, 41-53 (2020).
- Baltes, N. J., Gil-Humanes, J., Voytas, D. F. Genome engineering and agriculture: Opportunities and challenges. Progress in Molecular Biology and Translational Science. 149, 1-26 (2017).
- Ren, R., et al. Highly efficient protoplast isolation and transient expression system for functional characterization of flowering related genes in Cymbidium orchids. International Journal of Molecular Sciences. 21 (7), 2264 (2020).
- Kumar, S., et al. Nanovehicles for plant modifications towards pest-and disease-resistance traits. Trends in Plant Science. 25 (2), 198-212 (2020).
- Davern, S. M., et al. Carbon nanofiber arrays: a novel tool for microdelivery of biomolecules to plants. PLoS One. 11 (4), e0153621 (2016).
- Morgan, J. M., et al. An efficient and broadly applicable method for transient transformation of plants using vertically aligned carbon nanofiber arrays. Frontiers in Plant Science. 13, 1051340 (2022).
- Melechko, A. V., et al. Vertically aligned carbon nanofibers and related structures: Controlled synthesis and directed assembly. Journal of Physics D: Applied Physics. 97, 041301 (2005).
- Melechko, A. V., Desikan, R., McKnight, T. E., Klein, K. L., Rack, P. D. Synthesis of vertically aligned carbon nanofibres for interfacing with live systems. Journal of Physics D: Applied Physics. 42 (19), 193001 (2009).
- Nelson-Fitzpatrick, N. . Novel Materials for the Design of Cantilever Transducers [dissertation]. , (2011).
- Fletcher, B. L., et al. Transfer of flexible arrays of vertically aligned carbon nanofiber electrodes to temperature-sensitive substrates. Advanced Materials. 18 (13), 1689-1694 (2006).
- Keller, S., Blagoi, G., Lillemose, M., Haefliger, D., Boisen, A. Processing of thin SU-8 films. Journal of Micromechanics and Microengineering. 18 (12), 125020 (2008).
- Wouters, K., Puers, R. Diffusing and swelling in SU-8: insight in material properties and processing. Journal of Micromechanics and Microengineering. 20 (9), 095013 (2010).
- Jamal, M., Zarafshar, A. M., Gracias, D. H. Differentially photo-crosslinked polymers enable self-assembling microfluidics. Nature Communications. 2, 527 (2011).
- Williams, R., Goodman, A. M. Wetting of thin layers of SiO2 by water. Applied Physics Letters. 25 (10), 531-532 (1974).
- Kundu, A., Nogueira Campos, M. G., Santra, S., Rajaraman, S. Precision vascular delivery of agrochemicals with micromilled microneedles (µMMNs). Scientific Reports. 9, 14008 (2019).
- Acanda, Y., Welker, S., Orbović, V., Levy, A. A simple and efficient agroinfiltration method for transient gene expression in Citrus. Plant Cell Reports. 40 (7), 1171-1179 (2021).
- Pearce, R., et al. Synthesis and properties of SiNx coatings as stable fluorescent markers on vertically aligned carbon nanofibers. AIMS Materials Science. 1 (2), 87-102 (2014).
- Schindelin, J., et al. Fiji: an open-source platform for biological-image analysis. Nature Methods. 9 (7), 676-682 (2012).
- Crafts, A. S. Translocation in plants. Plant Physiology. 13 (4), 791 (1938).
- Martens, H. J., Hansen, M., Schulz, A. Caged probes: a novel tool in studying symplasmic transport in plant tissues. Protoplasma. 223, 63-66 (2004).
- Liu, J., Essner, J., Li, J. Hybrid supercapacitor based on coaxially coated manganese oxide on vertically aligned carbon nanofiber arrays. Chemistry of Materials. 22 (17), 5022-5030 (2010).
- Saleem, A. M., et al. Low temperature and cost-effective growth of vertically aligned carbon nanofibers using spin-coated polymer-stabilized palladium nanocatalysts. Science and Technology of Advanced Materials. 16, 015007 (2015).
- Merkulov, V. I., Lowndes, D. H., Wei, Y. Y., Eres, G., Voelkl, E. Patterned growth of individual and multiple vertically aligned carbon nanofibers. Applied Physics Letters. 76 (24), 3555-3557 (2000).
- Retterer, S. T., Melechko, A., Hensley, D. K., Simpson, M. L., Doktycz, M. J. Positional control of catalyst nanoparticles for the synthesis of high density carbon nanofiber arrays. Carbon. 46 (11), 1378-1383 (2008).
- Rooks, M. J., Wind, S., McEuen, P., Prober, D. E. Fabrication of 30-nm-scale structures for electron transport studies using a polymethylmethacrylate bilayer resist. Journal of Vacuum Science & Technology B: Microelectronics Processing and Phenomena. 5 (1), 318-321 (1987).
- Lee, G., Sohn, D. K., Seok, S. H., Ko, H. S. The effect of hole density variation in the PECVD reactor showerhead on the deposition of amorphous carbon layer. Vacuum. 163, 37-44 (2019).
- Fowlkes, J. D., et al. Control of catalyst particle crystallographic orientation in vertically aligned carbon nanofiber synthesis. Carbon. 44 (8), 1503-1510 (2006).
Reprints and Permissions
Request permission to reuse the text or figures of this JoVE article
Request PermissionThis article has been published
Video Coming Soon
Copyright © 2025 MyJoVE Corporation. All rights reserved