Method Article
Measuring Biomethane Potential of Food Scrap Waste Anaerobically Co-Digested with Waste-Activated Sludge Using Respirometry
In This Article
Summary
This protocol describes a best practice for determining methane production and microbial kinetic parameters using respirometry for anaerobic microbiota co-digesting food scrap waste and waste-activated sludge.
Abstract
The use of respirometry to study the biokinetics of microbiota treating wastewater or digesting wastewater sludges has become more prevalent over the last few decades. The use of respirometry to examine the biokinetics of anaerobic microbiota co-digesting organic waste streams such as wastewater sludge and food scrap is an area of active research. To date, no visualized protocol has been published on the topic. Accordingly, in this protocol, we configured a respirometer to measure methane production and flow rate over time using three different food-to-microorganism (F:M) ratios and food scrap waste and waste-activated sludge as substrates. The resulting data, coupled with substrate utilization measurements, provides the basis for understanding how different substrate concentrations influence the rate at which anaerobic microbiota produce methane. Additionally, this protocol presents a method to develop biokinetic parameters (e.g., methane production rate constant and yield). Others can use this respirometry protocol to examine organic degradation under anaerobic conditions and develop microbial parameters.
Introduction
Researchers study microbial activity at the bench scale using a variety of approaches, including batch studies, microcosms, and respirometry, amongst others. Respirometers can be used to measure cellular respiration through the growth and/or decay phases of a microbial community by observing substrate consumption and end-product production under controlled conditions1. The results from bench-scale respirometer studies can also be used to estimate biokinetic parameters for process model construction2. Respirometers have been used to examine both aerobic and anaerobic microbial activity; however, studies using respirometry to measure the biomethane potential (BMP), especially of mixed organic substrates, is an area of ongoing research3,4.
Organics in domestic wastewater are recognized as a viable renewable source of chemical energy5. Anaerobic digestion of wastewater sludges (i.e., primary sludge and waste-activated sludges, WAS) has been used to produce methane-rich biogas at wastewater treatment plants (WWTPs) for well over a century6. However, the digestion of multiple organic waste streams, such as food scrap waste with WAS, has become prevalent only in recent years and is still an active area of research. Food scrap waste is a consistent waste stream of high-density organic material in many developed countries, accounting for approximately 25% of landfill mass in the US7. Aside from diverting a portion of food scraps from disposal in landfills, the combination of food scraps and WAS in a co-digestion scenario is advantageous due to the increased volume of biogas produced (relative to a single organic waste stream). Biogas typically contains 60%-70% methane, 30%-40% carbon dioxide, and trace amounts of other gases (e.g., hydrogen sulfide)8. The biogas can be cleaned and combusted onsite at WWTPs using a combined heat and power technology to offset some of the electrical and heat energy requirements9.
Several studies have examined the biomethanation potential and biokinetic parameters of anaerobic microbiota co-digesting organic wastes1. Available studies in the literature have used batch assays in serum bottles where methane production is measured at discrete points throughout the experiment, while others have measured methane production using flowmeters connected directly to bench- or pilot-scale bioreactors2,10,11. Continuous measurement of methane production using a respirometer, such as the one described in this protocol, can provide continuous and precise methane measurements from a large number of samples run under a variety of experimental conditions1,12. While several studies have measured methane production from co-digestion of WAS coupled with other organic substrates, such as biowaste, fats, oils, grease, and agricultural wastes10,13,14, significant work remains to identify methane production rates from the large variety of co-digestion scenarios. Further, to date, no available protocol provides an in-depth, step-by-step approach using visual depictions for the measurement of methane production from the co-digestion of food scraps and WAS. Accordingly, this study presents a respirometer protocol to measure methane production and derive biokinetic parameters using a mix of dilute wastewater, WAS, and food scrap waste as substrates. Different food-to-microorganism ratios (F:M) were used to help elucidate changes in methane production. Other measurements include volatile suspended solids (VSS), chemical oxygen demand (COD), and pH of each sample. This protocol describes respirometer setup, sample creation, and critical measurements.
Protocol
1. Preparation of substrate
- Collect ~1.5 L of primary effluent, ~1 L of waste-activated sludge (WAS).
NOTE: WAS samples should be taken immediately prior to the experiment; however, WAS can be stored for up to 48 h at 4 °C prior to the experiment with no discernable impact on its use as a substrate15,16,17. - Acquire 2 L of anaerobic culture immediately prior to the experiment and maintain the culture at 35 °C. Limit contact with air as much as possible during the transfer from the anaerobic digester to the collection bottle.
NOTE: The anaerobic culture used in this study was obtained from a WWTP treating 8.5 MGD (38,640 m3/d) with anaerobic digestion of wastewater primary sludge. A best practice is to maintain anaerobic conditions by flushing the collection bottle with nitrogen gas prior to acquiring an anaerobic culture13 and maintaining anaerobic conditions during transport and storage. - Gather food waste and store it for up to 48 h prior to the experiment at 4 °C.
NOTE: depending on the experimental design, care should be taken to identify food wastes with the target proportions of carbohydrates, proteins, etc. Target proportions of organics in food waste will likely vary by experiment. The fraction of carbohydrates, proteins, and fats in the food gathered can be estimated from published literature or evaluated using established protocols (e.g., gas chromatography).
2. Preparation of nutrient supplements
- Prepare mineral base solution #1 by mixing 800 mL of deionized (DI) water with CoCl2·6H2O (0.25 g), FeCl3·6H2O (5 g), MnCl2·4H2O (0.05 g), NaMoO4·2H2O (0.005 g), NiCl2·6H2O (0.025 g), CuCl2·2H2O (0.007 g), ZnCl2 (0.025 g), H3BO3 (0.025 g), and Na2SeO4 (0.025 g). Dilute up to 1 L with deionized (DI) water.
- Prepare mineral base solution #2 by mixing 800 mL of DI water with CaCl2 (27.7 g) and MgCl2·4H2O (101 g). Dilute up to 1 L with DI water.
- Prepare a nutrient base by mixing 800 mL of DI water with NH4Cl (38.2 g) and Na2SO4 (15 g). Adjust pH to 7.0 using 3.64 N NaOH in DI water and dilute up to 1 L with DI water.
3. Sample preparation
- Combine food waste (Table 2) in a blender (Figure 1) to create a mixture. Ensure that the mixture is free of large particles of food waste. Dilute the food waste with DI water to aid in blending. Annotate the quantity of dilution water for use when calculating Chemical Oxygen Demand (COD) measurements. This diluted food waste is known as 'working waste'. Place working waste in a 1 L plastic bottle and store it at 4 °C.
- Label four 2 L beakers according to Table 1. Place beakers on a stir plate and add a large stir bar. Combine food waste, WAS, and dilution (DI water for control and primary effluent for treatments) according to Table 1 in the 2 L beakers.
- Add 12 mL each of mineral base solution #1, mineral base solution #2, and nutrient base.
- Add 2.4 g of NaHCO3 (powder) to each beaker and stir for 30 s. Label eight respirometry bottles according to Table 1 and add a magnetic stir bar.
NOTE: This will create duplicates of the control and three treatments at different F:M ratios. - Add anaerobic culture to each 2 L beaker according to Table 1 and stir. Immediately measure 500 mL of a mixture from the beaker with a graduated cylinder and transfer it into a labeled respirometer bottle, flush with nitrogen gas, then cap immediately.
NOTE: Care should be taken to limit contact of anaerobic microbiota with atmospheric oxygen (If available, an anaerobic chamber should be used for the transfer).
4. Quantification of initial conditions
- Use the remaining sample from section 3 (~200 mL) to measure pH, total COD (tCOD), soluble COD (sCOD), total suspended solids (TSS), and volatile suspended solids (VSS) for each sample18.
- If necessary, dilute samples with DI water based on the detection limits of the measurement equipment.
NOTE: Manufacturer's procedures were used for COD measurements.
- If necessary, dilute samples with DI water based on the detection limits of the measurement equipment.
5. Respirometer setup
- Set the respirometer (Figure 2) to the low anaerobic setting.
- Push the reset button and the power-on button simultaneously.
NOTE: This is specific to the model used in this study. - Set the chiller (Figure 3) at 35.5 °C.
- Fill each CO2 and moisture scrubber (Figure 4 and Figure 5) with a 50/50 mix of CaSO4 and KOH pellets in the center, surrounded by glass wool on each side.
- Connect the tubes and needles from the sample bottles to the scrubber and then from the scrubber to the gas inlet (Figure 6).
- On the respirometer laptop, run the respirometer program RSA-8-v2.0.
NOTE: This step is specific to the model used in this study. - Select all bottles in the program and select Edit > Data Labels. Name all bottles.
NOTE: This step is specific to the model used in this study. - Begin measuring gas production by activating the Start Button in the program. Set the program to measure data at the end of every half hour. Monitor gas production by selecting Rate Chart or Volume Chart.
NOTE: This step is specific to the model used in this study. - After the experiment (~7 days), stop the run in the program, turn off the chiller, and turn off the RSPF module. Save the data file as a CSV file, then convert it to an MS Excel document.
NOTE: This step is specific to the model used in this study.
6. Post-respiration measurements
- Measure pH, TSS, VSS, and COD on the final samples as done in section 4.
Results
Food waste composition
Food waste used in this study consisted of five different food types typically served at a college dining facility. Each food sample had varying amounts of fats, carbohydrates, and proteins, which are listed in Table 2.19 The blended food scrap waste was 44% carbohydrates, 36% proteins, 16% fats, and 4% other materials. An approximate equal mass of each food type (56 g to 86 g) was used to provide a representative dining facility organic substrate for anaerobic co-digestion. The mass of food scrap waste was subsequently varied to achieve the desired F:M for each scenario examined (0.3, 0.7, and 1.1).
Volatile suspended solid and organic measurements
Results for initial and final VSS and initial and final oxygen demand are found in Table 3. Oxygen demand is presented as BOD5, which was converted from COD using the accepted conversion ratio (COD = 1.6BOD5)8. As shown, initial VSS concentrations (also portrayed by mass in Table 3) increased from the control to the largest F:M ratio (1.1). Each F:M examined exhibited VSS destruction, or anaerobic conversion of organics to gaseous end-products of methane and carbon dioxide. Due to the conversion, the concentration of VSS decreased from initial measurements to final measurements taken at the end of the experiment. The amount of VSS destroyed increased from the control to larger F:M ratios. Unexpectedly, VSS destruction for the F:M = 0.7 scenario exceeded the F:M = 1.1 scenario, perhaps due to inhibition in the F:M of 1.1 scenario.
Measured initial oxygen demand concentrations followed the same trend as VSS, i.e., increased from the control to the largest F:M ratio (Table 3). Similar to VSS destruction, BOD5 concentrations decreased between initial and final concentrations, with the exception of the control. The oxygen demand increased in the control, likely due to endogenous decay. Unlike VSS destruction, the reduction in oxygen demand from the initial to the final measurement was relatively low for each sample, ranging between 1 and 3%, and showing no trend by F:M ratio. A possible reason for this trend is the conversion of particulate organic matter to soluble organics, which takes place over long timeframes and is often a rate-limiting step in the metabolism of the anaerobic microbial consortia20.
Methane production
Quantities and rates of methane production varied over the range of F:M ratios during the 190-hour study period. Experimental results revealed that higher F:M ratios yielded increased overall volumes of methane (Figure 7). The control, to which no substrate was added, produced a small amount of methane (~72 mL) likely due to the relatively small amount of soluble BOD5 in the sludge and/or endogenous decay. As anticipated, the addition of substrate in other scenarios increased methane production relative to the control. The F:M of 0.3 scenario yielded five times more methane, by volume (~354 mL), than the control. Increasing the F:M ratio to 0.7 yielded 1.6 times more methane (~574 mL) than the F:M of 0.3 scenario. Similarly, increasing the F:M ratio to 1.1 yielded 1.9 times more methane (~1098 mL) than the F:M of 0.7 scenario. Maximum observed volumetric methane production values (Ymax) for each F:M ratio examined are listed in Table 4. The rate of methane produced over time also changed with the F:M ratios examined. As shown in Figure 8, the rate of methane production, as well as the length of time during the study that methane was produced, increased as the F:M increased. For example, in the F:M of 0.3 scenario, there was no observed methane production after 129 h of study (with a max of 354 mL), while the F:M of 1.1 scenario was still producing a small amount of methane at the end of the study. In all scenarios, the rate of methane produced decreased over time due to reduced substrate availability. While there was still abundant oxygen demand available at the end of the study (Table 3), it may not have been in a bioavailable form, or there may have been limited remaining electron acceptor (e.g., carbon dioxide) for the anaerobic microbiota. Last, a comparison of methane produced (mL) per observed VSS destroyed (mg) shows that the values for F:M of 0.3 and 0.7 provided a range of 1.3 to 1.6 mL/mg, while the F:M of 1.1 produced more methane per unit VSS destroyed (3.7 mL/mg) (Table 4). Tchobanoglous et al. (2014) provides typical ranges for gas yield per unit solids destroyed for common feedstocks, to include fats (~1.4 mL/mg), grease (~1.1 mL/mg), and protein (~0.7 mL/mg)8. Mata-Alvarez et al. (2014) reviewed studies co-digesting wastewater sludge with a variety of substrates, and different substrate ratios (e.g., different ratios of WAS and FOG), in bench-scale and pilot-scale bioreactors10. They found that reported methane production per unit VSS destroyed varied substantially with the substrates co-digested, as well as the ratio of substrates, ranging from 0.2 mL to 1.1 mL of biogas per mg VS destroyed. Representative results from this study, especially for F:M of 0.3 and 0.7 compare favorably to results of comparison studies.
Biokinetic parameters
Methane production over time can be used to determine several important biokinetic parameters. These biokinetic parameters can be further leveraged to predict methane production in similar scenarios without the use of the respirometer. The methane production rate constant, k, can be derived using a logarithmic least square fitting to observed respirometer data for each F:M ratio examined (i.e., those shown in Figure 8). A representative logarithmic function for the F:M of 0.3 scenario is y = 93.465ln(X) - 175.91. Here, the value of 93.465 is in units of hours, which must be converted to days and then inversed, giving a k = 0.257. Rate constants (k) and the coefficient of determination (R2) for each F:M ratio examined are found in Table 4.
The rate constant can then be leveraged to determine the yield of methane at any given time for each F:M ratio. The rate of methane produced over time from the organic substrate can be modeled using the following equation [1]21:
(1) 
Integrating the above equation between the limits t = 0 to t = t, gives the following [2]:
(2) 
Where, Y = methane yield at any time [mL]; Ymax = maximum observed methane yield from the respirometer study [mL]; k = methane production rate constant [d-1]; t = time [d]
While the first-order approach used to develop biokinetic parameters presented above provides a very reasonable fit to the experimental data (as indicated by R2 values in Table 4), other studies have reported the use of other models to fit methane production data, to include the Modified Gompertz model, two-substrate model, and the Cone model2.

Figure 1: Food waste blender. Standard blender used to combine food waste. Please click here to view a larger version of this figure.
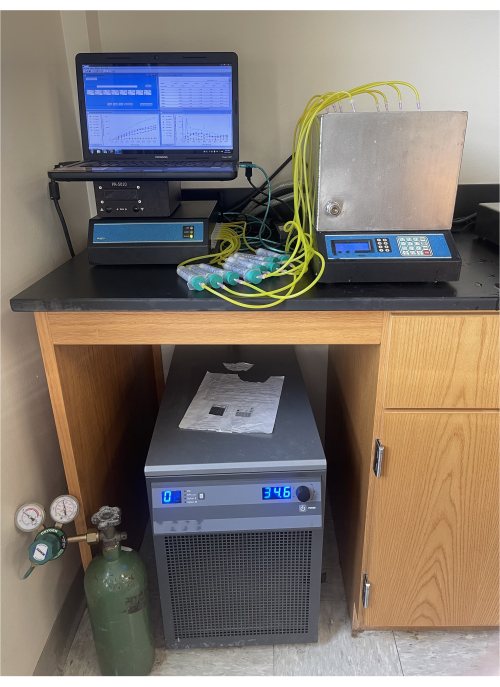
Figure 2: Respirometer. Complete respirometer setup to measure methane production. Please click here to view a larger version of this figure.
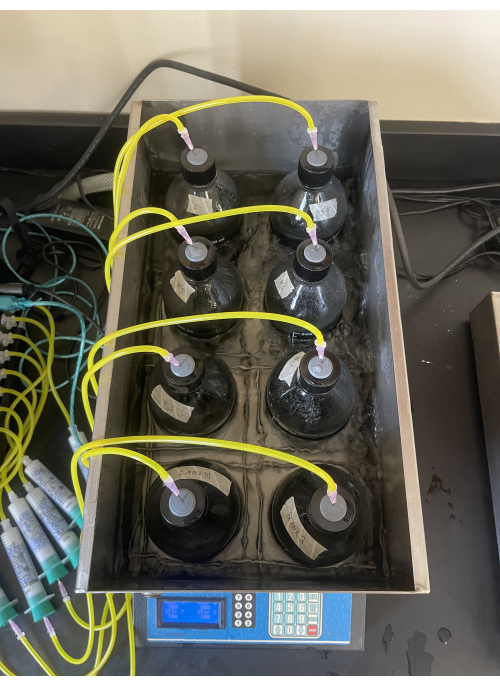
Figure 3: Sample bottle in respirometer chiller. Interior view of respirometer chiller with eight sample bottles. Please click here to view a larger version of this figure.
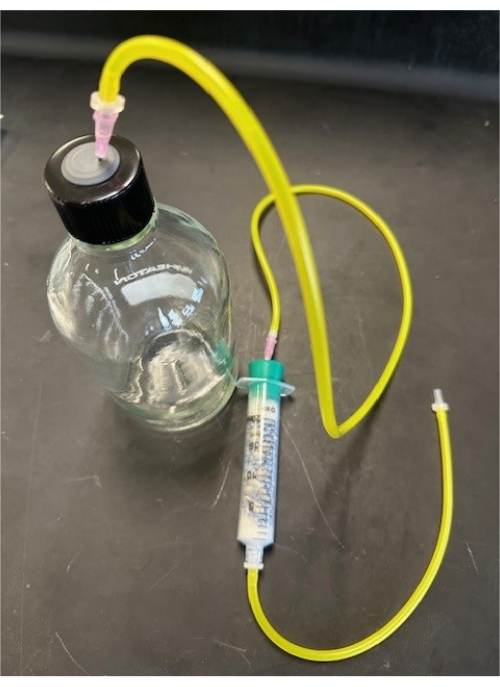
Figure 4: Respirometer scrubber. Close view of respirometer scrubber. Please click here to view a larger version of this figure.
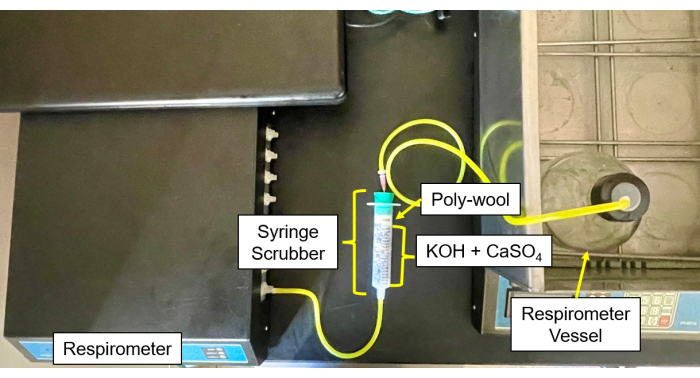
Figure 5: Respirometer scrubber to control module. Respirometer image of the control module and scrubber setup. Please click here to view a larger version of this figure.
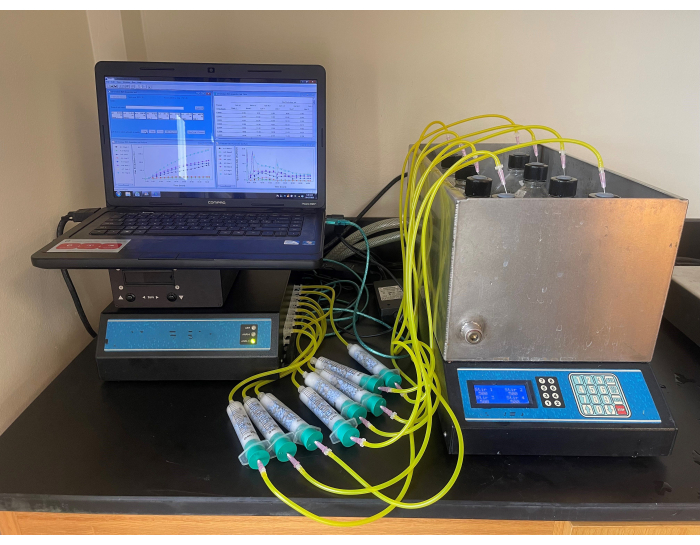
Figure 6: Respirometer scrubber line setup. Close view of scrubber line setup between sample bottles and the respirometer. Please click here to view a larger version of this figure.
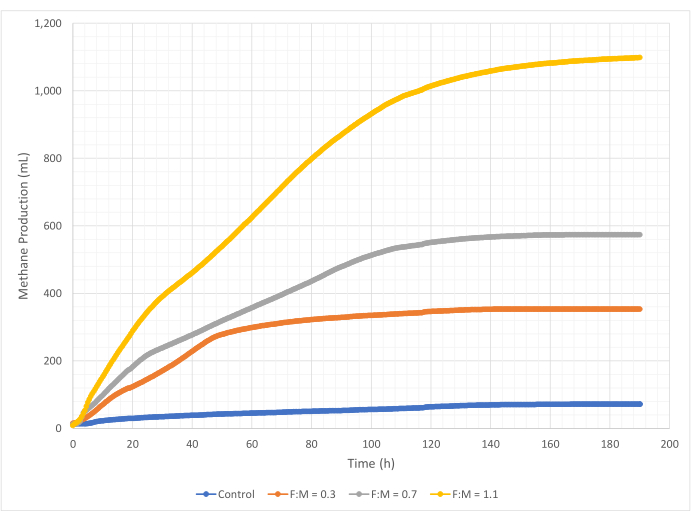
Figure 7: Total methane production using different F:M ratios. Methane production for each F:M (0.3, 0.7, 1.1) is depicted over time (0 h to 190 h). Please click here to view a larger version of this figure.
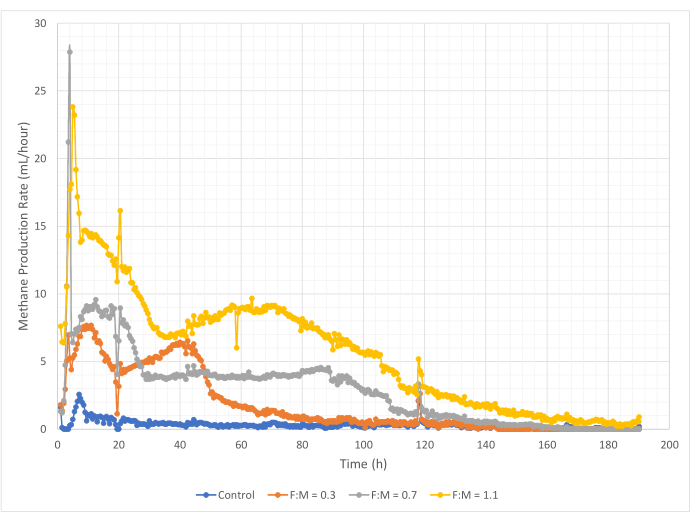
Figure 8: Methane production rate using different F:M ratios. Methane production rate for each F:M (0.3, 0.7, 1.1) is depicted over time (0 h to 190 h). Please click here to view a larger version of this figure.
Table 1: Sample Bottle Constituents with Food-to-Microbe Ratios. Constituent mass, concentration, and volume for each F:M (0.3, 0.7, 1.1) and the blank bottles. Please click here to download this Table.
Table 2: Sample Organic Substrate Composition. Food waste mass and percent composition by food and proportion of carbohydrates, proteins, and fats. Please click here to download this Table.
Table 3: Sample Volatile Suspended Solid and Oxygen Demand Result (± Standard Deviation). VSS and COD for each F:M (0.3, 0.7, 1.1). Please click here to download this Table.
Table 4: Sample Kinetic Parameters. Calculated kinetic parameters based on methane yield. Please click here to download this Table.
Discussion
The methods provided in this protocol can help researchers and practitioners determine the biomethane potential of anaerobically digesting organic waste streams using respirometry. In this protocol, we demonstrate methane generation from co-digestion of a typical food scrap waste stream coupled with WAS from a WWTP over a range of F:M ratios. This protocol adds to the literature by providing a step-by-step respirometry approach for continuous measurement of methane production and determination of biokinetic parameters using first-order kinetic modeling. Several other studies have employed microcosm experiments that measure methane production at discrete points in time10,22, while others have measured methane using flowmeters attached to long-running continuous-flow bench- or pilot-scale bioreactors14,23. Respirometry offers the advantage of measuring methane production on a continuous basis over a variety of experimental conditions. As respirometry experiments do not require the construction of a bioreactor, the experimental conditions can be modified with relative frequency compared to some bench- or pilot-scale experiments. Due to this advantage, respirometry experiments can be used to determine methane production from co-digesting numerous combinations of organic wastes in a relatively short period of time. For example, as a next step to the protocol presented in this study, fats, oils, and grease, which are very dense in chemical energy relative to WAS, could be co-digested with food scraps to quantify likely increases in methane generation over time. The application of this approach can continue to build the body of literature concerning methane generation rates and biokinetic parameters across multiple substrate combinations in co-digestion schemes. Further, in addition to determining optimal substrate combinations, methane production results and biokinetic parameters can be used to inform performance modeling in existing programs, such as those designed for wastewater treatment, or to predict how co-digestion schemes will perform when scaled up from bench or pilot-scale to full-scale24,25.
Additionally, this protocol could be amended to apply a tailored substrate feed for the anaerobic microbial consortium. For example, if a researcher wanted to examine the impacts of providing only carbohydrates or only proteins to anaerobic microbiota, then the feedstock in this protocol could be altered accordingly. Alternatively, if a researcher wanted to test the impact of adding a specific fraction of COD (e.g., only soluble COD, or only particulate COD) or high concentrations of a particular substrate (e.g., acetate, volatile fatty acid, and intermediate product of the anaerobic metabolism) on methane production, a variation of this protocol could be used. An observed best practice when modifying substrate or alternating the F:M of a particular substrate is to maintain the same mass of anaerobic microbiota for each sample while adjusting only the mass of the substrate (mass-to-mass ratios should be employed). In addition to modifying substrates, researchers can use this protocol with other analyses to obtain a better understanding of substrate use and methane production. For example, a researcher could use this protocol in conjunction with microbial community analyses (e.g., 16S rRNA gene sequencing or metagenomics) to better relate community structure to function.
Despite the usefulness of this methodology, there are several limitations. Respirometers and biomethane potential tests are most frequently configured as batch reactors; however, full-scale anaerobic co-digesters are normally operated as continuous flow systems with sludge retention times upwards of 10 days1. Accordingly, the data gleaned from respirometry experiments are useful for estimating methane generation rates and developing biokinetic parameters, but these data should be validated in the field using larger-scale digesters operated over time when feasible.
Additionally, care must be taken in selecting and preparing samples prior to respirometry. Large food scrap particles will skew VSS and COD measurements and can provide inaccurate results. If food scrap waste is used as a substrate, the blend should be well macerated and free of large food particles - an approach akin to maceration at food scrap receiving pits at full-scale digesters. Dilution with DI water can help with the blending process and is similar to the addition of water commonly used when food scraps are macerated at a larger scale. However, every effort should be taken to ensure that dilutions are properly measured and that the target moisture content is achieved. Dilution can readily be a source of error, especially if inexperienced students are executing this protocol.
As the microbial consortia existing in co-digestion contain obligate anaerobes, special care must be taken to eliminate (or greatly reduce) exposure to oxygen during the transfer and sample preparation processes. Oxygen can be removed from sample bottles via nitrogen flushing. Further, if available, the work of transferring anaerobic culture between collection bottles and respirometer sample bottles should be conducted in an anaerobic chamber. As the respirometer provides consistent results (methane production volumes and rates), any deviation from expected results, e.g., an unviable microbial consortium, can be easily identified towards the beginning of the test. The use of a duplicate or triplicate sample can further help identify faulty tests.
Disclosures
The authors have nothing to disclose.
Acknowledgements
We thank Dr. Jim Young of Respirometer Systems and Applications for the discussion concerning the development of this protocol.
Materials
| Name | Company | Catalog Number | Comments |
| 103 °C Oven Isotemp | Fisher Scientific | 13-247-737F | Model: 737F, Force Air Oven |
| 550 °C Vulcan Oven | Neytech (Manufacturer) / Cole Palmer (Vendor) | 9493308 | Model: 3-550 |
| Aerobic/Anaerobic Respirometer | Respirometer System and Applications (RSA) | PF-8000 | Model: PF-8000 |
| Analytical Balance | Mettler Toledo | 30029075 | Model: ME204E, Detection Limit: 0.1 mg |
| Smoothie Blender with 56 oz Plastic Jar | Hamilton Beach | 50190F | Model: 50190F |
| COD Vials TNT Plus Vial Test | HACH | TNT821 | TNT 821, 3–150 mg/L COD |
| COD Vials TNT Plus Vial Test | HACH | TNT822 | TNT 822, 20–1500 mg/L COD |
| Dessicator | SP Bel-Art | 942070050 | Model: SP Scienceware |
| Dionized Water System | Milli-Q | ZIQ7010T0C | IQ 7010 Pure & Ultrapure Water Purification System |
| Anhydrous CaSO4 | W.A. Hammond Drierite Company | 13001 | 8 Mesh, 1 lb |
| Glass Fiber Filters | Whatman (Manufacturer) / Cole-Parmer (Vendor) | 1827-150 | Model: 934-AH |
| Heat Digestor Block | HACH | DRB200-02 | DRB 200 |
| Hot Plate Stirrer | Corning | 6795-620D | Model: PC-620D |
| Industrial-Grade Nitrogen (Compressed Cylinder) | Air Gas | NI UHP300 | 300 cubic feet |
| Pellets (KOH) | Fisher Scientific | AC134062500 | 500 g |
| pH Meter | Fisher Scientific | 13-636-AP115 | AP115, Accumet pH meter |
| UV Spectrophotometer | HACH | LPV400.99.00012 | DR 3900 |
| Vaccum Pump | GAST | 1HAB-25-M100X |
References
- Mainardis, M., Buttazzoni, M., Cottes, M., Moretti, A., Goi, D. Respirometry tests in wastewater treatment: Why and how? A critical review. Sci Total Environ. 793, 148607 (2021).
- Pan, Y., et al. Synergistic effect and biodegradation kinetics of sewage sludge and food waste mesophilic anaerobic co-digestion and the underlying stimulation mechanisms. Fuel. 253, 40-49 (2019).
- Argiz, L., et al. Assessment of a fast method to predict the biochemical methane potential based on biodegradable COD obtained by fractionation respirometric tests. J Environ Manage. 269, 110695 (2020).
- Carucci, A., et al. Aerobic storage by activated sludge on real wastewater. Water Res. 35 (16), 3833-3844 (2001).
- McCarty, P. L., Bae, J., Kim, J. Domestic wastewater treatment as a net energy producer-Can this be achieved. Environ Sci Technol. 45 (17), 7100-7106 (2011).
- McCarty, P. The development of anaerobic treatment and its future. Water Sci Technol. 44 (8), 149-156 (2001).
- From farm to kitchen: The environmental impacts of U.S. food waste Part 1. United States Environmental Protection Agency Available from: https://www.epa.gov/system/files/documents/2021-11/from-farm-to-kitchen-the-environmental-impacts-of-u.s.-food-waste_508-tagged.pdf (2021)
- Tchobanoglous, G., Burton, F. L., Stensel, H. D. . WastewaterEngineering:TreatmentandReuse. 5th ed. , (2014).
- Pfluger, A., et al. Anaerobic digestion and biogas beneficial use at municipal wastewater treatment facilities in Colorado: A case study examining barriers to widespread implementation. J Clean Prod. 206, 97-107 (2019).
- Mata-Alvarez, J., Dosta, J., Romero-Güiza, M. S., Fonoll, X., Peces, M., Astals, S. A critical review on anaerobic co-digestion achievements between 2010 and 2013. Renew Sust Energ Rev. 36, 412-427 (2014).
- Pfluger, A. R., Hahn, M. J., Hering, A. S., Munakata-Marr, J., Figueroa, L. Statistical exposé of a multiple-compartment anaerobic reactor treating domestic wastewater. Water Environ Res. 90 (6), 530-542 (2018).
- Razaviarani, V., Buchanan, I. D. Calibration of the Anaerobic Digestion Model No. 1 (ADM1) for steady-state anaerobic co-digestion of municipal wastewater sludge with restaurant grease trap waste. Chem Eng J. 266, 91-99 (2015).
- Zhu, H., et al. Biohydrogen production by anaerobic co-digestion of municipal food waste and sewage sludges. Int J Hydrog Energy. 33 (14), 3651-3659 (2008).
- Serna-García, R., Ruiz-Barriga, P., Noriega-Hevia, G., Serralta, J., Pachés, M., Bouzas, A. Maximising resource recovery from wastewater grown microalgae and primary sludge in an anaerobic membrane co-digestion pilot plant coupled to a composting process. J Environ Manage. 281, 111890 (2021).
- Gossett, J. M., Belser, R. L. Anaerobic digestion of waste activated sludge. J Environ. 108 (6), 1101-1120 (1982).
- Yi, H., Han, Y., Zhuo, Y. Effect of combined pretreatment of waste activated sludge for anaerobic digestion process. Procedia Environ Sci. 18, 716-721 (2013).
- Nah, I. W., Kang, Y. W., Hwang, K. Y., Song, W. K. Mechanical pretreatment of waste activated sludge for anaerobic digestion process. Water Res. 34 (8), 2362-2368 (2000).
- American Public Health Association. . Standard Methods for the Examination of Water and Wastewater. Vol. 10. American Public Health Association. , (2012).
- Food Data Central. US Department of Agriculture Available from: https://fdc.nal.usda.gov/ (2024)
- Vanzin, G., Pfluger, A., Almstrand, R., Figueroa, L., Munakata-Marr, J. Succession of founding microbiota in an anaerobic baffled bioreactor treating low-temperature raw domestic wastewater. Environ Sci Water Res Technol. 8 (4), 792-806 (2022).
- Negi, S., Dhar, H., Hussain, A., Kumar, S. Biomethanation potential for co-digestion of municipal solid waste and rice straw: a batch study. Bioresour Technol. 254, 139-144 (2018).
- Rostkowski, K. H., Pfluger, A. R., Criddle, C. S. Stoichiometry and kinetics of the PHB-producing Type II methanotrophs Methylosinus trichosporium OB3b and Methylocystis parvus OBBP. Bioresour Technol. 132, 71-77 (2014).
- Pfluger, A., Vanzin, G., Munakata-Marr, J., Figueroa, L. An anaerobic hybrid bioreactor for biologically enhanced primary treatment of domestic wastewater under low temperatures. Environ Sci Water Res Technol. 4 (11), 1851-1866 (2018).
- Callahan, J. L., Pfluger, A. R., Figueroa, L. A., Munakata-Marr, J. BioWin® modeling of anaerobic sludge blanket treatment of domestic wastewater. Bioresour Technol Rep. 20, 101231 (2022).
- Linvill, C., Butkus, M., Bennett, E., Wait, M., Pytlar, A., Pfluger, A. Energy balances for proposed complete full-scale anaerobic wastewater treatment facilities. Environ Eng Sci. 40 (11), 482-493 (2023).
Reprints and Permissions
Request permission to reuse the text or figures of this JoVE article
Request PermissionThis article has been published
Video Coming Soon
Copyright © 2025 MyJoVE Corporation. All rights reserved