
Aby wyświetlić tę treść, wymagana jest subskrypcja JoVE. Zaloguj się lub rozpocznij bezpłatny okres próbny.
Method Article
DetectSyn: A Rapid, Unbiased Fluorescent Method to Detect Changes in Synapse Density
W tym Artykule
Podsumowanie
DetectSyn is an unbiased, rapid fluorescent assay that measures changes in relative synapse (pre- and postsynaptic engagement) number across treatments or disease states. This technique utilizes a proximity ligation technique that can be used both in cultured neurons and fixed tissue.
Streszczenie
Synapses are the site of communication between neurons. Neuronal circuit strength is related to synaptic density, and the breakdown of synapses is characteristic of disease states like major depressive disorder (MDD) and Alzheimer's disease. Traditional techniques to investigate synapse numbers include genetic expression of fluorescent markers (e.g., green fluorescent protein (GFP)), dyes that fill a neuron (e.g., carbocyanine dye, DiI), and immunofluorescent detection of spine markers (e.g., postsynaptic density 95 (PSD95)). A major caveat to these proxy techniques is that they only identify postsynaptic changes. Yet, a synapse is a connection between a presynaptic terminal and a postsynaptic spine. The gold standard for measuring synapse formation/elimination requires time-consuming electron microscopy or array tomography techniques. These techniques require specialized training and costly equipment. Further, only a limited number of neurons can be assessed and are used to represent changes to an entire brain region. DetectSyn is a rapid fluorescent technique that identifies changes to synapse formation or elimination due to a disease state or drug activity. DetectSyn utilizes a rapid proximity ligation assay to detect juxtaposed pre- and postsynaptic proteins and standard fluorescent microscopy, a technique readily available to most laboratories. Fluorescent detection of the resulting puncta allows for quick and unbiased analysis of experiments. DetectSyn provides more representative results than electron microscopy because larger areas can be analyzed than a limited number of fluorescent neurons. Moreover, DetectSyn works for in vitro cultured neurons and fixed tissue slices. Finally, a method is provided to analyze the data collected from this technique. Overall, DetectSyn offers a procedure for detecting relative changes in synapse density across treatments or disease states and is more accessible than traditional techniques.
Wprowadzenie
Synapses are the fundamental unit of communication between neurons1. Many synapses between neurons within the same regions give rise to circuits that mediate behavior2. Synapses consist of a presynaptic terminal from one neuron that releases neurotransmitters or neuropeptides that relay information to postsynaptic receptors of another neuron. The summation of presynaptic signals determines whether the postsynaptic neuron will fire an action potential and propagate the message to other neurons.
Synaptopathology, the break down of synapses, arises in diseases and disorders marked by decreased neural volume, like Alzheimer's disease and major depressive disorder, resulting in circuits that no longer optimally perform3,4,5. Restoring synapse density likely underlies the efficacy of potential treatments for these disorders. For example, it was recently demonstrated that increasing synapses underlies the behavioral efficacy of rapid antidepressants6. To rapidly screen possible synaptopathology treatments, researchers require techniques that quickly identify changes to synapse numbers.
Current methodologies are either time-consuming and expensive (electron microscopy, array tomography), or they only examine postsynaptic changes without incorporating presynaptic engagement (spine analyses, immunofluorescence/colocalization). Dyes like DiI or fluorescent proteins like GFP help visualize neurons and characterize postsynaptic spines. However, spine analysis uses researcher-defined ratios to determine morphology, which can decrease reproducibility7. Further, how the different spine classes relate to functional synapses is still being uncovered8. Spine formation can be transient and may reflect postsynaptic plasticity, but these spines could be eliminated before stabilizing into a synapse with a presynaptic neuron9.
Colocalization provides a better proxy for synapses than spine analysis because one can immunostain for presynaptic and postsynaptic proteins. However, synaptic proteins may yield low colocalization values because the proteins are juxtaposed and may not consistently overlap. Thus, because the proteins are not wholly superimposed, colocalization techniques may not accurately measure changes to synapse formation due to this missing information. Finally, although both electron microscopy (EM) and array tomography provide high-resolution images of synapses, they are time-consuming. EM further requires specialized equipment, and researchers are limited to small volumes of tissue for any given experiment. While array tomography elegantly provides the ability to screen for many proteins on ultrathin sections and can be combined with EM10, this technique may be too labor-intensive and beyond the scope of experiments that need to scan rapidly for changes to synapse formation.
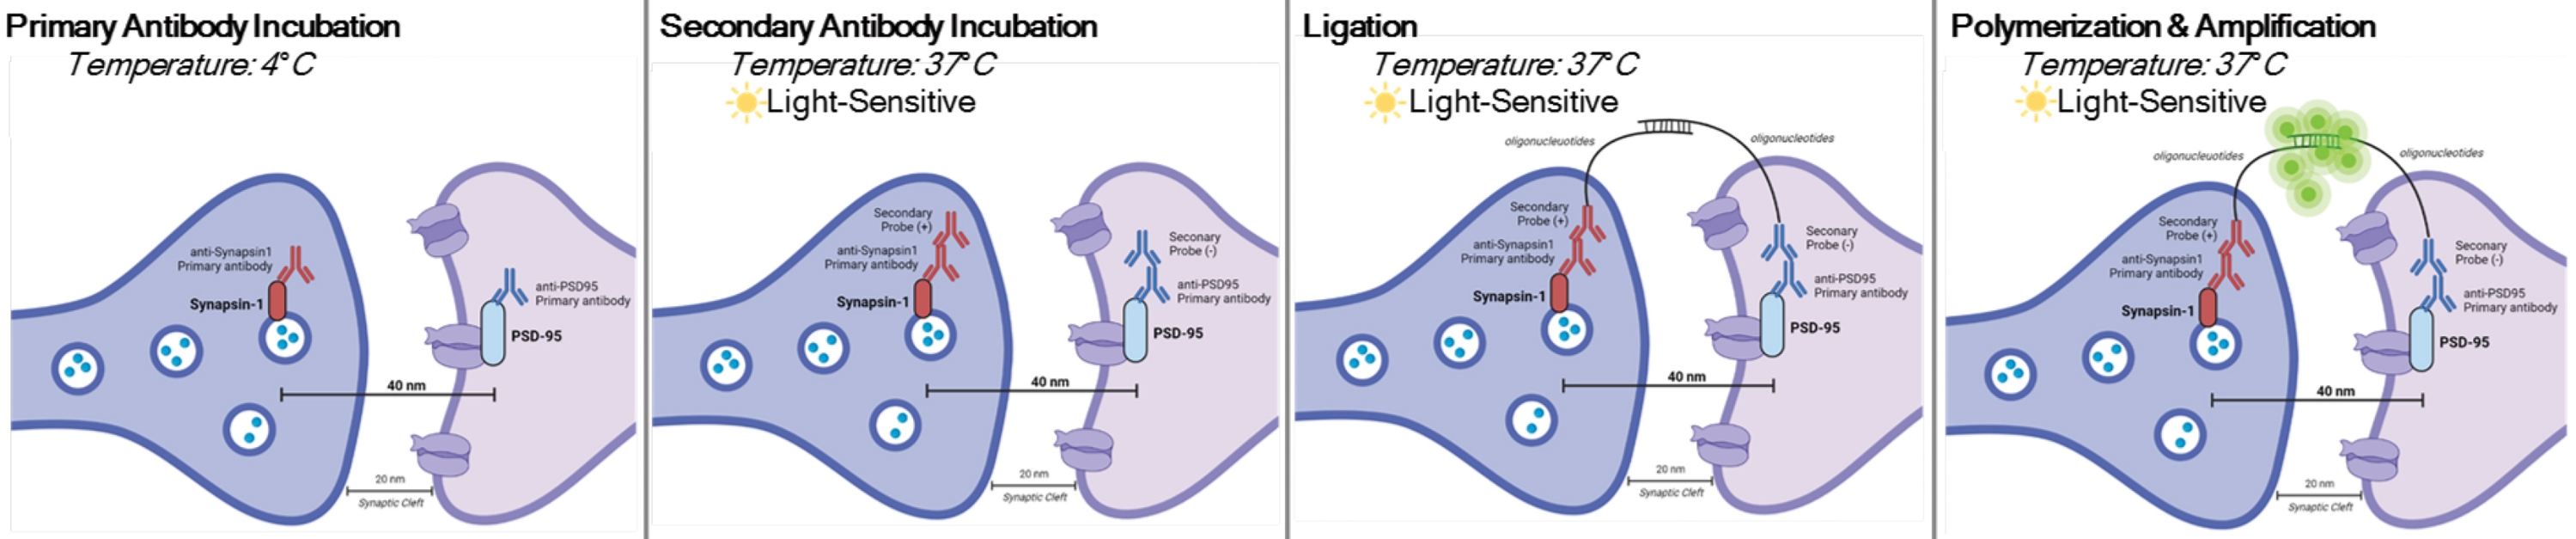
DetectSyn is a specific application of the Duolink Proximity Ligation Assay. The PLA assay allows for the general detection of protein-protein interactions. DetectSyn bridges proxy postsynaptic measures by amplifying a fluorescent signal emitted by tagged pre- and postsynaptic proteins within 40 nm of each other. If the synaptic proteins are within 40 nm, as within a synaptic cleft, then the secondary antibodies, which contain DNA probes, will hybridize into circular DNA. This hybridized circular DNA expresses a fluorescent probe, which is then amplified and detected with standard fluorescent microscopy techniques (see Figure 1). Crucially, unlike EM and array tomography, this technique does not require specialized equipment and takes about the same amount of time as standard immunohistochemistry. The accessibility of this technique, thus, enables investigators outside of research-intensive institutions to participate in synaptopathology research. Further, this technique can examine changes to synaptic density in multiple brain regions within a single experiment, offering a more holistic representation of synaptic changes due to disease or treatment.
Protokół
Isolation of cells and tissue from animals was in accordance with the National Institutes of Health's Guide for the Care and Use of Laboratory Animals and approved by the Wake Forest Institutional Animal Care and Use Committee
NOTE: This protocol is used on samples already treated and fixed per specific experimental paradigms and requirements. For demonstration purposes, synapse formation due to rapid antidepressant treatment is used to highlight this synapse detection technique6. Neurons previously cultured on coverslips, treated, fixed in 4% paraformaldehyde (PFA), and stored in 1x phosphate-buffered saline (PBS) will be used to highlight the in vitro procedures. Previously sliced hippocampal tissue (25 µm thick) from mice treated, transcardially perfused with ice-cold PBS and 4% PFA, and then stored in cryoprotectant will be used to highlight the slice procedures. Please see11,12 for more information about how to culture neurons or transcardially perfuse rodents. See Figure 1 for a graphical representation of this procedure.

Figure 1: Graphical representation of DetectSyn assay. After permeabilizing cell membranes, primary antibodies for Synapsin1 and PSD95 bind to these synaptic proteins. Secondaries with oligonucleotide tags then bind to the primary antibodies. If Synapsin1 and PSD95 are within 40 nm, as at a synapse, then the oligonucleotides interact, and a fluorescent tag is amplified. This fluorescent signal can then be imaged via standard microscopy and analyzed. Please click here to view a larger version of this figure.
1. Rinse samples
- Rinse the samples with 500 µL of 1x PBS + 0.75% glycine for 5 min 3 times with gentle agitation on an orbital shaker to remove residual PFA or cryoprotectant.
2. Block and permeabilize samples
- Prepare blocking and permeabilization solution (10% normal donkey serum, 0.25% Tween 20) in 1x PBS. Prepare enough to use for blocking, primary, and secondary incubations.
- To samples (e.g., coverslips or free-floating slices) in 24 well plates, add 500 µL of blocking and permeabilization solution. Ensure each well contains a different sample and is appropriately labeled to prevent samples from being switched.
- Incubate the samples at room temperature (RT) for 60 min for cultured cells or 2 h for sliced tissue. Use an orbital shaker for gentle agitation.
3. Incubate samples in primary antibodies
- Prepare primary antibodies in blocking buffer:
- Prepare Postsynaptic density 95 (PSD95; 1:500, rabbit polyclonal), Synapsin1 (1:500, mouse monoclonal), MAP2 (1:400, chicken polyclonal)
- Prepare a negative control aliquot that omits one of the synaptic pairs (e.g., without PSD95)
- Carefully remove the blocking solution with a plastic Pasteur pipette. Try to remove as much as possible without disturbing the cells or tearing tissue.
- For cultured cells:
- Line a large plastic petri dish with parafilm. Carefully transfer coverslips to the parafilm using forceps.
- Carefully add 60 µL of the primary antibody solution to the top of the coverslips. Make sure not to spill the primary antibody solution over the side of the coverslip.
- To provide humidity and prevent samples from drying out during the incubation period, add ultrapure water to a smaller Petri dish and carefully arrange the small Petri dish around the coverslips.
- Cover the large Petri dish and incubate cultured cells for 1 h at RT.
- For sliced tissue:
- Carefully add 250 µL of the primary antibody solution to free-floating slices in a 24 well plate.
- Cover the plate and incubate the tissue overnight at 4 °C with gentle agitation on an orbital shaker.
4. Wash samples, then incubate in secondary antibodies
- Prepare secondary antibodies in the blocking buffer:
- Prepare Donkey anti-mouse (1:5), donkey anti-rabbit (1:5), donkey anti-chicken (1:400).
- At this step, additional technical controls can be obtained by preparing a secondary aliquot that omits either the anti-mouse or anti-rabbit secondary.
- For cultured cells:
- Using forceps, carefully tap off the primary solution from coverslips onto a paper towel
- Using forceps, carefully transfer the coverslips back to their original 24 well plate filled with 500 µL of 1x PBS.
- For sliced tissue:
- Carefully remove the primary antibody solution with a plastic Pasteur pipette. Try to remove as much as possible without tearing tissue.
- Add 500 µL of 1x PBS
- Wash the samples for 10 min 3 times in 1x PBS with gentle agitation on an orbital shaker. During this time, bring all wash buffers to RT.
- During this time, change the parafilm in the large Petri dish
- For cultured cells:
- Using forceps, carefully transfer the coverslips back to the parafilmed large Petri dish
- Carefully add 40 µL of the secondary antibody solution to the top of the coverslips. Make sure not to spill the secondary antibody solution over the side of the coverslip.
- If needed, add more ultrapure water to a smaller petri dish and carefully arrange the small petri dish around coverslips.
- Cover the large Petri dish
- For sliced tissue:
- Carefully add 250 µL of the secondary antibody solution to free-floating slices in a 24 well plate.
- Cover the plate
NOTE: From here on, protect samples from light by wrapping the tops of the plates with foil.
- Incubate the samples at 37 °C for 1 h
5. Ligation
- Mix the ligation stock 1:5 in molecular-grade water.
- As in section 4, carefully transfer the coverslips and remove the secondary mix from the sliced tissue.
- Wash the samples in 500 µL of wash buffer A
- For cultured cells, wash 2 times for 5 min. For sliced tissue, wash 2 times for 10 min. Use gentle agitation on an orbital shaker for both.
- During this time, change the parafilm in the large Petri dish
- While keeping the ligase on a cold block, dilute the ligase 1:40 in the ligation stock from step 5.1. Perform this dilution immediately before adding the ligase to the samples.
- As in section 4, remove as much of the wash buffer A as possible from samples before adding the ligase.
- For cultured cells: Transfer coverslips back to the parafilmed Petri dish. Add 40 µL of the ligation mix to coverslips, arrange small water-filled Petri dishes around the coverslips, and cover the large Petri dish.
- For sliced tissue: Add 250 µL of the ligation mix from Step 5.4 to each well and cover the plate.
- Incubate the samples for 30 min at 37 °C.
6. Amplification
- Mix the amplification stock 1:5 in molecular-grade water.
- As in section 4, carefully transfer the coverslips and remove the ligation mix from the sliced tissue.
- Wash samples in 500 µL of wash buffer A
- For cultured cells, wash 2 times for 2 min. For sliced tissue, wash 2 times for 10 min. Use gentle agitation on an orbital shaker for both.
- During this time, change the parafilm in the large Petri dish
- Perform this dilution immediately before adding the polymerase to samples. While keeping the polymerase on a cold block, dilute polymerase
- For cultured cells, dilute polymerase 1:80 in the amplification stock from step 6.1.
- For sliced tissue, dilute polymerase 1:40 in the amplification stock from step 6.1.
- As in step 4, remove as much of the wash buffer A as possible from samples before adding the polymerase.
- For cultured cells: Transfer the coverslips back to the parafilmed Petri dish. Add 40 µL of the amplification mix from Step 6.4.1 to coverslips, arrange small water-filled Petri dishes around the coverslips, and cover the large Petri dish. Incubate the samples for 100 min at 37 °C.
- For sliced tissue: Add 250 µL of the amplification mix from Step 6.4.2 to each well and cover the plate. Incubate the samples for 2 h at 37 °C.
NOTE: During this time, prepare and label slides.
7. Mounting
- As in Step 4, carefully transfer the coverslips and remove the amplification mix from the sliced tissue.
- Wash the samples in 500 µL of wash buffer B 2 times for 10 min with gentle agitation on an orbital shaker.
- Wash the samples in 500 µL of 1% wash buffer B for 1 min with gentle agitation on an orbital shaker.
- For cultured cells:
- Drop 3 µL of mounting media onto a slide
- Tap off excess wash buffer from the coverslip and then place the coverslip (with cells facing down) into the mounting media. Seal the sides with a small amount of clear nail polish to seal the coverslip in place.
- For sliced tissue:
- Carefully transfer a tissue slice to the prepared slide and arrange it, so the slice is lying flat. Drop between 5-10 µL of mounting media (amount will depend on the size of the slice) onto tissue slice
- Carefully place a glass coverslip over tissue slice and seal with a small amount of clear nail polish along the edge to seal the coverslip in place.
- Wait at least 15 min before analyzing under the microscope, or store at -20 °C.
8. Obtain digital images with a confocal microscope
- Optimize the acquisition settings (e.g., laser power, gain, offset) across samples from all treatments. Ensure that the optimization includes decreasing background noise and enhancing the signal without oversaturating the intensity of the fluorescent signals. Once settings are determined, apply the same acquisition settings across all images obtained.
NOTE: The following acquisition details can be used with a Nikon A1 confocal microscope and the Nikon NIS AR Elements software. - Set the slide with sample on the stage and find the focal plane for the sample using DAPI through the eyepiece.
- Turn off the eye port by clicking on Eye port and choose an optical configuration button to adjust the settings.
- Adjust the gain, offset, and laser power for each fluorescent channel to decrease background noise and enhance the fluorescent signal. Make sure the fluorescent signal does not become oversaturated as mentioned in steps 8.5-8.6.
- Monitor oversaturation using a pseudocolor for the fluorescent signal. At the bottom of the live image, right-click the tab labeled with the fluorescent channel currently being used.
- Next, choose Channel Coloring and pick a pseudocolor like Rainbow Dark to visualize the fluorescence intensity in a heat-map-like pseudocolor. In Rainbow Dark, cooler colors indicate less fluorescent intensity, and hotter colors indicate more fluorescent intensity.
- Once all fluorescent channels are optimized, right-click on the optical configuration button previously chosen and choose Assign Current Camera Setting for this button.
- Verify that the chosen settings are sufficient for a random sample from each treatment group. If the chosen settings oversaturate any of these samples, repeat step 8.4 to eliminate the oversaturation.
- For cultured neurons, follow steps 8.10-8.16.
- Using the eye-port, search for a neuron with dendrites that have minimal overlap with other dendrites.
- Turn off the eye port and use the DAPI channel to visualize the cell body of the chosen neuron. Double-click on the center of the soma to center the neuron in the middle of the field of view.
- Using the MAP2 channel, find the best plane of focus for the MAP2 signal with live scanning.
- Under the ND Acquisition tab, click on Save to File and choose a file to save the image into under Browse. Then, input the filename.
- Under the Z tab, select the Symmetric Mode Defined by Range option. Set the focus to the best MAP2 plane and click on the Relative button to set this focal plane as the middle of the z-stack.
- Set the range to 5 µm with 1 µm steps, and make sure to check Close Active Shutter During Z Movement. Under the Wavelength tab, select the name of the optical button with the previously configured acquisition settings under Optical Conf. Then, click on Run Now.
- Repeat steps 8.1.10-8.1.15 for about 10 neurons per coverslip/treatment.
- For sliced tissue, follow steps 8.18-8.22.
- Using the eye-port, search for the region of interest. For example, locate CA1 of the hippocampus.
- Turn off the eye-port and use the MAP2 channel to find the best plane of focus for the MAP2 signal with live scanning.
- Under the Acquire menu, choose Scan Large Image. Next, select the optical button's name with the previously configured acquisition settings under the Capturing panel from the panel that opens. Also, ensure to select the correct objective in this panel.
- Under the Area panel and the eyepiece, use the arrow keys to set the boundaries of the region of interest. Next, click on Save Large Image to File and create a save path filename for the image.
- Under the Setup panel, make sure Multichannel Capture is checked, and then choose the name of the optical button with the previously configured acquisition settings under Optical Conf.
NOTE: A z-stack for a large image is possible but will increase the scan time.
9. Analysis
- Similar to acquisition settings, use samples from all treatments to optimize threshold settings. Ensure that the threshold optimization focuses on decreasing background noise and enhancing the signal without oversaturating the intensity of the fluorescent signals. Once these settings are determined, apply the same threshold settings across all images used for analysis as described in steps 9.2-9.3.
- In ImageJ, the threshold option is located under the menu Image > Adjust > Threshold. Choose the Dark Background option if the image has a dark background.
- Next, adjust the upper and lower bounds of the threshold per previously determined optimized threshold settings, then click on Apply.
- For cultured cells, use the MAP2 channel and a freehand region of interest (ROI) tool to draw an ROI for each neuron, including dendrites and soma. For sliced tissue, draw a freehand ROI within the slice image that encapsulates the area of interest (e.g., stratum radiatum of the CA1 within the hippocampus).
- Obtain the area of the ROI. In ImageJ, measure the area under the menu Analyze > Measure.
- Detect the number of puncta within each ROI using an automatic detection tool like Particle Analysis in ImageJ following steps 9.7-9.9.
- Find the Particle Analysis option under the menu Analyze > Analyze Particles. First, define the puncta size diameter, typically 0.1-3 µm2.
- Next, choose the Overlay Masks option from the Show drop-down menu and check the Display Results option. Then, click on OK.
- If puncta are not detected with the diameter range chosen, adjust the range until all puncta are detected with this analysis. Make sure to use the same Particle Analysis settings for all images.
- Divide the number of puncta by the area of an individual region of interest by following steps 9.11-9.13.
- Copy and paste the results for each image from the Results pop-up from ImageJ into a spreadsheet.
- First, identify which file and sample the data were obtained from. Then, divide the area of the ROI by the number of puncta.
- Then, clear the data from the Results pop-up, and repeat steps 9.2-9.12.
- Normalize results to control samples: Average the results (number of puncta/ROI area) for the control samples. Then, divide the obtained results of all samples by the average of the control to obtain the normalized results. The new average of the control samples should be equal to 1.
Wyniki
Data modified from Heaney et al.6 are presented to demonstrate an experiment where increased synapse formation is expected (please see6 for more information and a more in-depth discussion of the mechanism). Previously, it was demonstrated that rapid antidepressants require activation of the inhibitory metabotropic receptor, GABAB (gamma-aminobutyric acid subtype B), to be effective13. Further, previous data indicated that rapid antidepressants increa...
Dyskusje
DetectSyn is a rapid assay that uses a proximity ligation assay to detect proteins within 40 nm of each other, which allows for the detection of synapse formation. This technique improves current fluorescent assays, which serve only as proxy measurements for synapse formation. DetectSyn detects quantifiable changes in synaptic proteins localized within 40 nm, i.e., within the synaptic cleft, of each other. Further, DetectSyn is more cost-effective and takes less time than techniques, like electron microscopy and array to...
Ujawnienia
The authors report no conflict of interest.
Podziękowania
This work was supported by National Institutes of Health NINDS R01 NS105005 (KRG) and NS105005-03S1 (KRG), Department of Defense USAMRMC W81XWH-14-1-0061 (KRG), NIAAA R01AA016852, NIAAA T32AA007565 (CFH), and a grant from FRAXA Research (CFH) and the Alzheimer's Association, AARG-NTF-21-852843 (KRG), AARF-19-614794-RAPID (KRG).
Materiały
| Name | Company | Catalog Number | Comments |
| 10x PBS | Fisher Scientific | BP39920 | PBS made in house works, as well. |
| 24 well plates | Fisher Scientific | FB012929 | For tissue slices, pre-sterilized plates may be unnecessary. |
| 50 mL conical tubes | Fisher Scientific | 14-432-22 | |
| Aluminium foil | Fisher Scientific | 15-078-290 | |
| Chicken anti-MAP2 antibody | Abcam | ab5392 | |
| Clear nail polish | Fisher Scientific | NC1849418 | Other clear nail polish works, as well. |
| Cold block | Fisher Scientific | 13131012 | |
| Computer workstation | HP | ||
| Confocal or fluorescent microscope | Nikon | A1R HD25 | |
| Donkey anti-chicken FITC | Fisher Scientific | SA1-72000 | |
| Duolink donkey anti-Mouse PLUS | Sigma | DUO92001 | |
| Duolink donkey anti-Rabbit MINUS | Sigma | DUO92005 | |
| Duolink In Situ Detection Reagents Far Red | Sigma | DUO92013 | Contains ligation stock, amplification stock, ligase, and polymerase. |
| Duolink In Situ Mounting Medium with DAPI | Sigma | DUO82040 | |
| Duolink In Situ Wash Buffers, Fluorescence | Sigma | DUO82049 | Contains Wash Buffer A and Wash Buffer B; dilute Wash Buffer B to 1% in diH20 for 1% Wash Buffer B. |
| Fine-tipped paintbrush | Fisher Scientific | NC9691026 | Sable hair, size 00 or 000, can also find at craft stores |
| Fisherbrand Cover Glasses: Rectangles | Fisher Scientific | 12545MP | Cover glass is unnecessary for cultured neurons already on glass coverslips. |
| Fisherbrand Superfrost Plus Microscope Slides | Fisher Scientific | 1255015 | For cultured neurons already on glass coverslips, Superfrost slides may be unnecessary. |
| Freezer, -20°C | VWR | 76449-108 | |
| Glass coverslips | Fisher Scientific | 125480 | |
| Glycine | Fisher Scientific | BP381-1 | |
| Image processing software | e.g. NIS Elements, ImageJ | ||
| Incubator | Fisher Scientific | 15-015-2633 | |
| Large petri dish, 100mm | Fisher Scientific | FB0875712 | |
| Molecular grade water | Fisher Scientific | BP24701 | |
| Mouse anti-Synapsin1 antibody | Synaptic Systems | 106-011 | |
| Normal donkey serum | Jackson ImmunoResearch | 017-000-121 | |
| Orbital shaker | Fisher Scientific | 02-106-1013 | |
| Parafilm | Fisher Scientific | 13-374-10 | |
| Pipette tips | Fisher Scientific | 02-707-025 | |
| Pipettes | Fisher Scientific | 14-388-100 | Working volumes range from 3 µL to 500 µL |
| Plastic pasteur pipette | Fisher Scientific | 02-708-006 | |
| Precision tweezers/foreceps | Fisher Scientific | 12-000-122 | |
| Rabbit anti-PSD95 antibody | Abcam | ab18258 | Other antibody pairs may work, as well, with optimization. |
| Refrigerator | VWR | 76470-402 | |
| Small petri dish, 60 mm | Fisher Scientific | FB0875713A | |
| Timer | Fisher Scientific | 14-649-17 | |
| Tween 20 | Fisher Scientific | BP337-100 |
Odniesienia
- Südhof, T. C. Towards an understanding of synapse formation. Neuron. 100 (2), 276-293 (2018).
- Bliss, T. V., Collingridge, G. L. A synaptic model of memory: long-term potentiation in the hippocampus. Nature. 361 (6407), 31-39 (1993).
- Heaney, C. F., Raab-Graham, K. F. Dysregulated protein synthesis in major depressive disorder. The Oxford Handbook of Neuronal Protein Synthesis. , 510-532 (2018).
- Masliah, E., Crews, L., Hansen, L. Synaptic remodeling during aging and in Alzheimer's disease. Journal of Alzheimer's Disease. 9, 91-99 (2006).
- van Spronsen, M., Hoogenraad, C. C. Synapse pathology in psychiatric and neurologic disease. Current Neurology and Neuroscience Reports. 10 (3), 207-214 (2010).
- Heaney, C. F., Namjoshi, S. V., Uneri, A., Bach, E. C., Weiner, J. L., Raab-Graham, K. F. Role of FMRP in rapid antidepressant effects and synapse regulation. Molecular Psychiatry. 26 (6), 2350-2362 (2021).
- Pchitskaya, E., Bezprozvanny, I. Dendritic spines shape analysis-Classification or clusterization? Perspective. Frontiers in Synaptic Neuroscience. 12, 31 (2020).
- Alvarez, V. A., Sabatini, B. L. Anatomical and physiological plasticity of dendritic spines. Annual Review of Neuroscience. 30 (1), 79-97 (2007).
- Berry, K. P., Nedivi, E. Spine Dynamics: Are they all the same. Neuron. 96 (1), 43-55 (2017).
- Micheva, K. D., Smith, S. J. Array tomography: A new tool for imaging the molecular architecture and ultrastructure of neural circuits. Neuron. 55 (1), 25-36 (2007).
- Kaech, S., Banker, G. Culturing hippocampal neurons. Nature Protocols. 1 (5), 2406-2415 (2006).
- Gage, G. J., Kipke, D. R., Shain, W. Whole animal perfusion fixation for rodents. Journal of Visualized Experiments: JoVE. (65), e3564 (2012).
- Workman, E. R., Niere, F., Raab-Graham, K. F. mTORC1-dependent protein synthesis underlying rapid antidepressant effect requires GABABR signaling. Neuropharmacology. 73, 192-203 (2013).
- Li, N., et al. mTOR-dependent synapse formation underlies the rapid antidepressant effects of NMDA antagonists. Science. 329 (5994), 959-964 (2010).
Przedruki i uprawnienia
Zapytaj o uprawnienia na użycie tekstu lub obrazów z tego artykułu JoVE
Zapytaj o uprawnieniaThis article has been published
Video Coming Soon
Copyright © 2025 MyJoVE Corporation. Wszelkie prawa zastrzeżone