
Aby wyświetlić tę treść, wymagana jest subskrypcja JoVE. Zaloguj się lub rozpocznij bezpłatny okres próbny.
Method Article
Three-dimensional Characterization of Interorganelle Contact Sites in Hepatocytes using Serial Section Electron Microscopy
W tym Artykule
Podsumowanie
A simple and comprehensive protocol to acquire three-dimensional details of membrane contact sites between organelles in hepatocytes from the liver or cells in other tissues.
Streszczenie
Transmission electron microscopy has been long considered to be the gold standard for the visualization of cellular ultrastructure. However, analysis is often limited to two dimensions, hampering the ability to fully describe the three-dimensional (3D) ultrastructure and functional relationship between organelles. Volume electron microscopy (vEM) describes a collection of techniques that enable the interrogation of cellular ultrastructure in 3D at mesoscale, microscale, and nanoscale resolutions.
This protocol provides an accessible and robust method to acquire vEM data using serial section transmission EM (TEM) and covers the technical aspects of sample processing through to digital 3D reconstruction in a single, straightforward workflow. To demonstrate the usefulness of this technique, the 3D ultrastructural relationship between the endoplasmic reticulum and mitochondria and their contact sites in liver hepatocytes is presented. Interorganelle contacts serve vital roles in the transfer of ions, lipids, nutrients, and other small molecules between organelles. However, despite their initial discovery in hepatocytes, there is still much to learn about their physical features, dynamics, and functions.
Interorganelle contacts can display a range of morphologies, varying in the proximity of the two organelles to one another (typically ~10-30 nm) and the extent of the contact site (from punctate contacts to larger 3D cisternal-like contacts). The examination of close contacts requires high-resolution imaging, and serial section TEM is well suited to visualize the 3D ultrastructural of interorganelle contacts during hepatocyte differentiation, as well as alterations in hepatocyte architecture associated with metabolic diseases.
Wprowadzenie
Since their invention in the 1930s, electron microscopes have allowed researchers to visualize the structural components of cells and tissues1,2. Most investigations have provided 2D information, as building 3D models requires painstaking serial section collection, manual photography, negative processing, manual tracing, and the creation and assembly of 3D models from sheets of glass, plastic, or Styrofoam3,4. Almost 70 years later, there have been considerable advances in numerous aspects of the process, from microscope performance, serial section collection, automated digital imaging, sophisticated software and hardware for 3D reconstruction, visualization, and analysis to alternative approaches for what is now collectively termed volume EM (vEM). These vEM techniques are generally considered to provide 3D ultrastructural information at nanometer resolutions across micron scales and encompass transmission electron microscopy (TEM) and newer scanning electron microscopy (SEM) techniques; see reviews5,6,7,8.
For example, focused ion beam SEM (FIB-SEM) uses a focused ion beam inside an SEM to mill away the surface of the block between sequential SEM imaging scans of the block's surface, allowing the repeated automated milling/imaging of a sample and building up a 3D dataset for reconstruction9,10. In contrast, serial block face SEM (SBF-SEM) uses an ultramicrotome inside the SEM to remove material from the block face prior to imaging11,12, while array tomography is a nondestructive process that requires the collection of serial sections, onto coverslips, wafers, or tape, prior to setting up an automated workflow of imaging the region of interest in sequential sections in the SEM to generate the 3D dataset13. Similar to array tomography, serial section TEM (ssTEM) requires physical sections to be collected ahead of imaging; however, these sections are collected on TEM grids and imaged in a TEM14,15,16. ssTEM can be extended by performing tilt tomography17,18,19. Serial tilt tomography provides the best resolution in x, y, and z, and while it has been used to reconstruct whole cells20, it is reasonably challenging. This protocol focuses on the practical aspects of ssTEM as the most accessible vEM technique available to many EM labs who may not currently have access to specialized sectioning or vEM instruments but would benefit from generating 3D vEM data.
Serial ultramicrotomy for 3D reconstruction has previously been considered challenging. It was difficult to cut straight ribbons of even section thickness, be able to arrange and pick up ribbons of the correct size, in the correct order, onto grids with sufficient support, but without grid bars obscuring regions of interest, and most importantly, without losing sections, as an incomplete series may prevent full 3D reconstruction21. However, improvements to commercial ultramicrotomes, diamond cutting and trimming knives22,23, electron lucent support films on grids21,24, and adhesives for aiding section adhesion and ribbon preservation13,21 are just some of the incremental advances over the years that have made the technique more routine in many labs. Once serial sections have been collected, serial imaging in TEM is straightforward and can provide EM images with subnanometer px sizes in x and y, allowing high-resolution interrogation of the subcellular structures-a potential requirement for many research questions. The case study presented here demonstrates the use of ssTEM and 3D reconstruction in the study of endoplasmic reticulum (ER)-organelle contacts in liver hepatocytes, where ER-organelle contacts were first observed25,26.
While being contiguous with the nuclear envelope, the ER also makes close contacts with numerous other cell organelles, including lysosomes, mitochondria, lipid droplets, and the plasma membrane27. ER-organelle contacts have been implicated in lipid metabolism28, phosphoinositide and calcium signaling29, autophagy regulation, and stress response30,31. The ER-organelle contacts and other interorganelle contacts are highly dynamic structures that respond to cellular metabolic needs and extracellular cues. They have been shown to vary morphologically in their size and shape and the distances between organelle membranes32,33. It is thought that these ultrastructural differences are likely to reflect their different protein/lipid compositions and function34,35. However, it is still a challenging task to define interorganelle contacts and analyze them36. Hence, a reliable yet simple protocol to examine and characterize interorganelle contacts is required for further investigations.
As ER-organelle contacts can range from 10 to 30 nm in membrane-to-membrane separation, the gold standard for identification has historically been TEM. Thin-section TEM has revealed specific subdomain localization for resident ER proteins at distinct membrane contacts37. Traditionally, this has revealed ER-organelle contacts with nm resolution but often only presented a 2D view of these interactions. However, vEM approaches reveal the ultrastructural presentation and context of these contact sites in 3D, enabling full reconstruction of contacts and more accurate classification of contacts (point vs. tubular vs. cisternal-like) and quantification38,39. In addition to being the first cell type where ER-organelle contacts were observed25,26, hepatocytes have an extensive system of other interorganelle contacts that serve vital roles in their architecture and physiology28,40. However, thorough morphological characterization of ER-organelle and other interorganelle contacts in hepatocytes is still lacking. Accordingly, how interorganelle contacts form and remodel during regeneration and repair is of particular relevance to hepatocyte biology and liver function.
Access restricted. Please log in or start a trial to view this content.
Protokół
All animals were housed in accordance with the UK Home Office guidelines, and the tissue harvesting was carried out in accordance with the UK Animal (Scientific Procedures) Act 1986.
1. Specimen fixation and preparation
- Dissect the liver tissue into appropriate size pieces, approximately 8 mm x 8 mm x 3 mm, and place the pieces in warm phosphate-buffered saline (PBS, 37 °C).
- Inject room temperature (20-25 °C) fixative (1.5% glutaraldehyde in 1% sucrose, 0.1 M sodium cacodylate) into the liver pieces and transfer them from PBS to fixative for up to 20 min at room temperature. Always keep the tissue submerged in solutions to avoid drying.
NOTE: Aldehydes are irritants that are corrosive and potentially carcinogenic. Sodium cacodylate is toxic if swallowed or inhaled. All fixatives must be handled while wearing appropriate personal protective equipment, and the experiment should be performed in a fume hood. Good fixation will result in a firmer tissue. - Set up the vibrating microtome with a blade, ice bath, and a cold PBS-filled buffer tray. Mount the first piece of fixed liver tissue on a specimen holder with cyanoacrylate glue and transfer the block to the vibrating microtome.
- Following the manufacturer's recommendations, approach the tissue and slice the fixed liver into 100 µm-thick slices.
- Collect the slices using a spatula or natural hair paintbrush and transfer them into a 12- or 24-well dish containing ice-cold fix (1.5% glutaraldehyde, 0.1 M sodium cacodylate) on ice. Leave the slices on ice until all samples have been sliced and are ready to be processed further.
- Select the slices containing the regions of interest for further processing and wash with gentle agitation. Perform three, 5 min washes with room temperature 0.1 M sodium cacodylate in a 12- or 24-well dish, ensuring the slices have sufficient buffer to move freely.
NOTE: In general, regions of interest are selected based on anatomical features related to the biological question of the study and guided by regions of the tissue that are likely to be present in the entire series, e.g., not on the edge of the section, and that are well preserved. - In a fume hood, replace 0.1 M sodium cacodylate with freshly prepared 1% osmium tetroxide/1.5% potassium ferricyanide. Place the 12- or 24-well dish in a sealed container and transfer the container to a hazardous-chemicals fridge for 1 h.
NOTE: Osmium is extremely hazardous in case of ingestion, inhalation, and skin contact. Potassium ferricyanide is an irritant and is harmful by inhalation and skin contact. Always handle using appropriate personal protective equipment, and perform the experiment in a fume hood. - In a fume hood, remove the osmium tetroxide/potassium ferricyanide to a dedicated osmium waste bottle, and wash the samples for 5 min with 0.1 M sodium cacodylate three times. Leave the samples in a sealed container overnight at 4 °C.
NOTE: Potential pause point. Samples can be stored in 0.1 M sodium cacodylate in a sealed container at 4 °C for weeks with little detriment to preservation. Ensure that there is sufficient buffer to prevent drying. - Incubate the samples with freshly prepared 1% tannic acid in 0.05 M sodium cacodylate for 45 min in the dark at room temperature.
NOTE: Tannic acid is an irritant and can cause eye damage. Wear appropriate personal protective equipment and perform the experiment in a fume hood. - Perform three 5 min washes with ddH2O prior to dehydration and embedding.
2. Sample dehydration, Epon resin embedding, and mounting
- Prepare Epon resin according to the following ratio by weight (see step 2.2). Tare a balance with a 100 mL disposable plastic beaker containing a stir bar. Cut the ends from 5 disposable plastic Pasteur pipettes and use these to transfer viscous resin components into the beaker.
- Sequentially add 19.2 g of resin-812, 7.6 g of DDSA, 13.2 g of MNA, and 0.8 g of DMP-30 accelerator into the beaker. Using the fifth clean plastic Pasteur pipette, thoroughly mix the resin components by hand.
NOTE: Avoid introducing bubbles but ensure sufficient mixing of the bottom resin with the top to achieve a color change and rough mixing of the component layers. All resin components are irritants and are harmful by inhalation and skin contact. DMP-30 is corrosive and can cause skin corrosion. Wear appropriate personal protective equipment. - Place the beaker on a magnetic stirrer and leave to stir gently, periodically mixing the resin manually.
- Wash the samples with gentle agitation for 5 min with 70% ethanol; repeat once.
- Wash the samples with gentle agitation for 5 min with 90% ethanol; repeat once.
- Wash the samples with gentle agitation for 5 min with 100% ethanol; repeat once.
- While the samples are in 100% ethanol washes in a fume hood, prepare a 50:50 (v/v) propylene oxide (PO):Epon mixture in a glass vial with a propylene oxide (PO)-resistant plastic lid. Carefully but securely clip on the glass vial lid, and while keeping hold of both lid and vial, shake or vortex to mix.
NOTE: Propylene oxide is an acutely toxic, flammable irritant that dissolves some plastics. Wear appropriate personal protective equipment and perform the experiment in a fume hood. - After step 2.6, incubate the samples with PO:Epon for 1 h in a PO-resistant container (e.g., aluminum trays or glass vials), with gentle rocking/agitation in the fume hood.
- In the fume hood, transfer the samples to 100% Epon. Incubate for 2 h at room temperature in the fume hood with rocking/rotation/agitation. Transfer the PO:Epon mixture to a dedicated glass Epon waste bottle.
- Repeat step 2.9 once.
- Mount the samples for embedding. Depending on the size of the slices and the region of interest, directly mount the slices onto prepolymerized resin stubs or flat-embed them for dissection and re-embed them at a later date.
NOTE: For flat-embedding, a "cast-a slide" can be used to embed many slices at once. Leftover resin can be used to fill beam capsules and baked to make prepolymerized stubs or frozen for later use. - Once mounted and covered in sufficient resin to fill the "cast-a slide" cavity, bake the samples overnight in a 60 °C oven.
NOTE: Potential pause point. Samples can be stored at room temperature for years. - For re-embedding, identify the region of interest in the flat embedded tissue slices. Using a jeweler's saw, cut out the piece of tissue of appropriate size (1 mm2 to 4 mm2) and re-embed using resin prepared, as in step 2.2, onto the top of a prepolymerized block and bake overnight in a 60 °C oven.
NOTE: Alternatively, the tissue piece can be glued to a stub or pin with two-part epoxy resin. Leave to set overnight. Potential pause point.
3. Trimming and serial sectioning of embedded samples
NOTE: Sectioning is a learned skill; users should be proficient at ultrathin sectioning prior to attempting serial sectioning. As exact microtome controls vary across manufacturers, follow the manufacturer's instructions and guidelines.
- With the sample locked in the trimming adaptor, use a razor blade to carefully trim the resin embedded tissue to meet the following criteria (see Figure 1A,B):
- Ensure there is a flat, top surface exposing the tissue around the region of interest.
- Ensure a trapezoid shape with the top and bottom edges being clean and parallel.
- Ensure overall dimensions of 200-500 µm in x, 100-500 µm in y.
- Ensure an asymmetric block face, e.g., right-hand side corners of ~90 °, top left corner obtuse, and left-hand bottom corner acute.
NOTE: A trimming cryoknife can be an alternative tool for a razor blade. The other recommendations are for user convenience for ordering sections when imaging. Optional: If sections fail to form stable ribbons, a contact cement can be applied to the leading edge of the block face to aid ribbon formation. Razor blades are sharp; take care to hold the razor blade such that accidental slippages are unlikely to result in personal harm.

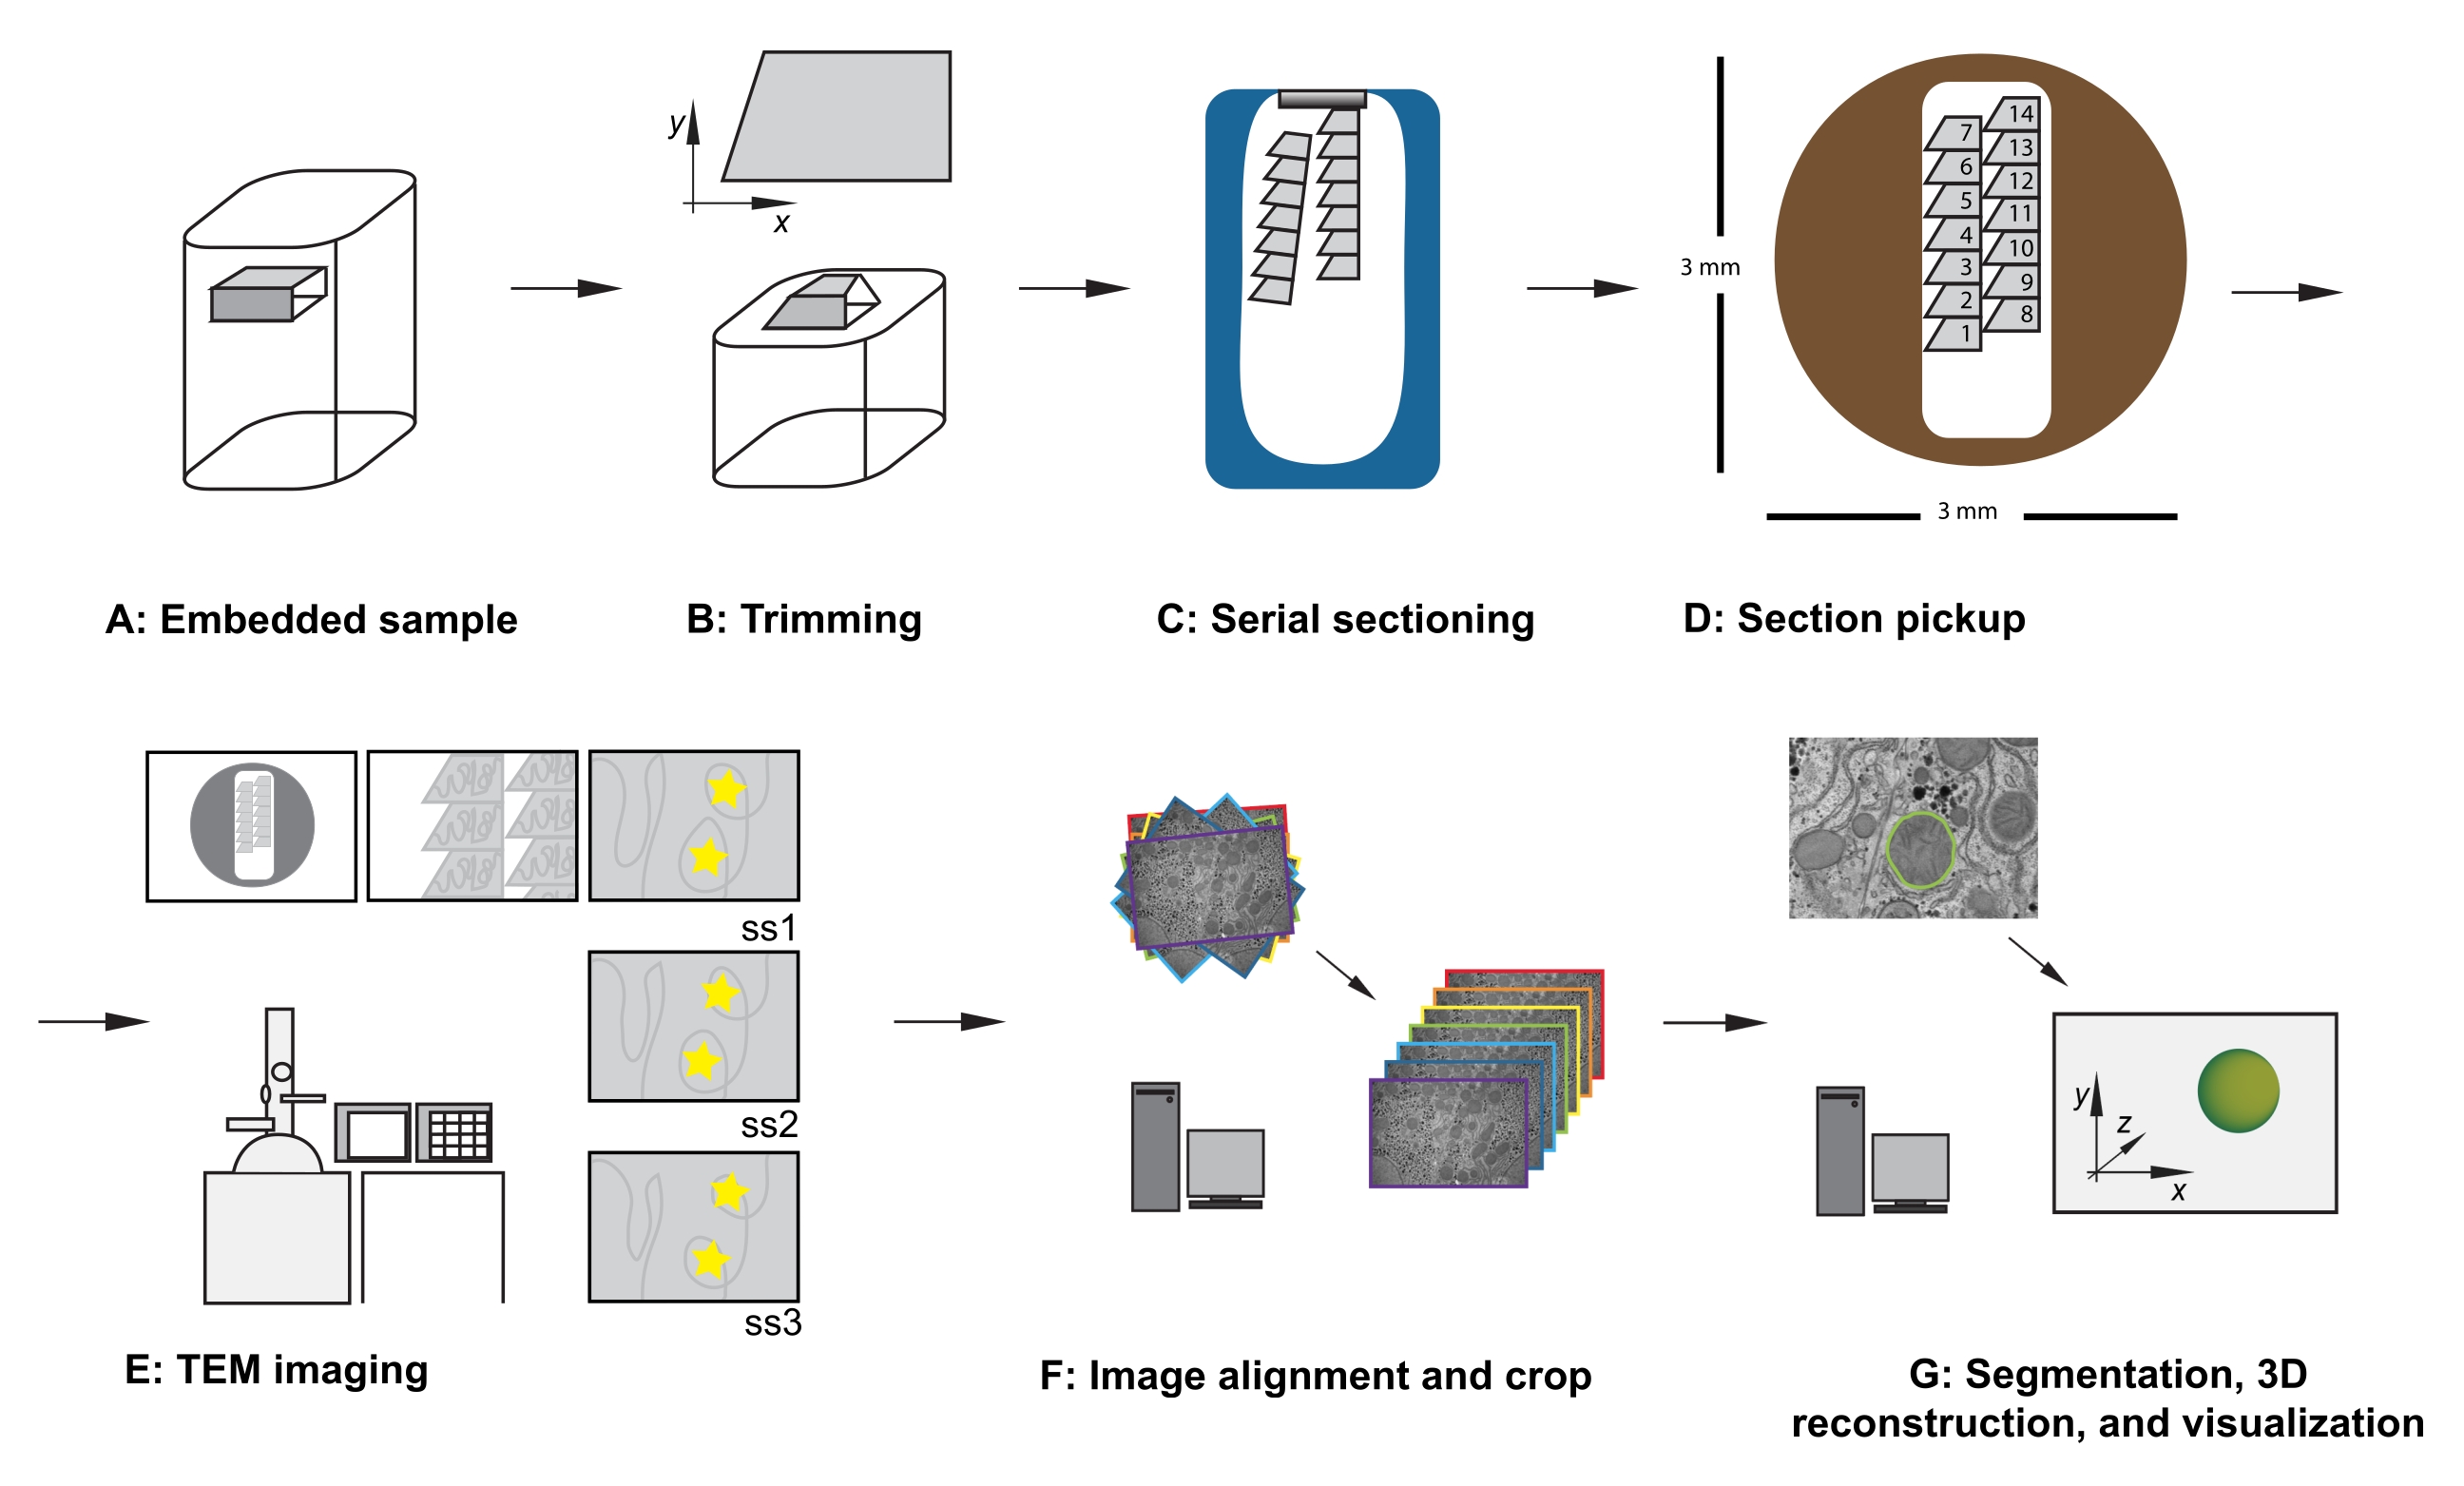
Figure 1: Serial section TEM workflow. (A) Diagram of the specimen in the resin block. (B) Trim block to generate a trapezoid shape with edges suitable for serial sectioning and asymmetric block face to ensure known orientation. (C) Diagram showing ribbons of serial sections, floating on the water's surface in the diamond knife boat. (D) Diagram showing the section and ribbon organization, dictating order of sections, on a 3 mm diameter TEM slot grid. (E) TEM imaging and navigation. Showing ribbon and section order and using "yellow star stickers" on the monitor for screen referencing to ensure reimaging of the same region of interest in subsequent sections. (F) Image alignment and cropping. (G) Segmentation, 3D reconstruction, and visualization. Abbreviation: TEM = transmission electron microscopy. Please click here to view a larger version of this figure.
- Once trimmed, transfer the specimen arc, together with the chuck and the sample, to the specimen arm of the microtome, positioning the specimen arc so that the arc's travel range runs from top to bottom; secure the specimen arc in place.
- Place and lock the diamond knife in the knife holder, ensuring that the cutting angle is set appropriately to the knife. Lock the knife holder into the stage securely.
- With the stage uplighting on, use the knife advance while constantly checking the relationship between the block face and the knife's edge. Cautiously advance the knife towards the specimen, continually adjusting the knife's lateral angle, specimen tilt, and specimen rotation by adjusting the relevant knobs until the block is aligned to the knife's edge.
- Turn off the stage uplighting; turn on the stage downlighting; set the top and bottom of the cutting window of the specimen arm; and leave the specimen just below the knife edge.
- Fill the knife boat with clean ddH2O and ensure the water surface is level with the knife's edge and just slightly concave.
- Optional: Dip an eyelash into the 0.1% Triton X-100 and then in the knife boat water to reduce the surface tension of the water to aid chloroforming and ribbon pickup.
- Prepare the workstation with eyelashes (eyelash glued to a cocktail stick), formvar-coated slot grids, labeled crossover forceps, chloroform, 0.1% Triton X-100 solution, distilled water, filter paper, and grid box with grid box notes.
- Set the cutting speed at 1 mm/s and the initial cutting thickness to 100 nm and start the cutting cycle.
- After the first section is cut, change the cutting parameters to a cutting speed at 0.8 mm/s and the cutting thickness to 70 nm, and continue cutting, allowing sections to form a ribbon moving down the surface of the water-filled knife boat (Figure 1C).
NOTE: It is important to be aware of the color of the sections being produced as this is often a more accurate guide to the thickness of the resin sections. Silver sections are usually around 70 nm thick, while grey sections are thinner and gold sections are thicker. - Allow the microtome to continue cutting sections and the ribbon to get longer.
NOTE: It is important to avoid large vibrations and physical disturbances in the room. Drafts can cause the sections to move on the surface of the water in the knife boat, and physical vibrations can cause the microtome to cut unevenly. - Once enough sections are collected and before the ribbon gets to the end of the boat, stop the cutting (just after the sample has passed the knife's edge).
NOTE: The number of sections needed depends on the size of the block face and the size of the dataset to be collected. Thus, it is useful to be aware of the relationship between the size of the block and the slot grid as the cut sections are coming off. - Using an eyelash in each hand, gently break the ribbon into smaller ribbons that can fit in the length of the slot grid, taking care to make a note of their relative positions from within the sample.
NOTE: If their combined width fits, multiple ribbons can be gently placed next to each other and picked up together in a single slot grid. If picking up multiple ribbons on a single slot grid, pay attention to the order and the relative position of the ribbons. For example, always place the ribbons further into the sample to the right of a ribbon already in the sample (Figure 1D). - Optional: Using a glass applicator rod, hover a drop of chloroform over the sections to flatten them out.
NOTE: Chloroform is toxic and an irritant. Do not let chloroform touch the water surface or sections. If it accidentally does, the water needs to be removed and the knife washed before returning to sectioning. The chloroform can damage the sections and degrade the glue that secures the diamond into the knife boat. - Using the first numbered forceps, pick up the first empty slot grid (on the right-hand side of the slot, formvar side down), gently dip in the Triton X-100, and then twice in the distilled water before removing excess water from the forceps edge using a piece of filter paper.
- With an eyelash in one hand and the forceps in the other hand, gently lower approximately 2/3rd of the formvar-coated slot grid into the water of the knife boat (away from the sections), so that the formvar side is facing down, and the right-hand long edge of the slot is at the surface of the water and parallel to the water's edge.
- Gently waft the grid in the water towards the ribbons so that upon the return stroke, the sections drift towards the grid. Continue to do this in smaller and smaller wafts until the right-hand edge of the ribbon lines up with the right-hand edge of the slot. Then, with the last waft, gently bring the grid up to pick the sections up into the slot grid.
- Leave the grid in the forceps to dry before storing it in the grid box, appropriately annotated on the grid box reference sheet.
- Repeat step 3.16 until all ribbons are collected, ensuring that the order of ribbons is maintained.
- If further sections are required, retract the knife 150 nm or so, check the water level in the boat, and add more if required. Start the cutting process again, following steps 3.11-3.18.
- Once all sections are collected, ensure the knife edge is free from section debris, retract the knife away from the block face, and remove and clean the knife.
4. Grid staining
- Once dry, stain the sections with Reynolds' lead citrate either on parafilm on the bench or in a Petri dish. Place several pellets of sodium hydroxide under a Petri dish lid to provide a carbon dioxide-free environment. Then, carefully, away from the pellets, pipette 40 µL drops of Reynolds' lead citrate on the parafilm, one for each grid.
NOTE: Do not stain too many grids at once; e.g., the maximum should be 6. Try not to breathe directly on the staining dish. Carbon dioxide can react with the lead citrate and cause unwanted precipitate on the grids. - Invert each grid (section side down) onto the lead citrate drop and leave protected by the Petri dish lid for 7 to 10 min. While the grids are staining, prepare a larger second piece of parafilm on the bench with five 300 µL drops of distilled water for each grid.
- At the end of the lead citrate incubation, transfer each grid to a droplet of distilled water to wash for 1 min without breathing directly on the grids.
- Repeat step 4.3 a total of five times.
- Using numbered crossover forceps, pick up the first grid, touch the edge of the grid to filter paper to wick away most of the water, and allow to dry in the forceps (for at least 20 min). Repeat for each grid.
5. Imaging acquisition by TEM
NOTE: As exact TEM controls vary across manufacturers, follow the manufacturer's instructions and guidelines. The following steps should be performed by users who are already proficient at TEM use.
- Prior to imaging, perform the usual checks, e.g., beam alignment, gain references, and sample eucentricity.
- Carefully load the first grid of serial sections into the specimen holder, taking care to align the slot (and therefore sections) to the vertical axis of the microscope stage.
NOTE: This accuracy is not essential but saves time during acquisition and future data handling stages. When inserting the grid (section side down or section side up), take care to image all grids in the same orientation. - At low magnification, observe the order, location, and position of the serial sections (Figure 1E). Navigate to the middle section of the series on the grid.
NOTE: Depending on the exact research aim, approaches for imaging may vary; however, the following is a useful starting point. The shape of the sections and the relationship of the ribbons (as picked up in step 3.14) dictate which section was first and which section was last on the grid. - Browse the sample and identify a region of interest. Observe the sample at the desired magnification, and consider collecting the series at a slightly lower magnification, as sections are often not perfectly aligned, and images may need to be cropped later.
- Take reference images at lower magnifications to appreciate the context of the region of interest, its rough location at different magnifications in relation to section boundaries, and landmark features within the sample. Use these to sign-post the region of interest in other sections.
- Optional: for screen referencing, use reusable adhesive putty, stickers, or a piece of overhead projector (OHP) paper, taped to the screen, to place temporary markers on the screen to allow routine reimaging of the same features of the region of interest in the center of the image, throughout the dataset (see yellow stars in Figure 1E).
- Using the reference images, navigate to the region of interest on the first section of the grid, and acquire an image at the desired magnification.
NOTE: When saving images, note down the first file name of the first image of the series, and use sequential naming nomenclature so that all image names follow the sequential order of the serial sections. - Navigate to the next section and repeat step 5.7 until all sections have been imaged for that region of interest.
6. Image export and serial section alignment registration
- Export the image files belonging to the same stack into a single folder. Make sure the folder is sorted by file name.
NOTE: The images should ideally have the same root name and follow the order in which they have been acquired. - Open Fiji and click on File | Import | Image Sequence.
- Click on the first image of the folder and click Open. Wait for a popup window of Sequence Options to appear (Figure 2A).

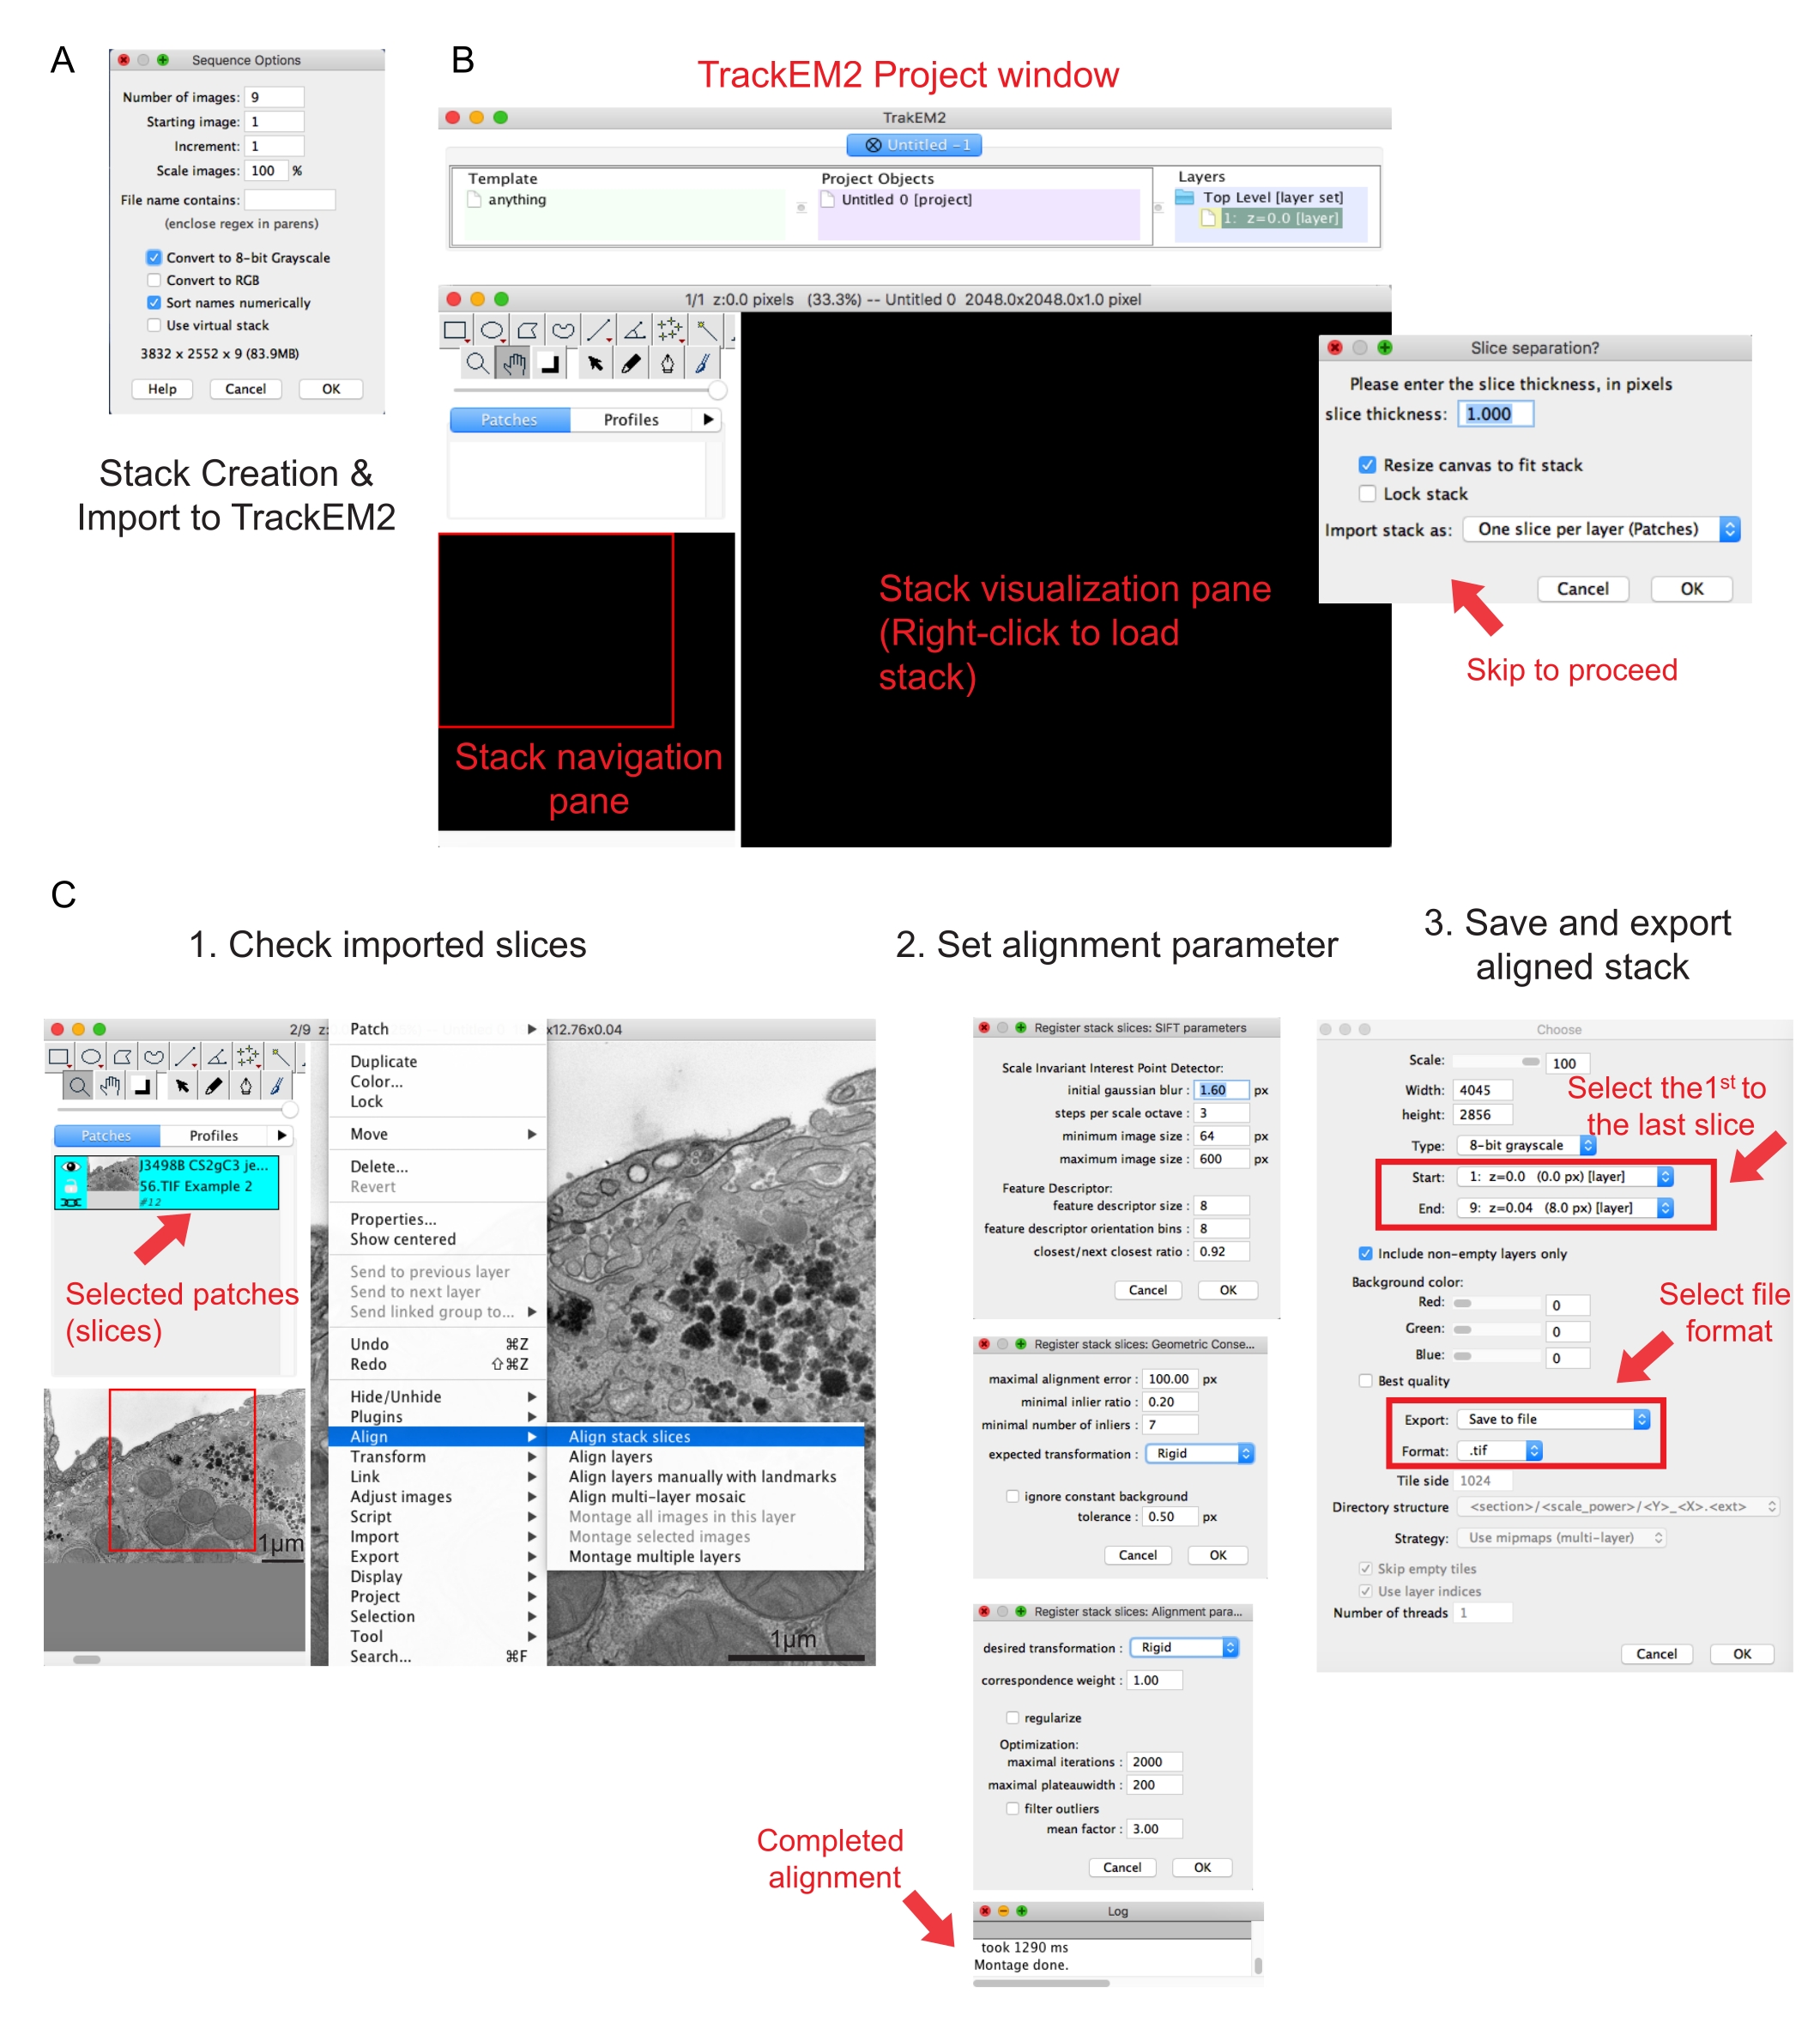
Figure 2: Creation of a serial stack and serial section alignment using Fiji. (A) Screenshot showing the Sequence Options when loading the images for making a serial stack. (B) Screenshot of the TrackEM2 plugin and the key windows of the plugin. Press OK in the Slice separation to proceed with the alignment. (C) Screenshot after successfully loading the serial stack into the visualization pane. Three sequential windows of alignment parameters will pop up once Align stack slices are selected. Export the aligned stack once the alignment is completed. Please click here to view a larger version of this figure.
- Click Sort names numerically | Convert to 8-bit option. Press OK.
NOTE: Conversion to 8-bit aids import of the data into Amira and reduces the file size, allowing quicker processing speeds in later steps. - Check the completeness, sequence, and magnification of the created stack. Save the created stack as a .tif file.
NOTE: Images should have been acquired at the same magnification. - Execute the TrakEM2 plugin41. Go to File | New | TrackEM2 (blank).
NOTE: The plugin will ask the user to save the TrackEM2 files. If needed, save the TrackEM2 files to the image folder. Three windows should appear: a project window, a stack navigation (left) window, and a stack visualization pane (Figure 2B). - Right-click to the black visualization pane. Click Import | Import stack and select the previously created stack.
- Click OK to load the stack to the stack navigation window.
NOTE: A Slice separation window will pop up to ask for pixel and dimension relationship. For only stack alignment, click OK to skip this step. - Use the slider to check all the slices of the stack. Look for the loaded slice, which will appear as a patch in the navigation plan. Select the patches that will be included in the following alignment.
NOTE: Selected patches will go blue. - Hover the mouse over the viewing pane. Right-click the image, select Align | Align stack slices (Figure 2C-1).
- Specify the alignment parameters through a set of three sequential windows.
NOTE: For most data, start with a rigid alignment (allows for rotation and translation but not transformation) and keep other parameters as default (Figure 2C-2). - Allow the alignment to run until the readout log says Montage done.
NOTE: Runtime depends on the number of voxels and the speed of the computer. - Check the aligned stack in the viewing pane. Press Alt and - keys (in PC) or the Ctrl and - keys (in Mac) for a zoom-out view of the aligned stack.
- If satisfied with the aligned stack, right-click Export | Make flat image to save the aligned stack.
- Select the first image as the start of the stack and the last image as the end of the stack, click OK (Figure 2C-3). Save the aligned stack as .tif.
NOTE: To reduce file size, crop the data to only contain the necessary region of interest. - If needed, execute an affine alignment on the aligned stack. Open the aligned stack in Fiji, select Plugin | Registration | StackReg.
- Choose the affine option and press OK. Wait until the program is complete.
- Save the affine-aligned stack with a different file name.
7. Segmentation and 3D reconstruction
- Open Amira42. Click File | Open Data to load the aligned stack.
- Specify the voxel measurements in the new popup window (Figure 3A).

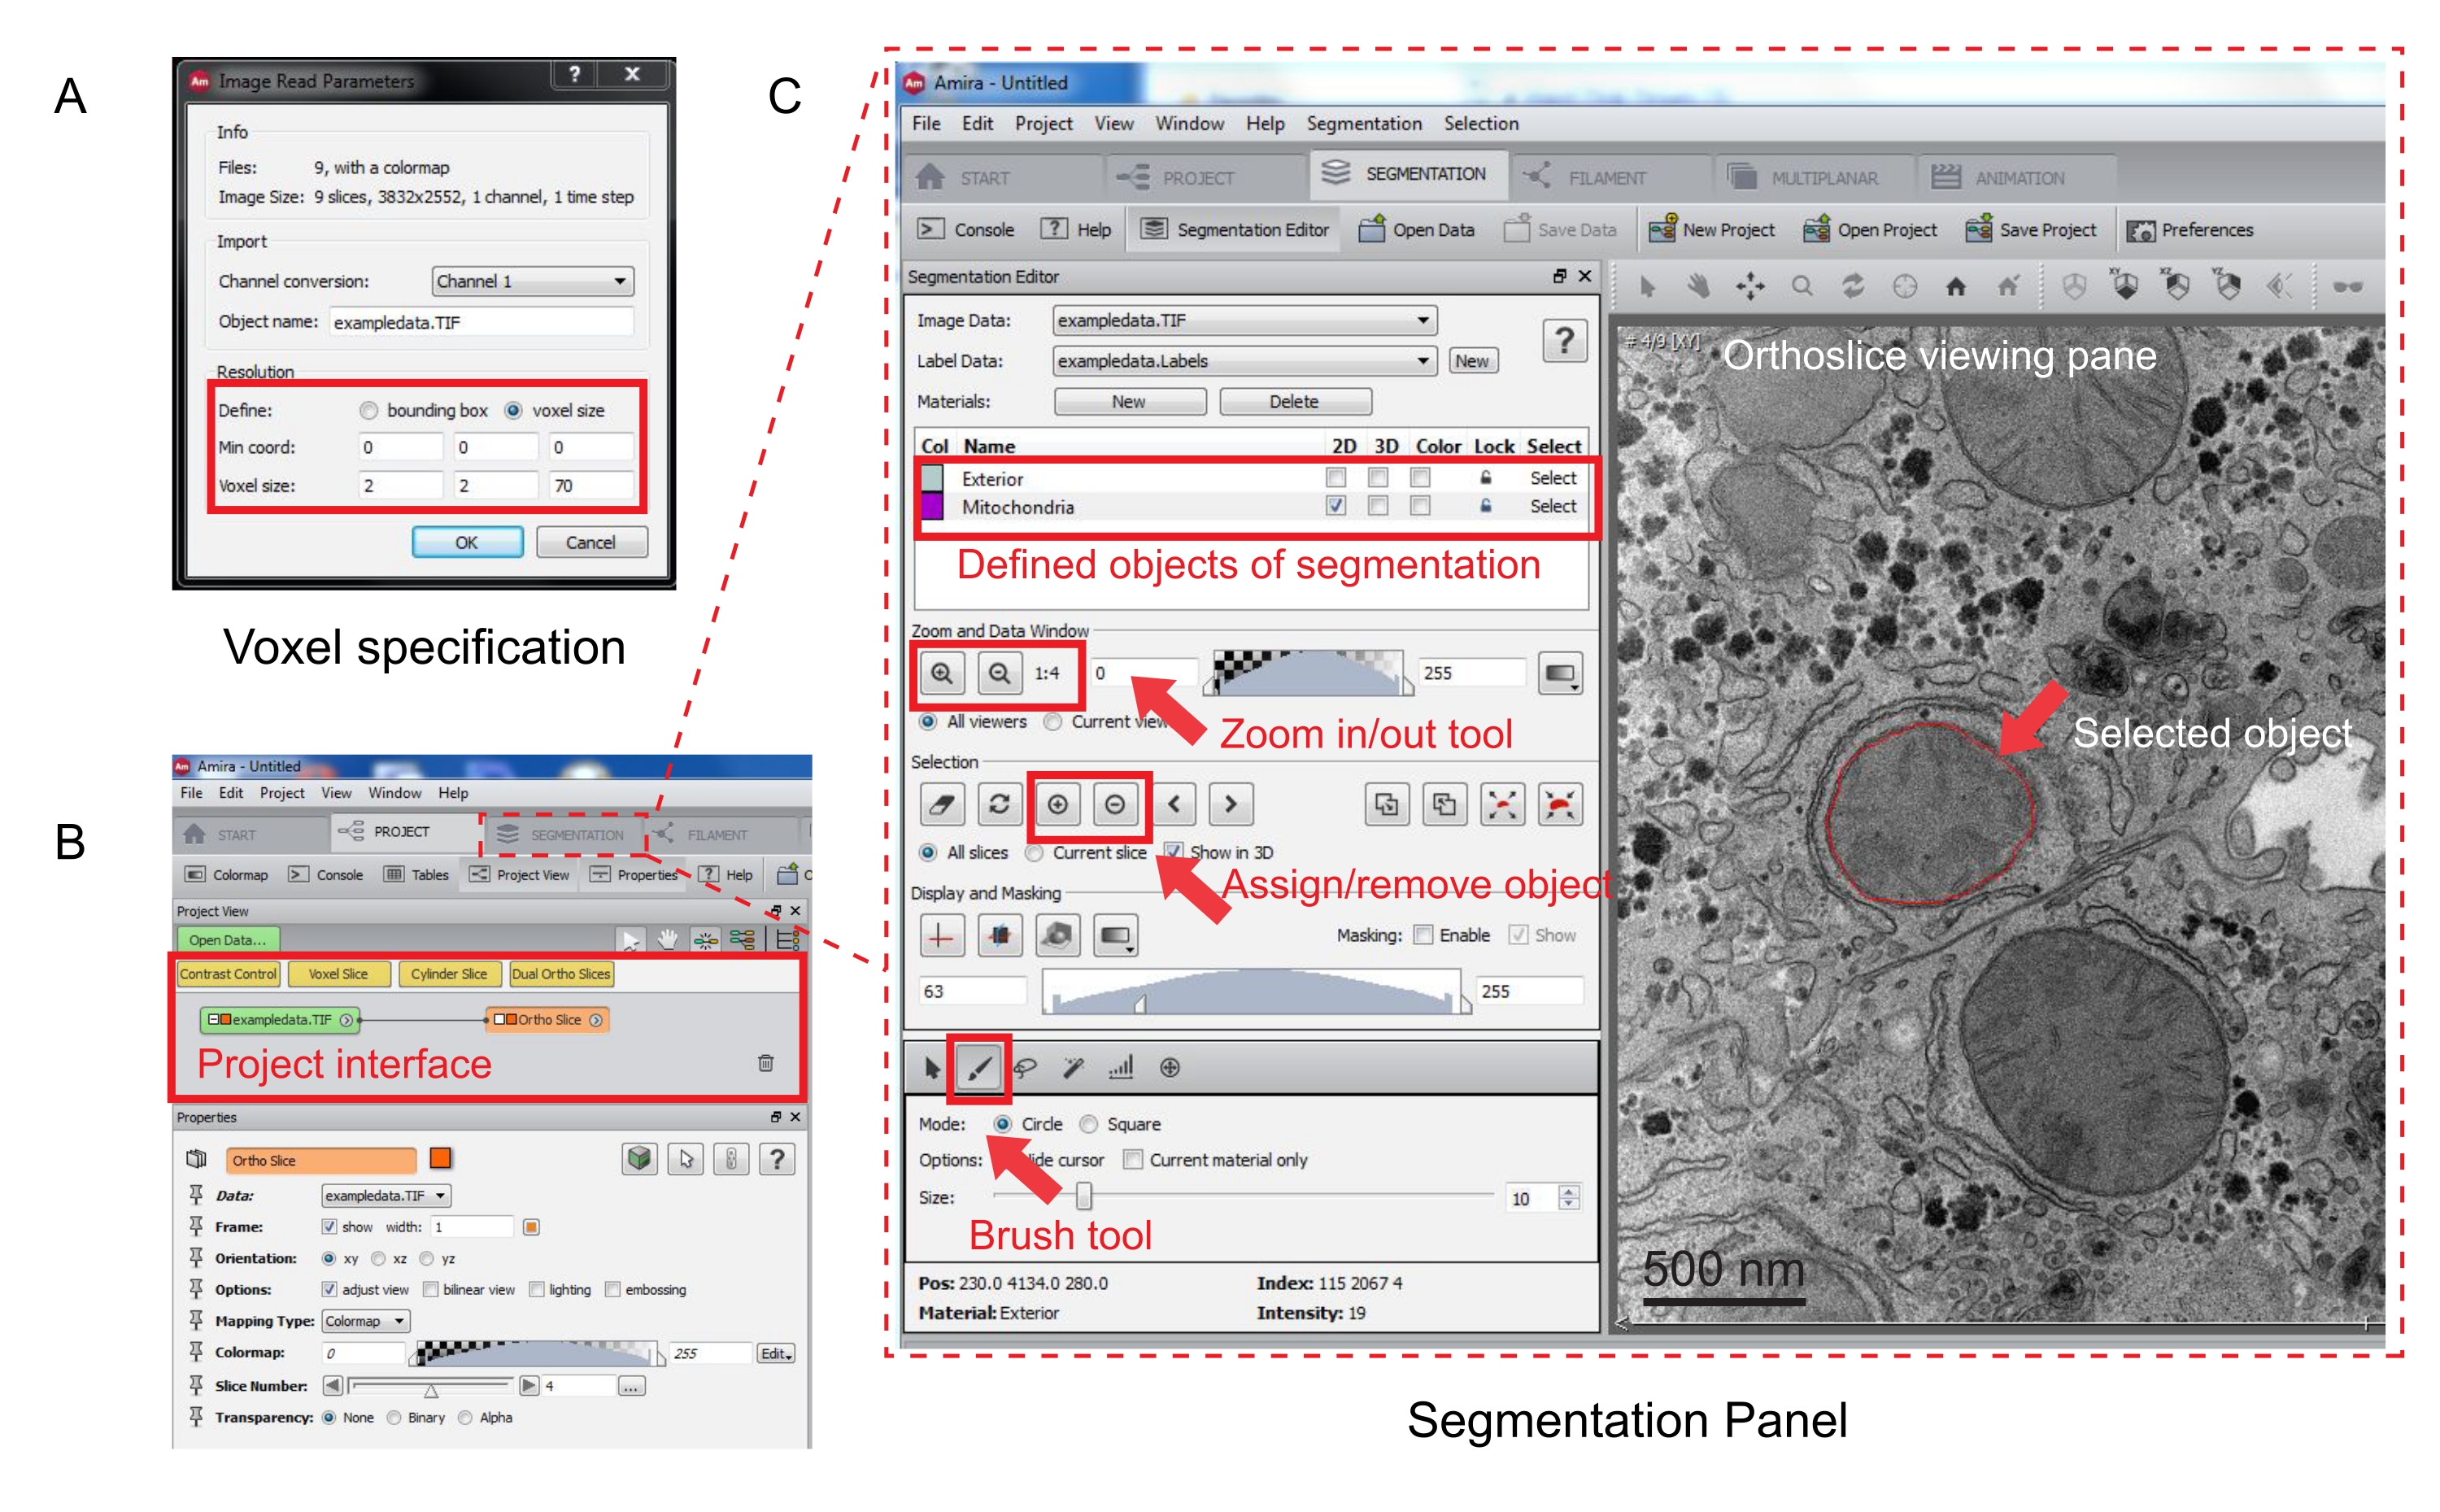
Figure 3: Segmentation of serial stack using Amira. (A) The Voxel definition popup window prior to loading an aligned stack. (B) Screenshot of the project interface after the import of a stack. Select the Segmentation tab to start object tracing in the Segmentation Editor panel. (C) Key features of the segmentation tab. Define the objects for segmentation in the Segmentation Editor section of the Segmentation tab. Use the zoom function to assist identification of objects. Select the Brush tool and trace the boundary of the object. Click the + symbol under Selection to assign the trace. An assigned object will appear to have a red boundary in the orthoslice viewing pane. Please click here to view a larger version of this figure.
NOTE: An image stack node will appear in the project interface, and an orthoslice will appear in the viewing pane on the right (Figure 3B).
- To start segmentation, select the Segmentation Tab (Figure 3B).
NOTE: It is recommended to save the segmentation progress before and during the segmentation. Go to Model | Save Model As any .am file that suits. - Click New in the segmentation editor panel to define new objects in the material list. Right-click to change the color of the object and double-click to rename the object.
- For manual segmentation, choose the segmentation tool below the material list. Select the default Brush tool to highlight the pixels (Figure 3C).
NOTE: Alternatively, use the brush tool to trace the outline of the object and press Shift + F to fill the object. - To convert the brush tool into an eraser, continually press Ctrl while selecting pixels for correction. Annotate every slice in the stack.
- Once confirmed, assign the selection to a label by clicking the + sign. Click the - sign to remove the selection.
- Go back to the project interface once the segmentation is complete. Look for a node with a ".label" extension connected to the image stack.
- Right-click the ".label" extension and select Generate Surface | Apply to create a .surf file.
- To render the 3D model of a segmented object, right-click the .surf file and select Surface view to generate a 3D model in the viewing pane.
- Save the 3D model for visualization or further quantitative analyses.
Access restricted. Please log in or start a trial to view this content.
Wyniki
For this technique, regions of interest are selected based on the biological research aim and identified prior to the trimming and sectioning of embedded tissue. Similarly, the size of the block face may be dictated by the research question; in this case, the sample was trimmed to leave a block face of approximately 0.3 mm x 0.15 mm (Figure 4A). This allowed for two grids of 9 serial sections per grid, providing 18 serial sections and incorporating a volume of liver tissue of a volume of app...
Access restricted. Please log in or start a trial to view this content.
Dyskusje
An accessible vEM technique for visualizing organelle structure and interactions in 3D is described in this protocol. The morphology of interorganelle contacts in hepatocytes is presented as a case study here. However, this approach has also been applied to investigate a variety of other samples and research areas, including Schwann cell-endothelial interactions in peripheral nerves45, Weibel Palade Body biogenesis in endothelial cells46, cargo secretion in kidney cells
Access restricted. Please log in or start a trial to view this content.
Ujawnienia
The authors have no conflicts of interest to disclose.
Podziękowania
We thank Joanna Hanley, Rebecca Fiadeiro, and Ania Straatman-Iwanowska for expert technical assistance. We also thank Stefan lab members and Ian J. White for helpful discussions. J.J.B. is supported by MRC funding to the MRC Laboratory of Molecular Cell Biology at UCL, award code MC_U12266B. C.J.S. is supported by MRC funding to the MRC Laboratory of Molecular Cell Biology University Unit at UCL, award code MC_UU_00012/6. P.G. is funded by the European Research Council, grant code ERC-2013-StG-337057.
Access restricted. Please log in or start a trial to view this content.
Materiały
| Name | Company | Catalog Number | Comments |
| 0.22 µm syringe filter | Sarstedt | 83.1826.001 | |
| Aluminum trays | Agar Scientific | AGG3912 | |
| Amira v6 | ThermoFisher | https://www.thermofisher.com | |
| Chloroform | Fisher | C/4960/PB08 | |
| DDSA/Dodecenyl Succinic Anhydride | TAAB | T027 | Epon ingredient |
| Diamond knife | DiaTOME | ultra 45° | |
| DMP-30/2,4,6-tri (Dimethylaminomethyl) phenol | TAAB | D032 | Epon ingredient |
| Dumont Tweezers N5 | Agar Scientific | AGT5293 | |
| Fiji | https://imagej.net/ | ||
| Fiji TrakEM2 plugin | https://imagej.net/ | ||
| Formaldehyde 36% solution | TAAB | F003 | |
| Formvar coated slot grid | Homemade | Alternative: EMS diasum (FF2010-Cu) | |
| Glass bottle with applicator rod | Medisca | 6258 | |
| Glass vials | Fisher Scientific | 15364769 | |
| Gluteraldehyde 25% solution | TAAB | G011 | |
| MNA/Methyl Nadic Anhydride | TAAB | M011 | Epon ingredient |
| Osmium Tetroxide 2% solution | TAAB | O005 | |
| Potassium Ferricyanide | Sigma-Aldrich | P-8131 | |
| Propylene oxide | Fisher Scientific | E/0050/PB08 | |
| Reuseable adhesive | Blue Tack | ||
| Reynolds Lead Citrate | TAAB | L037 | Section stain |
| Sodium Cacodylate | Sigma-Aldrich | C-0250 | to make 0.1 M Caco buffer |
| Super Glue | RS Components | 918-6872 | Cyanoacrylate glue, Step 1.3 |
| TAAB 812 Resin | TAAB | T023 | Epon ingredient |
| Tannic acid | TAAB | T046 | |
| Triton X-100 | Sigma-Aldrich | T9284 | |
| Two part Epoxy Resin | RS Components | 132-605 | Alternative: Step 2.13 |
| Ultramicrotome | Leica | UC7 | |
| Vibrating microtome | Leica | 100 µm thick slices, 0.16 mm/s cutting at 1 mm amplitude . | |
| Weldwood Original Contact cement | DAP | 107 | Contact adhesive: Step 3.1.4 |
Odniesienia
- Knoll, M., Ruska, E. Das elektronenmikroskop. Zeitschrift für Physik. 78 (5), 318-339 (1932).
- von Ardenne, M. Daselektronen-rastermikroskop. Zeitschrift für Physik. 109 (9), 553-572 (1938).
- Bang, B. H., Bang, F. B. Graphic reconstruction of the third dimension from serial electron microphotographs. Journal of Ultrastructure Research. 1 (2), 138-139 (1957).
- Birch-Andersen, A. Reconstruction of the nuclear sites of Salmonella typhimurium from electron micrographs of serial sections. Journal of General Microbiology. 13 (2), 327-329 (1955).
- Denk, W., Horstmann, H. Serial block-face scanning electron microscopy to reconstruct three-dimensional tissue nanostructure. PLoS Biology. 2 (11), 329(2004).
- Peddie, C. J., Collinson, L. M. Exploring the third dimension: volume electron microscopy comes of age. Micron. 61, 9-19 (2014).
- Titze, B., Genoud, C. Volume scanning electron microscopy for imaging biological ultrastructure. Biology of the Cell. 108 (11), 307-323 (2016).
- Kornfeld, J., Denk, W. Progress and remaining challenges in high-throughput volume electron microscopy. Current Opinion in Neurobiology. 50, 261-267 (2018).
- Heymann, J. A., et al. Site-specific 3D imaging of cells and tissues with a dual beam microscope. Journal of Structural Biology. 155 (1), 63-73 (2006).
- Knott, G., Marchman, H., Wall, D., Lich, B. Serial section scanning electron microscopy of adult brain tissue using focused ion beam milling. Journal of Neuroscience. 28 (12), 2959-2964 (2008).
- Leighton, S. B. SEM images of block faces, cut by a miniature microtome within the SEM - a technical note. Scanning Electron Microscopy. , 73-76 (1981).
- Martone, M. E., Deerinck, T. J., Yamada, N., Bushong, E., Ellisman, M. H. Correlated 3D light and electron microscopy: use of high voltage electron microscopy and electron tomography for imaging large biological structures. Journal of Histotechnology. 23 (3), 261-270 (2000).
- Micheva, K. D., Smith, S. J. Array tomography: a new tool for imaging the molecular architecture and ultrastructure of neural circuits. Neuron. 55 (1), 25-36 (2007).
- Sjostrand, F. S. Ultrastructure of retinal rod synapses of the guinea pig eye as revealed by three-dimensional reconstructions from serial sections. Journal of Ultrastructure Research. 2 (1), 122-170 (1958).
- Ware, R. W. Three-dimensional reconstruction from serial sections. International Review of Cytology. 40, 325(1975).
- Stevens, J. K., Davis, T. L., Friedman, N., Sterling, P. A systematic approach to reconstructing microcircuitry by electron microscopy of serial sections. Cognitive Brain Research. 2 (3), 265-293 (1980).
- Hoppe, W. Three-dimensional electron microscopy. Annual Review of Biophysics. 10, 563-592 (1981).
- Frank, J. Electron tomography: methods for three-dimensional visualization of structures in the cell. , Springer. New York, NY. (2008).
- Baumeister, W. Electron tomography: towards visualizing the molecular organization of the cytoplasm. Current Opinion in Structural Biology. 12 (5), 679-684 (2002).
- Hoog, J. L., Schwartz, C., Noon, A. T., O'Toole, E. T. Organization of interphase microtubules in fission yeast analyzed by electron tomography. Developmental Cell. 12 (3), 349-361 (2007).
- Harris, K. M., Perry, E., Bourne, J., Feinberg, M., Ostroff, L., Hurlburt, J. Uniform serial sectioning for transmission electron microscopy. Journal of Neuroscience. 26 (47), 12101-12103 (2006).
- Jesior, J. C. Use of low-angle diamond knives leads to improved ultrastructural preservation of ultrathin sections. Scanning Microscopy Supplement. 3, 147-152 (1989).
- Studer, D., Gnaegi, H. Minimal compression of ultrathin sections with use of an oscillating diamond knife. Journal of Microscopy. 197, 94-100 (2000).
- Gay, H., Anderson, T. F. Serial sections for electron microscopy. Science. 120 (3130), 1071-1073 (1954).
- Bernhard, W., Rouiller, C. Close topographical relationship between mitochondria and ergastoplasm of liver cells in a definite phase of cellular activity. The Journal of Biophysical and Biochemical Cytology. 2, 73-78 (1956).
- Palade, G. E. An electron microscope study of the mitochondrial structure. The Journal of Histochemistry & Cytochemistry. 1 (4), 188-211 (1953).
- Wu, H., Carvalho, P., Voeltz, G. K. Here, there, and everywhere: The importance of ER membrane contact sites. Science. 361 (6401), (2018).
- Vance, J. E. Inter-organelle membrane contact sites: implications for lipid metabolism. Biology Direct. 15 (1), 24(2020).
- Stefan, C. J. Endoplasmic reticulum-plasma membrane contacts: Principals of phosphoinositide and calcium signaling. Current Opinion in Cell Biology. 63, 125-134 (2020).
- Zaman, M. F., Nenadic, A., Radojicic, A., Rosado, A., Beh, C. T. Sticking with it: ER-PM membrane contact sites as a coordinating nexus for regulating lipids and proteins at the cell cortex. Frontiers in Cell and Developmental Biology. 8, 675(2020).
- van Vliet, A. R., Sassano, M. L., Agostinis, P. The unfolded protein response and membrane contact sites: tethering as a matter of life and death. Contact. 1, 1-15 (2018).
- Cohen, S., Valm, A. M., Lippincott-Schwartz, J. Interacting organelles. Current Opinion in Cell Biology. 53, 84-91 (2018).
- Hariri, H., et al. Lipid droplet biogenesis is spatially coordinated at ER-vacuole contacts under nutritional stress. EMBO Reports. 19 (1), 57-72 (2018).
- Stefan, C. J., Trimble, W. S., Grinstein, S., Drin, G. Membrane dynamics and organelle biogenesis-lipid pipelines and vesicular carriers. BMC Biology. 15 (1), 102(2017).
- Eisenberg-Bord, M., Shai, N., Schuldiner, M., Bohnert, M. A tether is a tether is a tether: tethering at membrane contact sites. Developmental Cell. 39 (4), 395-409 (2016).
- Scorrano, L., De Matteis, M. A., Emr, S., Giordano, F. Coming together to define membrane contact sites. Nature Communications. 10 (1), 1287(2019).
- Lak, B., Li, S., Belevich, I., Sree, S. Specific subdomain localization of ER resident proteins and membrane contact sites resolved by electron microscopy. European Journal of Cell Biology. 100 (7), 151180(2021).
- Collado, J., Kalemanov, M., Campelo, F., Bourgoint, C. Tricalbin-mediated contact sites control ER curvature to maintain plasma membrane integrity. Developmental Cell. 51 (4), 476-487 (2019).
- West, M., Zurek, N., Hoenger, A., Voeltz, G. K. A 3D analysis of yeast ER structure reveals how ER domains are organized by membrane curvature. Journal of Cell Biology. 193 (2), 333-346 (2011).
- Ilacqua, N., Anastasia, I., Raimondi, A., Lemieux, P. A three-organelle complex made by wrappER contacts with peroxisomes and mitochondria responds to liver lipid flux changes. Journal of Cell Science. 135 (5), 259091(2022).
- Cardona, A., Saalfeld, S., Schindelin, J., Arganda-Carreras, I. TrakEM2 software for neural circuit reconstruction. PLoS One. 7 (6), 38011(2012).
- Stalling, D., Westerhoff, M., Hege, H. -C. Amira: A highly interactive system for visual data analysis. The Visualization Handbook. 38, 749-767 (2005).
- Hsieh, T. S., Chen, Y. J., Chang, C. L., Lee, W. R., Liou, J. Cortical actin contributes to spatial organization of ER-PM junctions. Molecular Biology of the Cell. 28 (23), 3171-3180 (2017).
- Anastasia, I., Ilacqua, N., Raimondi, A., Lemieux, P. Mitochondria-rough-ER contacts in the liver regulate systemic lipid homeostasis. Cell Reports. 34 (11), 108873(2021).
- Cattin, A. L., Burden, J. J., Van Emmenis, L., Mackenzie, F. E. Macrophage-Induced Blood Vessels Guide Schwann Cell-Mediated Regeneration of Peripheral Nerves. Cell. 162 (5), 1127-1139 (2015).
- Lopes-da-Silva, M., et al. A GBF1-dependent mechanism for environmentally responsive regulation of ER-Golgi transport. Developmental Cell. 49 (5), 786-801 (2019).
- Banushi, B., Forneris, F., Straatman-Iwanowska, A., Strange, A. Regulation of post-Golgi LH3 trafficking is essential for collagen homeostasis. Nature Communications. 7, 12111(2016).
- Rey, S. A., et al. Ultrastructural and functional fate of recycled vesicles in hippocampal synapses. Nature Communications. 6, 8043(2015).
- Belicova, L., Repnik, U., Delpierre, J., Gralinska, E. Anisotropic expansion of hepatocyte lumina enforced by apical bulkheads. Journal of Cell Biology. 220 (10), 202303003(2021).
- Kizilyaprak, C., Daraspe, J., Humbel, B. M. Focused ion beam scanning electron microscopy in biology. Journal of Microscopy. 254 (3), 109-114 (2014).
- Xu, C. S., Hayworth, K. J., Lu, Z., Grob, P. Enhanced FIB-SEM systems for large-volume 3D imaging. Elife. 6, 1-36 (2017).
- Parlakgül, G., Arruda, A. P., Cagampan, E., Pang, S. High resolution 3D imaging of liver reveals a central role for subcellular architectural organization in metabolism. bioRxiv. , (2020).
- Guerin, C. J., Kremer, A., Borghgraef, P., Lippens, S. Targeted studies using serial block face and focused ion beam scan electron microscopy. The Journal of Visualized Experiments: JoVE. (150), e59480(2019).
- Kremer, A., et al. A workflow for 3D-CLEM investigating liver tissue. Journal of Microscopy. 281 (3), 231-242 (2021).
- Hayat, M. Principles and techniques of electron microscopy: biological applications. , Cambridge University Press. (2000).
- Wisse, E., Braet, F., Duimel, H., Vreuls, C. Fixation methods for electron microscopy of human and other liver. World Journal of Gastroenterology. 16 (23), 2851-2866 (2010).
- Hanley, J., Dhar, D. K., Mazzacuva, F., Fiadeiro, R. Vps33b is crucial for structural and functional hepatocyte polarity. Journal of Hepatology. 66 (5), 1001-1011 (2017).
- Deerinck, T. J., Bushong, E. A., Thor, A., Ellisman, M. H. NCMIR methods for 3D EM: a new protocol for preparation of biological specimens for serial block face scanning electron microscopy. Microscopy. 1, 6-8 (2010).
- Miranda, K., Girard-Dias, W., Attias, M., de Souza, W., Ramos, I. Three dimensional reconstruction by electron microscopy in the life sciences: An introduction for cell and tissue biologists. Molecular Reproduction and Development. 82 (7-8), 530-547 (2015).
- Yamaguchi, M., Chibana, H. A method for obtaining serial ultrathin sections of microorganisms in transmission electron microscopy. The Journal of Visualized Experiments: JoVE. (131), e56235(2018).
- Hall, D. H., Hartwieg, E., Nguyen, K. C. Modern electron microscopy methods for C. elegans. Methods in Cell Biology. 107, 93-149 (2012).
- Hagler, H. K. Ultramicrotomy for biological electron microscopy. Methods in Molecular Biology. 369, 67-96 (2007).
- Arganda-Carreras, I., et al. Consistent and elastic registration of histological sections using vector-spline regularization. Computer vision approaches to medical image analysis, CVAMIA 2006, Lecture Notes in Computer Science. Beichel, R. R., Sonka, M., et al. 4241, Springer Berlin Heidelberg. Berlin, Heidelberg. 85-95 (2006).
- Belevich, I., Joensuu, M., Kumar, D., Vihinen, H., Jokitalo, E. Microscopy image browser: a platform for segmentation and analysis of multidimensional datasets. PLoS Biology. 14 (1), 1002340(2016).
- Fiala, J. C. Reconstruct: a free editor for serial section microscopy. Journal of Microscopy. 218, 52-61 (2005).
- Kremer, J. R., Mastronarde, D. N., McIntosh, J. R. Computer visualization of three-dimensional image data using IMOD). Journal of Structural Biology. 116 (1), 71-76 (1996).
- Iudin, A., Korir, P. K., Salavert-Torres, J., Kleywegt, G. J., Patwardhan, A. EMPIAR: a public archive for raw electron microscopy image data. Nature Methods. 13 (5), 387-388 (2016).
- Xu, C. S., Pang, S., Shtengel, G., Muller, A. An open-access volume electron microscopy atlas of whole cells and tissues. Nature. 599 (7883), 147-151 (2021).
- Karabag, C., et al. Semantic segmentation of HeLa cells: An objective comparison between one traditional algorithm and four deep-learning architectures. PLoS One. 15 (10), 0230605(2020).
- Heinrich, L., Bennett, D., Ackerman, D., Park, W. Whole-cell organelle segmentation in volume electron microscopy. Nature. 599 (7883), 141-146 (2021).
- Kim, J. S., Greene, M. J., Zlateski, A., Lee, K. Space-time wiring specificity supports direction selectivity in the retina. Nature. 509 (7500), 331-336 (2014).
- Spiers, H., Songhurst, H., Nightingale, L., de Folter, J. Deep learning for automatic segmentation of the nuclear envelope in electron microscopy data, trained with volunteer segmentations. Traffic. 22 (7), 240-253 (2021).
- Hasan, N. M., Gupta, A., Polishchuk, E., Yu, C. H. Molecular events initiating exit of a copper-transporting ATPase ATP7B from the trans-Golgi network. The Journal of Biological Chemistry. 287 (43), 36041-36050 (2012).
- Stoeck, I. K., Lee, J. Y., Tabata, K., Romero-Brey, I. Hepatitis C virus replication depends on endosomal cholesterol homeostasis. The Journal of Virology. 92 (1), 01196(2018).
- Ma, X., Qian, H., Chen, A., Ni, H. M., Ding, W. X. Perspectives on mitochondria-ER and mitochondria-lipid droplet contact in hepatocytes and hepatic lipid metabolism. Cells. 10 (9), 2273(2021).
Access restricted. Please log in or start a trial to view this content.
Przedruki i uprawnienia
Zapytaj o uprawnienia na użycie tekstu lub obrazów z tego artykułu JoVE
Zapytaj o uprawnieniaPrzeglądaj więcej artyków
This article has been published
Video Coming Soon
Copyright © 2025 MyJoVE Corporation. Wszelkie prawa zastrzeżone