
A subscription to JoVE is required to view this content. Sign in or start your free trial.
Method Article
Laboratory Production of Biofuels and Biochemicals from a Rapeseed Oil through Catalytic Cracking Conversion
In This Article
Summary
This paper presents an experimental method to produce biofuels and biochemicals from canola oil mixed with a fossil-based feed in the presence of a catalyst at mild temperatures. Gaseous, liquid, and solid products from a reaction unit are quantified and characterized. Conversion and individual product yields are calculated and reported.
Abstract
The work is based on a reported study which investigates the processability of canola oil (bio-feed) in the presence of bitumen-derived heavy gas oil (HGO) for production of transportation fuels through a fluid catalytic cracking (FCC) route. Cracking experiments are performed with a fully automated reaction unit at a fixed weight hourly space velocity (WHSV) of 8 hr-1, 490-530 °C, and catalyst/oil ratios of 4-12 g/g. When a feed is in contact with catalyst in the fluid-bed reactor, cracking takes place generating gaseous, liquid, and solid products. The vapor produced is condensed and collected in a liquid receiver at -15 °C. The non-condensable effluent is first directed to a vessel and is sent, after homogenization, to an on-line gas chromatograph (GC) for refinery gas analysis. The coke deposited on the catalyst is determined in situ by burning the spent catalyst in air at high temperatures. Levels of CO2 are measured quantitatively via an infrared (IR) cell, and are converted to coke yield. Liquid samples in the receivers are analyzed by GC for simulated distillation to determine the amounts in different boiling ranges, i.e., IBP-221 °C (gasoline), 221-343 °C (light cycle oil), and 343 °C+ (heavy cycle oil). Cracking of a feed containing canola oil generates water, which appears at the bottom of a liquid receiver and on its inner wall. Recovery of water on the wall is achieved through washing with methanol followed by Karl Fischer titration for water content. Basic results reported include conversion (the portion of the feed converted to gas and liquid product with a boiling point below 221 °C, coke, and water, if present) and yields of dry gas (H2-C2's, CO, and CO2), liquefied petroleum gas (C3-C4), gasoline, light cycle oil, heavy cycle oil, coke, and water, if present.
Introduction
There is strong global interest in both the private and public sectors to find efficient and economic means to produce transportation fuels from biomass-derived feedstocks. This interest is driven by a general concern over the substantial contribution of burning petroleum fossil fuels to greenhouse gas (GHG) emissions and its associated contribution to global warming. Also, there is strong political will in North America and Europe to displace foreign-produced petroleum with renewable domestic liquid fuels. In 2008, biofuels provided 1.8% of the world's transportation fuels1. In many developed countries, it is required that biofuels replace from 6% to 10% of petroleum fuels in the near future2. In Canada, regulations require an average renewable fuel content of 5% in gasoline starting December 15, 20103. The Renewable Energy Directive (RED) in Europe has also mandated a 10% renewable energy target for the European Union transport sector by 20204.
The challenge has been to develop and demonstrate a viable economic pathway to produce fungible transportation fuels from biomass. Biological sources include triglyceride-based biomass such as vegetable oils and animal fats, as well as waste cooking oil and cellulosic biomass such as wood chips, forest wastes, and agriculture residues. Over the past two decades, research has focused on the evaluation of biomass-derived oil processing using conventional fluid catalytic cracking (FCC)5-12, a technology responsible for producing most of the gasoline in a petroleum refinery. Our novel approach in this study is to co-process canola oil mixed with oil sands bitumen-derived feedstock. Normally, bitumen must be upgraded prior to refining, producing refinery feedstocks such as synthetic crude oil (SCO)—this processing route is particularly energy intensive, accounting for 68-78% of the GHG emissions from the SCO production13 and, in 2011, constituting 2.6% of Canada's total GHG emissions14. Replacing a portion of upgraded HGO with biofeed would reduce GHG emissions, since biofuel production involves a much smaller carbon footprint. Canola oil is chosen in this work because it is abundant in Canada and the US. This feedstock possesses a density and viscosity similar to those of HGOs while the contents of sulfur, nitrogen, and metals that could affect FCC performance or product quality are negligible. Moreover, this co-processing option offers significant technological and economic advantages as it would allow utilization of the existing refinery infrastructure and, hence, would require little additional hardware or modification of the refinery. In addition, there may be potential synergy that could result in product quality improvement when co-processing a highly aromatic bitumen feed with its straight-chain biomass counterpart. However, co-processing involves important technical challenges. These include the unique physical and chemical characteristics of bio-feeds: high oxygen content, paraffinic-rich composition, compatibility with petroleum feedstocks, fouling potential, etc.
This study provides a detailed protocol for the production of biofuels at laboratory scale from canola oil through catalytic cracking. A fully automated reaction system – referred to in this work as the laboratory test unit (LTU)15 – is used for this work. Figure 1 shows schematically how this unit operates. This LTU has become the industry standard for laboratory FCC studies. The objective of this study is to test the suitability of the LTU for cracking canola oil to produce fuels and chemicals with the goal of mitigating GHG emissions.

Figure 1: Conceptual illustration of the reactor. Illustration showing flow lines of the catalyst, feed, product, and diluent. Please click here to view a larger version of this figure.
Protocol
Caution: Please consult all relevant material safety data sheets (MSDS) before using the materials. Work with crude oil samples should only be done while wearing proper personal protective equipment (safety glasses, gloves, pants, closed-toe shoes, lab coat), and the opening, transfer and handling of crude samples should occur in a vented fumehood. Heated hydrocarbons can be flammable in air, and the reaction system should be carefully leak-checked prior to use with crude oil mixtures. The reactor can reach temperatures as high as 750 °C, and high-temperature safety gloves should be used when working near hot surfaces.
1. General Considerations
- To make the best use of the automated reaction unit, which can complete six consecutive runs over ~8 hr, choose a constant feed rate of 1.2 g/min. This sets the weight hourly space velocity (WHSV) to 8 hr-1 through the relationship WHSV=60/[(C/O)×t]=60×(O/t)/C where t is the feed delivery time in minutes and C and O are masses of catalyst and feed, respectively, in grams. By changing the feed injection time, a set of catalyst/oil mass ratios of 4, 6, 8, 10, and 11.25 (x2) was attained for each reaction temperature in order to achieve a wide range of conversion.
2. Feedstock and Catalyst Preparation
- Obtain an HGO by distilling off the -343 °C fraction (by spinning band) of a synthetic crude oil (SCO).
- Purchase edible-grade canola oil from a local food store, and use without further treatment.
- Prepare a 15 v% canola blend by mixing 79.645 g of HGO (0.9370 g/ml density) with 13.7535 g canola oil (0.9169 g/ml density).
- Screen the equilibrium catalyst using a 60 Tyler mesh sieve (250 µm opening), followed by a second screening with a 400 Tyler mesh sieve (38 µm opening).
- Calcine the on-size particles (38-250 µm) at 600 °C for 4 hr, then load them into the six hoppers of the automated reaction unit.
3. Test Procedure
- System Preparation
- Program Preparation
- Using the software that controls the reaction unit, open the window for run conditions.
- Type in the identifications of the feed and catalyst, the barometric pressure, the injection time, and the temperature set points for the feed system, the reactor, the product line, the coolant, and the CO catalytic converter in each step of the run period.
- Catalyst Preparation
- For each catalyst glass hopper above the process tubing, remove the lid and charge 9 g of calcined on-size catalyst into the hopper. Attach an O-ring to the top of the hopper and re-clamp its lid.
- Calibration of Feed Rate
- Set the oil feed pump to deliver feed at a constant feed injection rate (1.2 g/min) for all the cracking runs.
- Disconnect the oil feed line below the purge valve (KV-114)16 and attach a short temporary tube to the bottom of the valve for oil delivery into a tared beaker.
- Preheat the feedstock to 85 °C to enable the HGO-blend to flow easily in and out of the syringe and along the feed line.
- Set the injection time for calibrating the pump to the same value as that for the first run in the series (default setting).
- Tare a beaker, and place it at the discharge of the short temporary tubing. Start the preset "PUMPCAL" user program17 in the reaction unit software.
- After the PUMPCAL program is complete, remove and weigh the beaker containing the feed. Divide the mass of feed delivered into the beaker by the injection time to obtain the feed rate.
- Adjust the pump speed to higher or lower (using the three-digit dial on the pump) and repeat steps 3.1.3.5 to 3.1.3.6 until the desired feed rate is attained.
- Remove the short temporary tube and re-connect the feed line.
- Calibration of GC for Gas Analysis
Note: This step is necessary if the GC for gas analysis is found to be out of calibration, which can be inferred from reference checks, data trending, and material balance. Experience indicates that the GC calibration can be relied on for an extended period.- Connect a cylinder of commercial multicomponent refinery gas standard to the hand valve (HV-190)16.
- Load a method in the GC software that is capable of eluting and separating all the peaks in the refinery gas standard. Use the parameters for the GC method in Table 1.
- Using the GC software, perform an analysis run of the refinery gas standard.
- Open the chromatogram of the refinery gas standard and integrate the peaks in the chromatogram.
- Identify the peaks in the chromatogram, ensuring that all of the components in the calibration gas are found. Delete any peaks that are present but cannot be attributed to the components in the standard.
- Based on retention time ranges, lump and divide compounds eluting after C5 into C6+1, C6+2, C6+3, and C6+4 groups. For this method, lump pentene isomers into one C5 olefin group.
- Using the GC software, assign concentration values to each integrated peak from the gas standard, under the Calibration function.
- Save the calibration into the method file, for use to determine the concentrations of peaks in subsequent test runs. Disconnect the commercial gas standard.
- Calibration of CO2 Analyzer
- Through the reaction unit software, switch the valve (KV-170)16 to the position that enables the zero gas (nitrogen) to flow to the IR gas analyzer. Adjust the flow by turning the knob in association with the flow control valve (FCV-107)16, if necessary, to get about 250 sccm on the flow indicator (FI-107)16.
- Zero the analyzer using the Zero adjustment screw on the front panel of the analyzer with the help of a flat-bladed screwdriver.
- Switch the hand valve (HV-107)16 to supply the CO2 (19.8 mole%) standard gas to the analyzer. Adjust the manual valve (MV-107)16 to obtain a flow of approximately 250 sccm on the flow indicator (FI-107).
- Adjust the analyzer reading to match the concentration (19.8 mole%) of the standard span gas using the SPAN screw on the front panel.
- Disconnect the span gas and return the hand valve (HV-107) to the RUN position.
- Preparation of Liquid Product Receiver
Note: Each receiver consists of a condenser and a GC vial connected to the bottom of the condenser by a short piece of silicone tubing.- Sequentially assign numbers to the condensers and GC vials.
- Place a small plug of glass wool inside the top of each receiver outlet arm as shown in Figure 2.
- Keep the receiver upright with some support in a beaker or a flask of suitable size. Weigh each receiver in an analytical balance the top window of which is covered by a cubic plastic shield to ensure a draft-free environment (Figure 3).
- Record the dry mass (Wbefore) of the prepared receiver together with labeled stoppers.
- Install and connect the weighed receiver to the product line (Figure 4).
- Reactor Preparation
- Install an oil feed line in the reactor with a length that allows for a 1.125 inch injector height.
- Place a filter at the exit of the reactor to prevent any catalyst dust from entering the product line, changing the filter after 50-100 runs.
- Perform a pressure test on the reactor system by running the program PTEST117 after feed pump calibration and installation of the receivers. Close the gas vent and pressurize the reactor system with 150 mmHg nitrogen, followed by isolation of the system.
- Observe the pressure reading for a few minutes to ensure the pressure drop is no more than 0.4 mmHg per min indicating that no leaks are present. If a pressure drop of greater than 0.4 mmHg per min is observed, perform a leak test according to the manufacturer's instructions, and remedy any leaks accordingly.
- Program Preparation
| Sample inlet T | 90 °C | Post run pressure | 30 psi | |
| Injector T | 90 °C | Pressure equilibration | 10 sec | |
| Run time | 300 sec | Detectors | Thermal Conductivity | |
| Column pressure | 30 psi | Data acquisition rate | 50 Hz | |
| Channel A | Channel B | Channel C | Channel D | |
| Pre-column | PLOT-U; 30 µm × 320 µm × 3 m | PLOT-Q; 10 µm × 320 µm × 1 m | Alumina; 3 µm × 320 µm × 1 m | - |
| Column | Molsieve; 12 µm × 320 µm × 10 m | PLOT-U; 30 µm × 320 µm × 8 m | Alumina; 8 µm × 320 µm × 10 m | OV1; 2 µm × 150 µm × 10 m |
| Carrier gas | Argon | Helium | Helium | Helium |
| Inlet mode | Backflush | Backflush | Backflush | Fixed Volume |
| Column T | 100 °C | 90 °C | 130 °C | 90 °C |
| Injection time | 30 msec | 120 msec | 0 msec | 100 msec |
| Backflush time | 12.5 sec | 5.0 sec | 5.5 sec | - |
Table 1: GC method parameters for analysis of gas produced by the LTU.

Figure 2: Vial attachment to condenser. Photo showing the location of the glass wool plug and the attachment of a GC vial to the condenser with silicone tubing. Please click here to view a larger version of this figure.
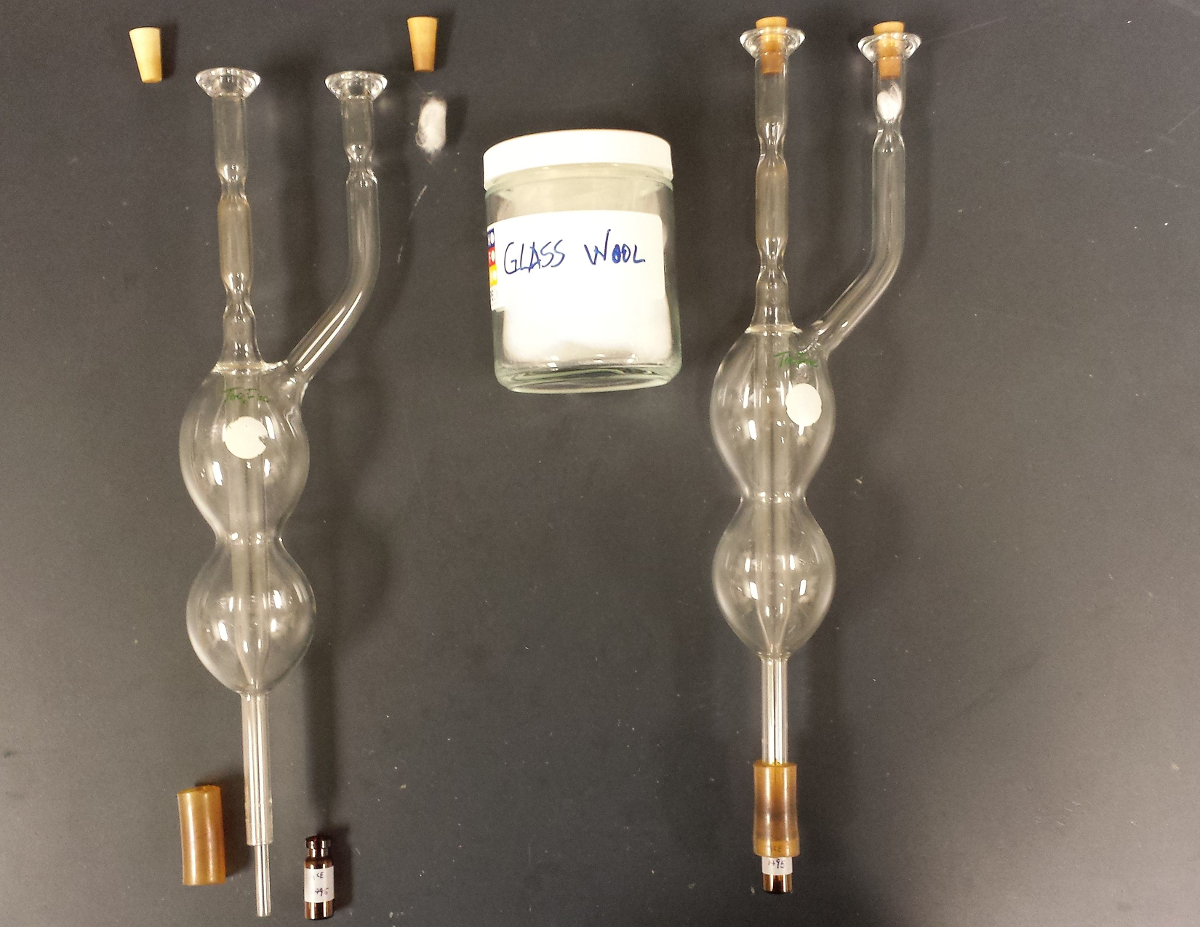

Figure 3: Weighing of product receiver. Plastic cover for the balance to weigh the long liquid product receiver, which may stick out of the top window. Please click here to view a larger version of this figure.
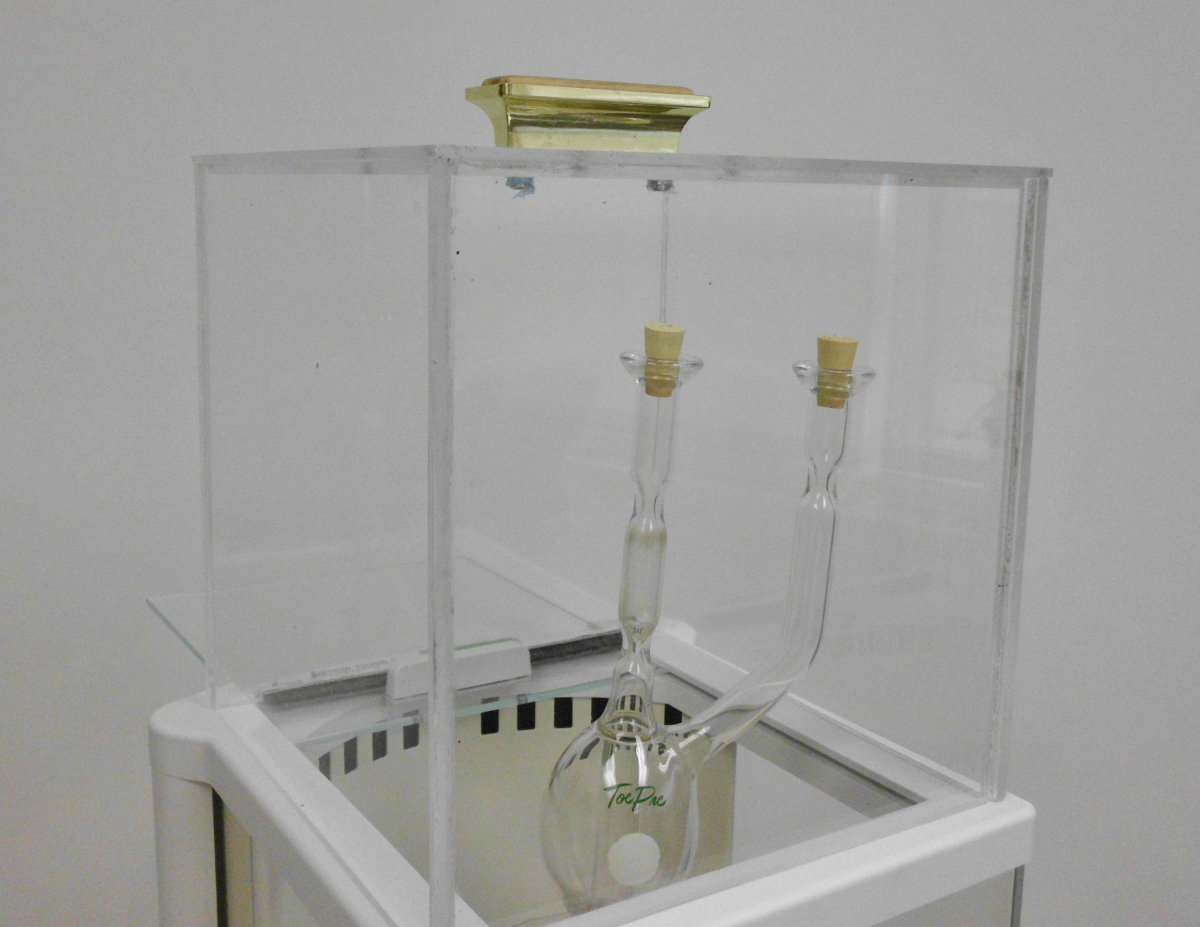

Figure 4: Liquid receiver attachment. Photo showing the attachment of liquid receivers to the product line. Please click here to view a larger version of this figure.
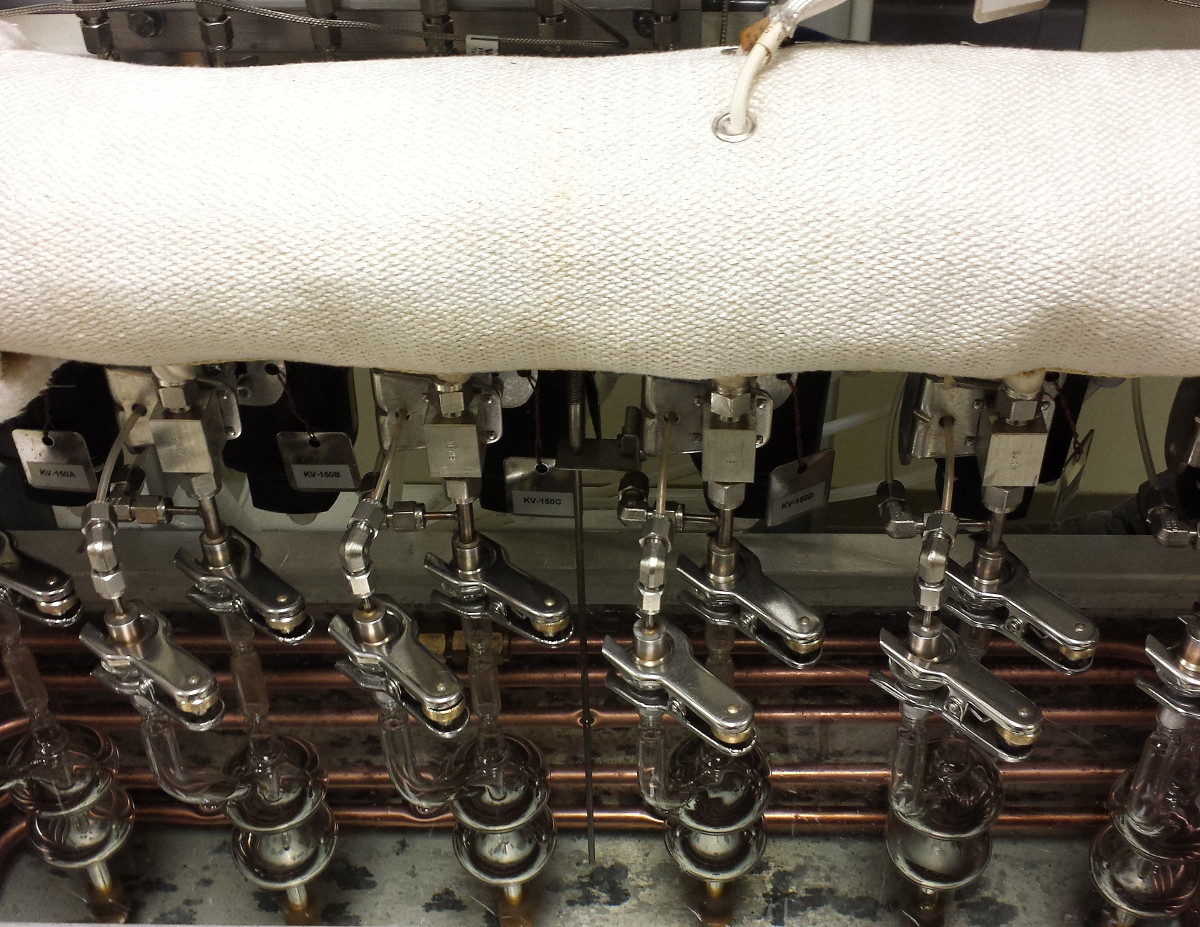
- System Operation in Auto Mode
- On the LTU SETUP screen, input the relevant information for the experiment: run number, feed name, catalyst identification, atmospheric pressure, set points for skin and internal reactor temperatures for both cracking and catalyst regeneration, and oil injection time. Omit this step if full information has been included in Section 3.1.1.
- Place the system into run mode by clicking the "RUN" button on the process flow screen. This initiates the test sequence17, which includes the steps in auto mode to be described in the Discussion.
- Non-Auto Mode System Operation
- Using the computer attached to the GC, integrate the peaks and process the data using the calibration established. Input the final GC data into the LTU program through the LTU computer.
- Post-run Operation
- Mass Determination of Liquid Product
- After removing the clamp, tilt the receiver and collect any liquid product droplets on the beveled metal tip below the product valve.
- Immediately seal the receiver with labeled rubber stoppers and carefully remove it from the bath. Rinse off the ethylene glycol from the bath with cold water and dry the outside with paper towel.
- Place the liquid product receiver on a rack at room temperature for 20 min, allowing any frozen product to thaw and run down into the GC vial at the bottom of the receiver.
- Collect the liquid holdup around the metal joint for the receiver with a tared cotton wool swab. Determine the mass of the liquid holdup (Wswab) and record.
- Open the liquid product receiver to atmosphere in a vented fume hood for pressure equalization by momentarily removing the stopper on the top outlet of the receiver.
- Put the stopper back on and obtain the receiver mass (Wafter). Remove the GC vial from the condenser. Cap and store the product sample in a refrigerator at 4 °C for later analysis.
- If a water droplet appears at the GC vial bottom as in the case of cracking canola oil, use a clean syringe to transfer as much water-free oil product to another vial as possible and cap it immediately.
- Rinse the inner walls of the receiver condenser thoroughly with a small quality of methanol and collect all of the methanol wash into the original GC vial containing the water droplet. Cap the vial and obtain the mass of the liquid inside for use in water determination.
- Analysis of Liquid Product for Simulated Distillation
- Using standard test method ASTM D288718, determine the mass percentage of the water-free liquid product boiling in the ranges of gasoline (IBP-221 °C), light cycle oil (LCO, 221-343 °C), and heavy cycle oil (HCO, 343 °C-FBP).
- Analysis of Water Product
- Using standard test method ASTM D437719, determine the water content (WH2O) of the methanol wash combined with the water droplet in the vial.
- Mass Determination of Liquid Product
- Calculations
- Mass of Gaseous Product
- Calculate the total volume of gaseous product through the volume of water displaced according to the formula:

where Vgas is volume (ml) of gas collected at standard conditions (0 K and 101.3 kPa), Vwater is volume (ml) of water displaced during the test, T is gas temperature (°C) and P is gas pressure (kPa). - Calculate the mass of each gas component using:

where Wi is mass (g) of the ith gaseous product, Ni is mol% of the ith component in the gas, and Mi is molecular weight of the ith gaseous product. The molecular weight of the C5+ unresolved lump is assumed to be 86. - Calculate the total mass of gaseous product as:

where Wgas is the total mass of gaseous product, and Wi is the mass of the ith gaseous product as calculated in 3.5.1.2.
- Calculate the total volume of gaseous product through the volume of water displaced according to the formula:
- Mass of Liquid Product
- Calculate the total mass of liquid product with:
Wliq = Wafter − Wbefore + Wswab
where Wliq is mass (g) of the liquid product, Wafter is mass (g) of the liquid product receiver after reaction, Wbefore is mass (g) of the liquid product receiver before reaction, and Wswab is mass (g) of the liquid holdup collected on the cotton swab.
- Calculate the total mass of liquid product with:
- Mass of Coke
- Calculate the total mass of coke derived from the LTU using:
Wcoke = Wcarbon × 1.0695
where Wcoke is mass (g) of coke, Wcarbon is mass (g) of carbon, and 1.0695 is the carbon-to-coke factor.
- Calculate the total mass of coke derived from the LTU using:
- Mass Balance (Recovery)
- Calculate the mass balance using
R = (Wgas + Wliq + Wcoke) ÷ Wfeed × 100
where R is recovery (mass% of feed) and Wfeed is mass (g) of the oil feed. R should be in the range of 96 to 102%. If not, reject the test as unsatisfactory.
- Calculate the mass balance using
- Unnormalized Yields and Conversion
Note: Calculate each product yield (mass% feed) according to the formulas given below.- Calculate Dry Gas (H2-C2's, CO, and CO2)
YDG = (WH2 + WC1 + WC2 + WCO + WCO2) ÷ Wfeed × 100
where YDG is unnormalized yield (mass% feed) of the dry gas, WH2 is mass (g) of H2, WC1 is mass (g) of the C1 gas (methane), WC2 is mass (g) of the C2 gas (ethane and ethylene), WCO is mass (g) of CO, and WCO2 is mass (g) of CO2. Note that correction for the minute amount of CO2 dissolved in water is not necessary. - Calculate Liquefied Petroleum Gas (LPG)
YLPG = (WC3 + WC4) ÷ Wfeed × 100
where YLPG is unnormalized yield (mass% feed) of the LPG product, WC3 is mass (g) of the C3 gas (propane and propylene), and WC4 is mass (g) of the C4 gas (butanes and butenes including 1,3-butadiene). - Calculate Gasoline
YGLN = [XGLN × (Wliq − WH2O − Wswab) + WC5+] ÷ Wfeed × 100
where YGLN is unnormalized yield (mass% feed) of gasoline, XGLN (obtained by simulated distillation) is mass fraction of gasoline in the water-free liquid product, WH2O is mass (g) of water in the liquid product, if any, and WC5+ is mass (g) of C5+ product in the gas phase (unresolved C6 plus C6+ lump). - Calculate Light Cycle Oil (LCO)
YLCO = [XLCO × (Wliq − WH2O − Wswab)] ÷ Wfeed × 100
where YLCO is unnormalized yield (mass% of feed) of the LCO product and XLCO (obtained by simulated distillation) is mass fraction of LCO in the water-free liquid product. - Calculate Heavy Cycle Oil (HCO)
YHCO = [XHCO × (Wliq − WH2O − Wswab) + Wswab] ÷ Wfeed × 100
where YHCO is unnormalized yield (mass% feed) of HCO and XHCO (obtained by simulated distillation) is mass fraction of HCO in the water-free liquid product. - Calculate Coke
Ycoke = Wcoke ÷ Wfeed × 100
where Ycoke is unnormalized yield (mass% feed) of coke. - Calculate Water
YH2O = WH2O ÷ Wfeed × 100
where YH2O is unnormalized yield (mass% feed) of water. - Calculate Conversion
CONunnorm = 100 − YLCO − YHCO
where CONunnorm is unnormalized conversion (mass% feed).
- Calculate Dry Gas (H2-C2's, CO, and CO2)
- Normalized Yields and Conversion
Y0i = Yi ÷ R × 100
where Y0i is normalized yield (mass% feed) of the ith product.
CONnorm = 100 − Y0LCO − Y0HCO
where CONnorm is normalized conversion (mass% feed).
- Mass of Gaseous Product
Results
The established protocol has been successfully applied to an oil blend of 15:85 volume ratio (i.e., 14.73:85.27 mass ratio) between canola oil and an SCO-derived HGO20. For practical reasons (cost, availability of canola oil, and possible challenges in commercial operation), the study was focused on feedstock containing 15 v% canola oil addition, although feeds with higher concentrations were also tried. The blend was catalytically cracked at 490-530 °C and 8.0 hr...
Discussion
The protocol described here utilizes cyclic operation of a single reactor containing a batch of fluidized catalyst particles to simulate feed oil cracking and catalyst regeneration. The oil to be cracked is preheated and fed from the top through an injector tube with its tip close to the bottom of the fluid bed. The vapor generated after catalytic cracking is condensed and collected in a receiver, and the liquid product collected is subsequently analyzed for simulated distillation to determine yields of fractions in diff...
Disclosures
The authors declare that they have no competing financial interests.
Acknowledgements
The authors wish to thank the analytical laboratory of the CanmetENERGY Technology Centre for its technical support, and Suncor Energy Inc. for supplying the synthetic crude oil. Partial funding for this study was provided by Natural Resources Canada and government of Canada's interdepartmental Program of Energy Research and Development (PERD) with project ID A22.015. Yi Zhang would like to acknowledge his Natural Sciences and Engineering Research Council (NSERC) of Canada Visiting Fellowship from January 2015 to January 2016.
Materials
| Name | Company | Catalog Number | Comments |
| Advanced Cracking Evaluation (ACE) Unit | Kayser Technology Inc. | ACE R+ 46 | Assembled by Zeton Inc. SN:505-46; consisting of (1) a reactor; (2) catalyst addition system; (3) feed delivery system; (4) liquid collection system; (5) gas collection system; (6) gas analyzing system; (7) catalyst regeneration system; (8) CO catalytic convertor; (9) coke analyzing system |
| Reactor (ACE) | Kayser Technology Inc. | V-105 | A 1.6 cm ID stainless steel tube having a tapered conical bottom and with a diluent (nitrogen) flowing from the bottom to fluidize the catalyst and also serve as the stripping gas at the end of the run |
| Catalyst Addition System (ACE) | Kayser Technology Inc. | Six hoppers (V-120F, with respective valves) for addition of catalyst for up to 6 runs | |
| Feed Delivery System (ACE) | Kayser Technology Inc. | Consisting of feed bottle (V-100), syringe (FS-115), pump (P-100), and injector (with 1.125 inch injector height, i.e., the distance from the lowest point of the conical reactor bottom to the bottom end of the feed injector) | |
| Liquid Collection System (ACE) | Kayser Technology Inc. | Six liquid receivers (V-110F) immersed in a common coolant bath (Ethylene glycol/water mixture in 50:50 mass ratio) at about –15 °C in a large tank (V-145) | |
| Gas Collection System (ACE) | Kayser Technology Inc. | Based on water displacement principle; consisting of gas collection vessel (V-150) with a motor-driven stirrer (MTR-100), and a weight scale (WT-100) for weighing the displaced water collected in a beaker (V-160). | |
| Gas Analyzing System (ACE) | Kayser Technology Inc. | Key element being Agilent micro GC (model 3000A) with four capillary columns equipped with respective thermal conductivity detectors (TCDs) | |
| Catalyst Regeneration System (ACE) | Kayser Technology Inc. | V-105 | Spent catalyst in reactor being burned in situ in air at +700 °C to ensure complete removal of carbon deposited on the catalyst |
| CO Catalytic Convertor (ACE) | Kayser Technology Inc. | A reactor (V-140) with CuO as catalyst to oxidize any CO and hydrocarbons in exhausted flue gas to CO2 (to be analyzed by IR gas analyzer) and H2O (to be absorbed by a dryer) | |
| Coke Analyzing System (ACE) | Kayser Technology Inc. | Servomex (Model 1440C) IR analyzer for measuring CO2 in exhausted flue gas | |
| R+MM Software Suite | Kayser Technology Inc. | Including iFIX 3.5 | |
| Agilent Micro GC | Agilent Technologies | 3000A | For gas analysis after cracking |
| Cerity Networked Data System | Agilent Technologies | Software for Agilent Micro GC | |
| CO2 Gas Analyser | Servomex Inc. | 1440C | SN: 01440C1C02/2900 |
| NESLAB Refrigerated Bath | Themo Electron Corporation | RTE 740 | SN: 104300061 |
| Orion Sage Syringe Pump | Themo Electron Corporation | M362 | For delivering feed oil to injector tube |
| Synthetic Crude Oil (SCO) | Suncor Energy Inc. | Identified as Suncor OSA 10-4.1 | |
| Catalyst P | Petro-Canada Refinery | Equilibrium catalyst | |
| Balance | Mettler Toledo | AB304-S | For weighing liquid product receivers |
| Balance | Mettler Toledo | XS8001S | For weighing water displaced by gas product |
| Ethylene Glycol | Fisher Scientifc Inc. | CAS 107-21-1 | Mixed with distilled water as coolant (50 v% ) |
| Drierite | W.A. Hammond Drierite Co. Ltd. | 24001 | For water absorption after CO catalytic converter |
| Copper Oxide | LECO Corporation | 501-170 | Catalyst for conversion of CO to CO2 |
| Toluene | Fisher Scientific Co. | CAS 108-88-3 | For cleaning liquid receivers |
| Acetone | Fisher Scientific Co. | CAS 67-64-1 | For cleaning liquid receivers |
| Micro GC Calibration Gas | Air Liquid Canada Inc. | SPG-25MX0015306 | Multicomponent standard gas |
| 19.8% CO2 Standard Gas | BOC Canada Ltd. | 24069890 | For calibration of IR analyzer |
| Argon Gas | Linde Canada ltd. | 24001306 | Grade 5.0 Purity |
| Helium Gas | Linde Canada ltd. | 24001333 | Grade 5.0 Purity |
| Gas analyzer GC Module | Inficon | GCMOD-15 | Channel A |
| Gas analyzer GC Module | Inficon | GCMOD-03 | Channel B |
| Gas analyzer GC Module | Inficon | GCMOD-04 | Channel C |
| Gas analyzer GC Module | Inficon | GCMOD-73 | Channel D |
| HP 6890 GC | Hewlett-Packard Co. | G1530A | For simulated distillation |
| ASTM 2887 Standard Sample | PAC L.P. | 26650.150 | For quality control in simulated distillation |
| ASTM 2887 Standard Sample | PAC L.P. | 25950.200 | For calibration in simulated distillation |
| Column for GC 6890 (simulated distillation) | Agilent Technologies | CP7562 | 10 m x 0.53 mm x 1.2 µm, HP 6890 GC column |
| Liquid Nitrogen | Air Liquid Canada Inc. | SPG-NIT1AC240LC | For use in simulated distillation |
| Nitrogen | Air Liquid Canada Inc. | Bulk (building N2) | For use in ACE unit operation |
| Isotemp Programmable Furnace | Thermo Fisher Scientifc Inc. | 10-750-126 | For calcination of catalyst |
| GC Vials, Crimp Top | Chromatograghic Specialties Inc | C223682C | 2 ml, for liquid product |
| Seals, Crimp Top | Chromatograghic Specialties Inc | C221150 | 11 mm, for use with GC vials |
| 4 oz clear Boston round bottles | Fisher Scientific Co. | 02-911-784 | With PE cone lined caps, for use in feed system |
| Sieve | Endecotts Ltd. | 6140269 | Aperture 38 micron |
| Sieve | Endecotts Ltd. | 6146265 | Aperture 250 μm |
| Shaker | Endecotts Ltd. | MIN 2737-11 | Minor-Meinzer 2 Sieve Shaker for catalyst screening |
| V20 Volumetric KF Titrator | Mettler Toledo | 5131025056 | For water content analysis of the liquid product |
| Hydranal Composite 5 | Sigma-Aldrich | 34805-1L-R | Reagent for Karl Fischer titration |
| Methanol (extremely low water grade) | Fisher Scientific Co. | A413-4 | Mixed with toluene (40:60 w/w) for KF titration: also used to recover water in receiver |
| Glass Wool | Fisher Scientific Co. | 11-388 | Placed inside the top of receiver outlet arm |
References
- Bringezu, S., et al. Towards Sustainable Production and Use of Resources - Assessing Biofuels. United Nations Environment Programme. , (2009).
- Sheehan, J., Camobresco, V., Duffield, J., Graboski, M., Shapouri, H. Life cycle inventory for biodiesel and petroleum diesel for use in an urban bus. National Renewable Energy Laboratory Report. , (1998).
- . Renewable Fuels Regulations. Canada Gazette Part II. 144 (18), 1614-1740 (2010).
- . Directive 2009/28/EC of the European Parliament and of the Council of 23 April 2009 on the promotion of the use of energy from renewable sources and amending and subsequently repealing Directives 2001/77/EC and 2003/30/EC (Text with EEA relevance). Official Journal of the European Union. 140, 16-62 (2009).
- Al-Sabawi, M., Chen, J., Ng, S. Fluid catalytic cracking of biomass-derived oils and their blends with petroleum feedstocks: A Review. Energy Fuels. 26 (9), 5355-5372 (2012).
- Dupain, X., Costa, D. J., Schaverien, C. J., Makkee, M., Moulijn, J. A. Cracking of a rapeseed vegetable oil under realistic FCC conditions. Appl. Catal. B: Environ. 72 (1-2), 44-61 (2007).
- Tian, H., Li, C., Yang, C., Shan, H. Alternative processing technology for converting vegetable oils and animal fats to clean fuels and light olefins. Chin J Chem Eng. 16 (3), 394-400 (2008).
- Melero, J. A., Clavero, M. M., Calleja, G., Garcia, A., Miravalles, R., Galindo, T. Production of bio-fuels via the catalytic cracking of mixtures of crude vegetable oils and nonedible animal fats with vacuum gas oil. Energy Fuels. 24 (1), 707-717 (2010).
- Bielansky, P., Reichhold, A., Schönberger, C. Catalytic cracking of rapeseed oil to high octane gasoline and olefins. Chem Eng Process. 49 (8), 873-880 (2010).
- Ng, S. H., Shi, Y., Ding, L., Chen, S. Catalytic cracking of a rapeseed oil for production of transportation fuels and chemicals: Yield structure. 2010 AIChE Annual Meeting. , (2010).
- Bielansky, P., Weinert, A., Schönberger, C., Reichhold, A. Catalytic conversion of vegetable oils in a continuous FCC pilot plant. Fuel Process Technol. 92 (12), 2305-2311 (2011).
- Ng, S. H., Lay, C., Bhatt, S., Freel, B., Graham, R. Upgrading of biomass-derived liquid to clean fuels. 2012 AIChE Annual Meeting. , (2012).
- Ordorica-Garcia, G., Croiset, E., Douglas, P., Elkamel, A., Gupta, M. Modeling the energy demands and greenhouse gas emissions of the Canadian oil sands industry. Energy Fuels. 21 (4), 2098-2111 (2007).
- . . Canada's Emission Trends. , (2013).
- Kayser, J. C. Versatile fluidized bed reactor. US Patent. , (2000).
- . . ACE Operating Manual: PID Drawing No. R+ 101 and 102. , (2007).
- . . System Manual: ACE - Model R+. , (2007).
- . . ASTM D2887-15 Standard test method for boiling range distribution of petroleum fractions by gas chromatography. , (2015).
- . . AASTM D4377-00 Standard test method for water in crude oils by potentiometric Karl Fischer titration. , (2015).
- Ng, S. H., et al. FCC coprocessing oil sands heavy gas oil and canola oil. 1. Yield structure. Fuel. 156, 163-176 (2015).
- Cox, J. D., Wagman, D. D., Medvedev, V. A. . CODATA Key values for thermodynamics. , (1984).
- Ng, S. H., et al. FCC study of Canadian oil-sands derived vacuum gas oils. 1. Feed and catalyst effects on yield structure. Energy Fuels. 16 (5), 1196-1208 (2002).
- Ng, S. H., Dabros, T., Humphries, A. Fluid catalytic cracking quality improvement of bitumen after paraffinic froth treatment. Energy Fuels. 21 (3), 1432-1441 (2007).
- Scherzer, J., Magee, J. S., Mitchell, M. M. Chapter 5, Correlation between catalyst formulation and catalytic properties. Fluid Catalytic Cracking: Science and Technology. , 145-182 (1993).
- Fisher, I. P. Effect of feedstock variability on catalytic cracking yields. Appl. Catal. 65 (2), 189-210 (1990).
- Ng, S. H., et al. Study of Canadian FCC feeds from various origins and treatments. 1. Ranking of feedstocks based on feed quality and product distribution. Energy Fuels. 18 (1), 160-171 (2004).
- Ng, S. H., et al. Study of Canadian FCC feeds from various origins and treatments. 2. Some specific cracking characteristics and comparisons of product yields and qualities between a riser reactor and a MAT unit. Energy Fuels. 18 (1), 172-187 (2004).
- Ng, S. H., et al. Key observations from a comprehensive FCC study on Canadian heavy gas oils from various origins. 1. Yield profiles in batch reactors. Fuel Process Technol. 87 (6), 475-485 (2006).
- Scherzer, J. Octane-enhancing zeolitic FCC catalysts: Scientific and technical aspects. Catalysis Reviews: Science and Engineering. 31 (3), 215-354 (1989).
- . . ASTM D7964/D7964M-14 Standard test method for determining activity of fluid catalytic cracking (FCC) catalysts in a fluidized bed. , (2014).
- . . ASTM D5154-10 Standard test method for determining activity and selectivity of fluid catalytic cracking (FCC) catalysts by Microactivity test. , (2010).
- Moorehead, E. L., McLean, J. B., Cronkright, W. A., Magee, J. S., Mitchell, M. M. Chapter 7, Microactivity evaluation of FCC catalysts in the laboratory: Principles, approaches and applications. Fluid Catalytic Cracking: Science and Technology. , 223-255 (1993).
- Rawlence, D. J., Gosling, K. FCC catalyst performance evaluation. Appl. Catal. 43 (2), 213-237 (1988).
Reprints and Permissions
Request permission to reuse the text or figures of this JoVE article
Request PermissionThis article has been published
Video Coming Soon
Copyright © 2025 MyJoVE Corporation. All rights reserved