
A subscription to JoVE is required to view this content. Sign in or start your free trial.
Method Article
An Aptamer-based Sensor for Unchelated Gadolinium(III)
In This Article
Summary
The use of polydeoxynucleotide (44-mer aptamer) molecules for sensing unchelated gadolinium(III) ion in an aqueous solution is described. The presence of the ion is detected via an increase in the fluorescence emission of the sensor.
Abstract
A method for determining the presence of unchelated trivalent gadolinium ion (Gd3+) in aqueous solution is demonstrated. Gd3+ is often present in samples of gadolinium-based contrast agents as a result of incomplete reactions between the ligand and the ion, or as a dissociation product. Since the ion is toxic, its detection is of critical importance. Herein, the design and usage of an aptamer-based sensor (Gd-sensor) for Gd3+ are described. The sensor produces a fluorescence change in response to increasing concentrations of the ion, and has a limit of detection in the nanomolar range (~100 nM with a signal-to-noise ratio of 3). The assay may be run in an aqueous buffer at ambient pH (~7 - 7.4) in a 384-well microplate. The sensor is relatively unreactive toward other physiologically relevant metal ions such as sodium, potassium, and calcium ions, although it is not specific for Gd3+ over other trivalent lanthanides such as europium(III) and terbium(III). Nevertheless, the lanthanides are not commonly found in contrast agents or the biological systems, and the sensor may therefore be used to selectively determine unchelated Gd3+ in aqueous conditions.
Introduction
The increasing importance of magnetic resonance imaging (MRI) in clinical diagnosis, which is limited by the inherent sensitivity of the technique, has resulted in the rapid growth of research into the development of novel gadolinium-based contrast agents (GBCAs)1. GBCAs are molecules that are administered to improve the image quality, and they typically have the chemical structure of a trivalent gadolinium ion (Gd3+) coordinated to a polydentate ligand. This complexation is of critical importance as unchelated Gd3+ is toxic; it has been implicated in the development of nephrogenic systemic fibrosis in some patients with renal disease or failure2. Consequently, detecting the aqueous free ion is instrumental in ensuring the safety of GBCAs. The presence of unchelated Gd3+ in GBCA solutions often is the result of an incomplete reaction between the ligand and the ion, dissociation of the complex, or displacement by other biological metal cations3.
Among the several techniques currently used for determining the presence of Gd3+, those relying on chromatography and/or spectrometry rank highest in terms of versatility and applicability4. Among their strengths are high sensitivity and accuracy, the ability to analyze various sample matrices (including human serum5, urine and hair6, wastewater7, and contrast agent formulations8), and the simultaneous quantification of multiple Gd3+ complexes (a listing of studies prior to 2013 is described in a comprehensive review by Telgmann et al.)4. The only drawback is that several of these methods require instrumentations (such as inductively coupled plasma-mass spectrometry)4 that some laboratories may not have access to. Within the context of novel GBCA discovery at the research and proof-of-concept levels, a relatively more convenient, rapid, and cost-effective spectroscopic-based method (such as UV-Vis absorption or fluorescence) may serve as a valuable alternative. With these applications in mind, a fluorescent aptamer-based sensor for aqueous Gd3+ was developed9.
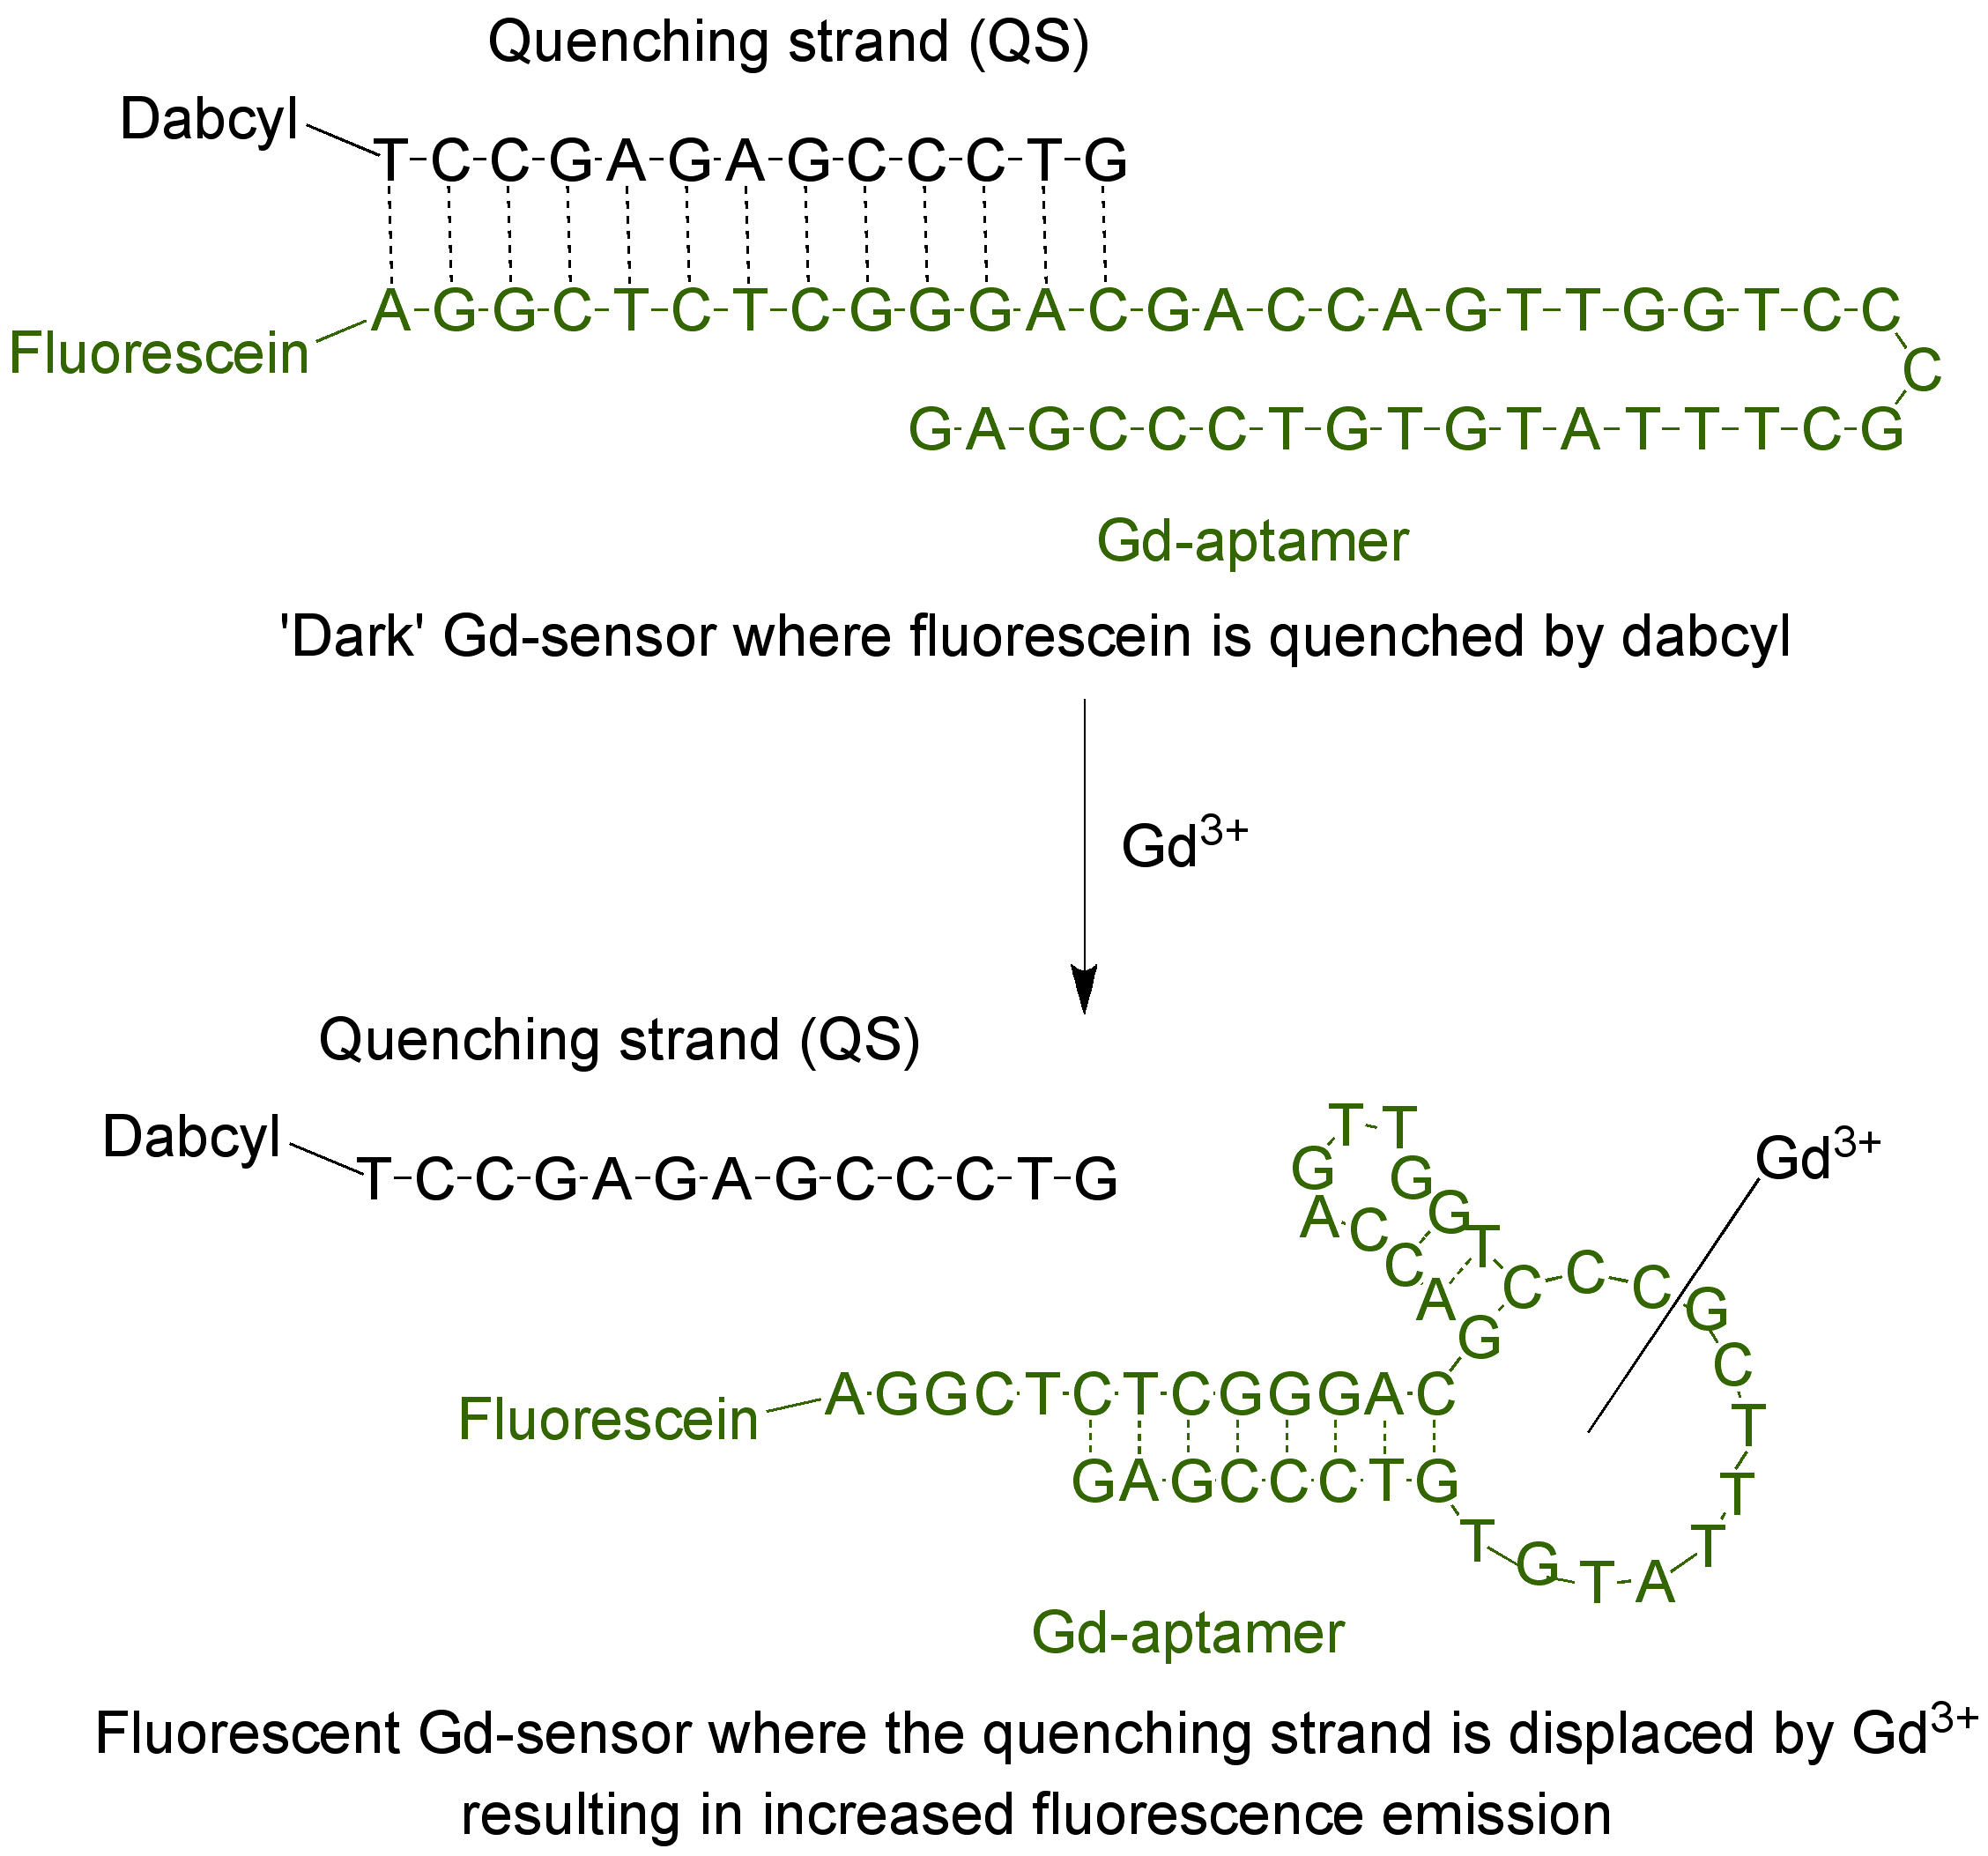
The aptamer (Gd-aptamer) is a 44-base long single-stranded DNA molecule with a specific sequence of bases that was isolated through the process of systematic evolution of ligands by exponential enrichment (SELEX)9. To adapt the aptamer into a fluorescent sensor, a fluorophore is attached to the 5' terminus of the strand, which is then hybridized with a quenching strand (QS) via 13 complementary bases (Figure 1). The QS is tagged with a dark quencher molecule at the 3' terminus. In the absence of Gd3+, the sensor (Gd-sensor), comprised of a 1:2 mole ratio of Gd-aptamer and QS respectively, will have minimal fluorescence emission due to energy transfer from the fluorophore to the quencher. The addition of aqueous Gd3+ will displace the QS from the Gd-aptamer, resulting in an increase in fluorescence emission.

Figure 1. The sensor (Gd-sensor) that consists of the 44-base long aptamer (Gd-aptamer) tagged with fluorescein (a fluorophore) and the 13-base long quenching strand (QS) tagged with dabcyl (a dark quencher). In the absence of unchelated Gd3+, the fluorescence of the sensor is minimal. With addition of Gd3+, displacement of the QS occurs and an increase in fluorescence emission is observed. Please click here to view a larger version of this figure.
There is at present, one commonly used spectroscopic-based method for detecting aqueous Gd3+. This assay uses the molecule xylenol orange, which undergoes a shift in the maximum absorption wavelength from 433 to 573 nm upon chelation to the ion10. The ratio of these two absorbance maxima can be used to quantify the amount of unchelated Gd3+. The aptamer sensor is an alternative (may also be complementary) to the xylenol orange assay, as the two methods have different reaction conditions (such as pH and composition of the buffer solutions used), target selectivities, linear ranges of quantification, and detection modalities9.
Protocol
NOTE: Molecular biology grade water is used in all buffer and solution preparations. All disposable tubes (microcentrifuge and PCR) and pipet tips are DNase- and RNase-free. Please consult the material safety data sheet (MSDS) for all chemicals prior to use. Use of appropriate personal protective equipment (PPE) is strongly recommended.
1. Preparation of the Aptamer Stock Solutions
- Purchase 2 strands of polydeoxynucleotide commercially. Order both strands with purification via high performance liquid chromatography (HPLC).
Strand 1 (Gd-aptamer):
5'-/56-FAM/AGGCTCTCGGGACGACCAGTTGGTCCCGCTTTATGTGTCCCGAG-3'
Strand 2 (QS):
5'-GTCCCGAGAGCCT/3Dab/-3' - Dissolve each strand in water to make 100 μM individual stock solutions of the Gd-aptamer and the QS.
- Store these solutions at -20 °C. The solutions are stable thus far, for 3 years.
- To minimize freeze-thaw cycles, store the stock solutions in 10 μL aliquots.
2. Preparation of the 2x Gd-sensor Solution
- Prepare the assay buffer (20 mM HEPES, 2 mM MgCl2, 150 mM NaCl, 5 mM KCl). Adjust the pH to ~7.4 with NaOH and HCl, and filter through sterile disposable bottle top filters with 0.2 μm PES membrane. Store in sterile bottles. If filtered and stored properly (at room temperature), the buffer is stable thus far, for 2 years.
- Dilute 1 μL of the Gd-aptamer stock solution (from step 1.2) and 2 μL of the QS stock solution (from step 1.2) in 497 μL of the assay buffer. Mix well using a vortex. Their concentrations in the 2x Gd-sensor solution are 200 nM and 400 nM, respectively.
NOTE: The volume of the 2x Gd-sensor solution prepared in this step is 500 μL, which is sufficient to test 6 - 7 varying concentrations of Gd3+ for the calibration curve and the contrast agent solutions (step 3). Each sample will give duplicate wells in a 384-well plate.- Adjust the volume of the 2x Gd-sensor solution according to the number of Gd3+ solutions that needs to be tested.
- Transfer the 2x Gd-sensor solution into 9 PCR tubes, with 50 μL into each tube. Place the tubes in a thermal cycler.
- Set the program in the thermal cycler to heat the solution in the tubes to 95 °C, hold for 5 min, and then slowly cool the solutions to 25 °C over ~15 min (at the rate of ~0.05 - 0.1 °C/s). The heating and cooling cycle is to ensure optimal hybridization between the Gd-aptamer and the QS. Partial hybridization results in incomplete quenching and a higher background fluorescence of the sensor. If a thermal cycler is not available, carry out this process using a hot water bath instead.
- Once cooled to 25 °C, immediately use the solution, or keep in the thermal cycler (up to about 2 h) until ready to be used. When a water bath is used for the heating, leave the tubes in the bath as the water slowly cools to room temperature.
3. Constructing the Fluorescence Calibration Curve and Detecting the Presence of Unchelated Gd3+ in a Solution of Gd Contrast Agent
- Dissolve GdCl3 solid in the assay buffer (the same buffer as in step 2.1).
- Through serial dilution, prepare 100 μL each of 6 different Gd3+ solutions in microcentrifuge tubes at double of the final desired concentrations for the calibration curve (2x solutions).
- For example, to construct a calibration for 0 (buffer only with no GdCl3), 50, 100, 200, 400, and 800 nM of Gd3+, prepare solutions containing 0, 100, 200, 400, 800, and 1,600 nM of the ion. Make sure to always include the 'blank' with 0 nM Gd3+ as the negative control.
- Dissolve the contrast agent to be tested in the assay buffer. Prepare 2 or 3 different concentrations of the contrast agent solutions via serial dilution.
NOTE: Testing 3 different concentrations of the contrast agent solution is recommended. This is to ensure that these concentrations are within the linear range. If the samples tested do not display a linear relationship, reduce the concentrations of the contrast agent used. - Take the PCR tubes containing the 2x Gd-sensor solution from step 2.5 out of the thermal cycler.
- Add 50 μL of each Gd3+ solution from step 3.2 into 6 of the 9 PCR tubes containing the 2x Gd-sensor solution. Mix by pipetting up and down. Each PCR tube now contains the desired concentration of Gd3+ to be tested, 100 nM Gd-aptamer, and 200 nM QS.
- To the remaining PCR tubes containing the 2x Gd-sensor solution, add 50 μL of the contrast agent solutions from step 3.3. Mix well by pipetting up and down a few times.
- Incubate the solutions in the PCR tubes for around 5 min at room temperature. They may be left to stand for up to 30 min.
- Transfer 45 μL of each tube into a 384-well plate. Each PCR tube will give duplicate wells.
- Record the fluorescence of each well on a plate-reader. The fluorophore (FAM) used in the Gd-sensor design has excitation and emission maxima of 495 and 520 nm respectively, as listed on the supplier's website. Choose appropriate excitation and emission wavelengths or filters depending on whether the plate-reader is monochromator- or filter-based.
- Plot the graph of fluorescence in arbitrary fluorescence units (AFU) against concentration of Gd3+.
- Plot the graph as fluorescence fold change against concentration of Gd3+. Calculate the fluorescence fold change by dividing the AFU of each concentration by the AFU of the 'blank' solution (with 0 nM of Gd3+). The fluorescence fold change will allow for the normalization of the results, should the AFU display some periodical (different days, etc.) variations.
- Compare the fluorescence emission of the solution containing the contrast agent and the 'blank', which is the solution containing 0 nM GdCl3 (buffer only).
NOTE: A higher fluorescence of the GBCA solution implies the presence of unchelated Gd3+, which may necessitate further purification of the contrast agent. The amount of unchelated Gd3+ present may be estimated using the calibration curve constructed in step 3.10 or 3.11.
Results
A typical fluorescence change of the Gd-sensor solution in the presence of unchelated Gd3+ is shown in Figure 2. The emission may be plotted as the fluorescence fold change (Figure 2A) or the raw fluorescence reading (Figure 2B) in arbitrary units (AFU). Both plots yield very similar calibration curves with a linear range for concentrations of Gd3+ below 1 μM and saturation of the signal at > 3 μM. The ...
Discussion
Using the aptamer-based Gd-sensor, an increase in fluorescence emission that is proportional to the concentration of unchelated Gd3+ is observed. To minimize the amount of sample used, the assay may be run in a 384-well microplate with a total sample volume of 45 μL per well. In this design, the choice of fluorescein (FAM) and dabcyl (Dab) was primarily based on the cost of the reagents; to modify the emission wavelength, a different pairing of fluorophore and quencher may be used11.
Disclosures
The authors declare that they have no competing financial interests.
Acknowledgements
We would like to gratefully acknowledge Dr. Milan N Stojanovic from Columbia University, New York, NY for valuable scientific input. This work is supported by funding from the California State University East Bay (CSUEB) and the CSUEB Faculty Support Grant-Individual Researcher. O.E., T.C., and A.L. were supported by the CSUEB Center for Student Research (CSR) Fellowship.
Materials
| Name | Company | Catalog Number | Comments |
| Gd-aptamer | IDTDNA | Input sequence and fluorophore modification in the order form | A fluorophore with a different emission wavelength may be used. The aptamer may also be ordered from another company. |
| Quenching strand | IDTDNA | Input sequence and quencher modification in the order form | A different quencher for optimal energy transfer from the fluorophore may be used. The aptamer may also be ordered from another company. |
| Molecular biology grade water | No specific manufacturer, both DEPC or non-DEPC treated work equally well | ||
| Gadolinium(III) chloride anhydrous | Strem | 936416 | Toxic |
| HEPES | Fisher Scientific | BP310-500 | |
| Magnesium chloride anhydrous | MP Biomedicals | 0520984480 - 100 g | |
| Sodium Chloride | Acros Organics | 327300025 | |
| Potassium chloride | Fisher Scientific | P333-500 | |
| Sodium hydroxide, pellets | Fisher Scientific | BP359 | Corrosive |
| Hydrochloric acid | Fisher Scientific | SA49 | Toxic and corrosive |
| 384-well low flange black flat bottom polystyrene NBS plates | Corning | 3575 | Plates which are suitable for fluorescence reading are required. |
| Nalgene Rapid-Flow sterile disposable bottle top filter | Thermo Scientific | 5680020 | The bottle top is fitted with 0.2 micron PES membrane |
| Disposable sterile bottles 250 mL | Corning | 430281 | A larger or smaller bottle may be used |
| 1.5 mL microcentrifuge tubes | No specific manufacturer, as long as they are DNAse and RNAse-free | ||
| 0.2 mL PCR tubes | No specific manufacturer, as long as they are DNAse and RNAse-free | ||
| Micropipets | No specific manufacturer | ||
| Pipet tips (non filter) of appropriate sizes | No specific manufacturer, as long as they are DNAse and RNAse-free | ||
| Equipment | |||
| Plate reader | Biotek Synergy H1 | Plate readers from other manufacturers would work equally well |
References
- Shen, C., New, E. J. Promising strategies for Gd-based responsive magnetic resonance imaging contrast agents. Curr. Opin. Chem. Biol. 17 (2), 158-166 (2013).
- Cheong, B. Y. C., Muthupillai, R. Nephrogenic systemic fibrosis: a concise review for cardiologists. Tex. Heart Inst. J. 37 (5), 508-515 (2010).
- Hao, D., Ai, T., Goerner, F., Hu, X., Runge, V. M., Tweedle, M. MRI contrast agents: basic chemistry and safety. J Magn. Reson. Imaging. 36 (5), 1060-1071 (2012).
- Telgmann, L., Sperling, M., Karst, U. Determination of gadolinium-based MRI contrast agents in biological and environmental samples: a review. Anal. Chim. Acta. 764, 1-16 (2013).
- Frenzel, T., Lengsfeld, P., Schirmer, H., Hütter, J., Weinmann, H. -. J. Stability of gadolinium-based magnetic resonance imaging contrast agents in human serum at 37 degrees C. Invest. Radiol. 43 (12), 817-828 (2008).
- Loreti, V., Bettmer, J. Determination of the MRI contrast agent Gd-DTPA by SEC-ICP-MS. Anal. Bioanal. Chem. 379 (7), 1050-1054 (2004).
- Telgmann, L., et al. Speciation and isotope dilution analysis of gadolinium-based contrast agents in wastewater. Environ. Sci. Technol. 46 (21), 11929-11936 (2012).
- Cleveland, D., et al. Chromatographic methods for the quantification of free and chelated gadolinium species in MRI contrast agent formulations. Anal. Bioanal. Chem. 398 (7), 2987-2995 (2010).
- Edogun, O., Nguyen, N. H., Halim, M. Fluorescent single-stranded DNA-based assay for detecting unchelated gadolinium(III) ions in aqueous solution. Anal. Bioanal. Chem. 408 (15), 4121-4131 (2016).
- Barge, A., Cravotto, G., Gianolio, E., Fedeli, F. How to determine free Gd and free ligand in solution of Gd chelates. A technical note. Contrast Med. Mol. Imaging. 1 (5), 184-188 (2006).
- Johansson, M. K. Choosing reporter-quencher pairs for efficient quenching through formation of intramolecular dimers. Methods Mol. Biol. 335, 17-29 (2006).
- Sherry, A. D., Caravan, P., Lenkinski, R. E. A primer on gadolinium chemistry. J. Magn. Reson. Imaging. 30 (6), 1240-1248 (2009).
- Shakhverdov, T. A. A cross-relaxation mechanism of fluorescence quenching in complexes of lanthanide ions with organic ligands. Opt. Spectrosc. 95 (4), 571-580 (2003).
- Brittain, H. G. Submicrogram determination of lanthanides through quenching of calcein blue fluorescence. Anal. Chem. 59 (8), 1122-1125 (1987).
Reprints and Permissions
Request permission to reuse the text or figures of this JoVE article
Request PermissionThis article has been published
Video Coming Soon
Copyright © 2025 MyJoVE Corporation. All rights reserved