
A subscription to JoVE is required to view this content. Sign in or start your free trial.
Method Article
Quantifying Infra-slow Dynamics of Spectral Power and Heart Rate in Sleeping Mice
In This Article
Summary
Here, we present experimental and analytical procedures to describe the temporal dynamics of the neural and cardiac variables of non-REM sleep in mice, which modulate sleep responsiveness to acoustic stimuli.
Abstract
Three vigilance states dominate mammalian life: wakefulness, non-rapid eye movement (non-REM) sleep, and REM sleep. As more neural correlates of behavior are identified in freely moving animals, this three-fold subdivision becomes too simplistic. During wakefulness, ensembles of global and local cortical activities, together with peripheral parameters such as pupillary diameter and sympathovagal balance, define various degrees of arousal. It remains unclear the extent to which sleep also forms a continuum of brain states-within which the degree of resilience to sensory stimuli and arousability, and perhaps other sleep functions, vary gradually-and how peripheral physiological states co-vary. Research advancing the methods to monitor multiple parameters during sleep, as well as attributing to constellations of these functional attributes, is central to refining our understanding of sleep as a multifunctional process during which many beneficial effects must be executed. Identifying novel parameters characterizing sleep states will open opportunities for novel diagnostic avenues in sleep disorders.
We present a procedure to describe dynamic variations of mouse non-REM sleep states via the combined monitoring and analysis of electroencephalogram (EEG)/electrocorticogram (ECoG), electromyogram (EMG), and electrocardiogram (ECG) signals using standard polysomnographic recording techniques. Using this approach, we found that mouse non-REM sleep is organized into cycles of coordinated neural and cardiac oscillations that generate successive 25-s intervals of high and low fragility to external stimuli. Therefore, central and autonomic nervous systems are coordinated to form behaviorally distinct sleep states during consolidated non-REM sleep. We present surgical manipulations for polysomnographic (i.e., EEG/EMG combined with ECG) monitoring to track these cycles in the freely sleeping mouse, the analysis to quantify their dynamics, and the acoustic stimulation protocols to assess their role in the likelihood of waking up. Our approach has already been extended to human sleep and promises to unravel common organizing principles of non-REM sleep states in mammals.
Introduction
Mammalian sleep is a behavioral state of rest and of resilience to environmental stimuli. In spite of this apparent uniformity, polysomnographic and autonomic parameters indicate that sleep moves between qualitatively and quantitatively different neural and somatic states on various temporal and spatial scales1. Over minutes to tens of minutes, the switch between non-REM and REM sleep occurs. Non-REM sleep is accompanied by large-amplitude, low-frequency activity in the EEG, with a spectral peak around ~0.5 - 4 Hz, whereas REM sleep shows regular EEG activity in the theta band (6 - 10 Hz), together with muscle atonia2. Within non-REM sleep, humans cycle through light (S2) and deep slow-wave sleep (SWS). As their naming indicates, these two stages show lower and higher arousal thresholds3,4, respectively, and they differ primarily in the density of low-frequency cortical EEG power, referred to as slow-wave activity (SWA; 0.75 - 4 Hz). Non-uniformity persists throughout individual bouts of S2 and SWS on the minute- to sub-second-timescale, as extensively documented by the variable presence of SWA over the course of a bout5,6, but also by EEG and field potential rhythms at higher frequencies, including spindle waves in the sigma band (10-15 Hz) and gamma rhythms (80 - 120 Hz) (for a review, see7,8,9,10).
Rather than being subtle, these variations do shift the sleeping cortical state in humans to the extremes of the spectrum. For non-REM sleep, these range from a predominance of SWA to states that approximate wake-like activity because they contain a substantial proportion of high-frequency components11,12. In rodents and cats, although non-REM sleep is not subdivided into stages, a brief period called intermediate sleep (IS) emerges prior to REM sleep onset13. During IS, REM sleep features such as hippocampal theta activity and ponto-geniculo-occipital waves initiate, while non-REM sleep signatures, such as spindle waves and SWA, are still present, indicating a mix between the two sleep states14,15. Nevertheless, IS could be functionally distinct because it is modulated by antidepressants16 and through novel object presentation during prior waking17, and it contributes to setting the arousal threshold18. Furthermore, state space plots of EEG and EMG parameters of freely moving rats show a cluster of points14 that is continuous between non-REM sleep, REM sleep, and wakefulness. There are also sporadic declines in SWA, without entering wakefulness or REM sleep, which leads to substantial fluctuations in the relative presence of the low- and high-frequency components during a consolidated non-REM sleep bout14,19,20. Finally, variable ratios of SWA and higher frequency rhythms during non-REM sleep occur not only in time, but also show regional differences in amplitude and synchronization between cortical areas19.
Mammalian non-REM sleep is far from uniform. However, whether such non-uniformity leads to states that differ in function and behavioral attributes is not clear. In several types of sleep disorders, continuous sleep is disrupted by spontaneous awakenings and inappropriate motor behavior. Moreover, spectral analyses show alterations in the relative presence of higher frequencies in the EEG21 and in autonomic parameters, such as rates of breathing and cardiac beating22. The orderly sequence of stable sleep states is thus perturbed, and elements of cortical and/or autonomic arousal intrude in an uncontrolled manner. Therefore, understanding the continuum of sleep states is of possible relevance for disease. Additionally, the perturbance of sleep by environmental noise in urban environments is associated with general health risks, rendering it crucial to identify moments of heightened vulnerability during sleep23.
Behavioral arousal experiments in sleeping humans indicate that it is hardest to wake up from SWA-dominated non-REM sleep (stage S3), whereas light non-REM sleep (stage S2) and REM sleep show comparable and lower arousal thresholds4. The cortical processing of short sound stimuli varies substantially between REM sleep, S2, and S324,25, indicating that state-specific cortical activity patterns modulate the first stages of sensory processing. For non-REM sleep in humans, the propensity to wake up in response to noise varies with the presence of spindle waves and alpha rhythms in the EEG26,27,28. Thalamocortical rhythmicity during spindles is accompanied by enhanced synaptic inhibition at both the thalamic and cortical levels, which is thought to contribute to the attenuation of sensory processing7.
How are noise-resistant and vulnerable periods of sleep organized in time, and what are their determinants? In both mice and human, we recently identified an infra-slow, 0.02-Hz oscillation in neural rhythms. Depending upon the phase of this 0.02-Hz oscillation, mice showed variable reactivity to external stimuli, either waking up or sleeping through the noise. Interestingly, this oscillation was correlated with the rate of the heartbeat, indicating that the autonomic nervous system participates in the modulation of sleep's vulnerability to external stimuli1. Memory-related hippocampal rhythms were also organized within this rhythm, and, most strikingly, its strength correlated with the quality of memory consolidation in humans. The 0.02-Hz oscillation thus appears to be an organizing principle of rodent and human non-REM sleep that modulates both sensitivity to the environment and internal memory processing. This again highlights the need for multiparametric and continuous assessments of sleep states to recognize their functionality and to identify sites of potential vulnerability.
Here, we present a procedure to extract the waveform of these dynamics, including the surgical implantation of mice for combined EEG/ECoG and EMG-ECG measurements, exposure to sensory stimuli, and analysis routines. This procedure provides a basis for viewing sleep as a continuously varying yet highly organized vigilance state during which different fundamental sleep functions are sequentially executed. More generally, the procedure is applicable to approaches aiming to extract the spectral and autonomic features that precede a behavioral outcome during sleep in both health and disease states.
Protocol
All experimental procedures were performed in accordance with the University of Lausanne Animal Care Committee and the Service de la Consommation et des Affaires Vétérinaires of the Canton de Vaud.
1. Surgery for EEG/EMG-ECG Recordings
- Animal housing and selection.
- Keep animals (C57Bl/6J, 7 - 9 weeks, 25 - 30 g) in a 12:12-h dark/light cycle, singly housed, and under standard conditions (40% humidity, 22 °C), with food and water available ad libitum.
- Use only male subjects to avoid all influences of the hormonal cycle on sleep.
- Preparation of electrodes.
- Build EEG/ECoG electrodes (used in step 1.3.11) using ~0.5 cm-long pieces of gold wire (75% Au, 13% Ag, and 12% Cu; diameter: 0.2 mm), each soldered on top of a gold-plated steel screw (3 mm length, 1.1 mm diameter at the base; see Figure 1). Prepare 2 EEG electrodes per animal and clean them in 70% ethanol.
- Prepare EMG-ECG electrodes with 3 - 4 cm-long gold wires (75% Au, 13% Ag, and 12% Cu; diameter: 0.2 mm). Bend the wires at a 90° angle 1 cm from one end and prepare a coil (1 - 2 mm ø) at the other end (Figure 1). Between the two ends, bend the wire to create a small curvature that corresponds to the surface profile of the bone between the cerebellum and lambda.
- Prepare 2 EMG-ECG electrodes per animal.
- Prepare a 6-channel female-to-male head connector (raster: 2.54 mm x 2.54 mm, size: 5 mm x 8 mm x 9 mm, pin size: 5 mm; see Figure 1).
- Cover the connector at the base of both female and male pins with tape.
- Add a small amount of soldering wire to the tips of 4 of the 6 male pins to help with the soldering of the EEG and EMG-ECG electrodes during the surgery (see step 1.3.16).

Figure 1. Schematic Display of the Sites for EEG and EMG Electrode Implantation on the Skull of the Mouse.
Craniotomies #1 and #2 are located ~2 mm lateral to the midline and ~2 mm rostral to bregma. Craniotomies #3 and #4 are located ~2 mm rostral to lambda and are, respectively, 4 and 2 mm lateral to the midline. The two EEG electrodes, made from soldering a gold wire to the top of a gold-plated steel screw (#2 and #4) are on the right hemisphere. The 2 left screws (#1 and #3) serve as supports. Note that EMG-ECG electrodes should not be in contact with these 2 supporting screws. EMG-ECG electrodes are 3 - 4 cm-long gold wires, bent at 90° angles over 1 cm on their rostral ends and coiled (1 - 2 mm ø) on the caudal ends. The 2 EEG and 2 EMG electrodes are connected to the 2 x 3-channel head connector by soldering one wire to one cornered pin, as shown by the dashed lines. Further detailed information on these electrodes and their implantation can be found in 29. Please click here to view a larger version of this figure.
- Implantation surgery.
- Anesthetize the animal in an isoflurane inducing chamber (4 - 5% isoflurane + O2 at 1 - 2 L/min over 3 - 4 min). Inject 5 µg/g carprofen intraperitoneally (i.p.) when removing the mouse from the chamber, prior to stereotaxic fixation.
- Follow standard procedures to fix the mouse on the stereotaxic apparatus. Maintain isoflurane anesthesia through a gas mask (3% isoflurane + O2 during fixation at 1 L/min). Maintain the body temperature throughout the surgery at 37 °C using a heating pad.
- Protect the eyes from drying out by applying vitamin A ointment. Check the level of surgical tolerance of the animal by testing the paw withdrawal reflex.
- Fix the head by positioning the ear bars on the skull with their blunt, reverse ends rather than their tips (without entering the ear canals)29. Position the mouth bar (as usual) to ensure the horizontality of the head.
NOTE: Fixation minimizes damage to the ears, which is important for the acoustic arousal experiments (see section 4 of this procedure). - Monitor the animal's respiration during the procedure, which should remain at ~2 - 3 breaths/2 s. Adjust the isoflurane concentration in the gas dispenser if necessary; it should decrease little by little during the surgery, from 3% during fixation to 1.0 - 1.5% towards the end of the procedure.
- Inject 100 µL of 0.9 % NaCl i.p. once per hr using an ultra-fine insulin syringe to keep the animal hydrated.
- Ensure that the animal's head is lit by a bright light source.
- Clean the area with 70% EtOH and iodine-based disinfectant (wet fur prevents hair from entering the surgical window).
- Lift the skin at the center of the skull with Adson forceps and gently cut the lifted portion of the skin along the midline, from the top of the neck to the level of the eyes, using fine scissors. Remove the scalp (~1 cm anteroposterior, ~0.5 - 0.8 cm lateral).
- Ensure that the window is large enough (towards both sides) to clearly see the bregma and the lambda fissures of the skull. Fix the skin on both sides with bulldog serrefines to ensure access to the bone.
- Remove the conjunctive tissue (periosteum) by carefully scratching with a scalpel. Clean the area with iodine-based disinfectant and dry the skull with an antiseptic swab.
- Using a sharp scalpel blade (size 15), scratch the skull to obtain a cleaned and mattified bone surface. Using only the scalpel tip, scratch a grid-like meshwork of grooves, with a distance of ~1 - 2 mm between the grooves.
NOTE: This improves the attachment of the two-component epoxy glue to the skull at step 1.3.15. - Use a microdrill with a 1/005 drill-size to perform 4 craniotomies (~0.7 mm ø) in the skull at specific locations (Figure 1; also see step 1.3.11.3.). Blow away bone dust using a Pasteur pipette and clean any bleeding with antiseptic swabs.
- If bleeding occurs, ensure that it is stopped completely before resuming the process. Use a hemostatic sponge to accelerate hemostasis.
- Use the two craniotomies on the right hemisphere to insert the screw electrodes (craniotomies #2 and #4).
- Use the two craniotomies on the left hemisphere to insert anchoring screws that will stabilize the implant (craniotomies #1 and #3).
NOTE: To increase stability, up to 4 anchoring screws have been used29.
NOTE: The precise stereotaxic coordinates are: 2 mm from the midline on both hemispheres and 2 mm rostral from bregma (craniotomies #1 and #2), 2 mm rostral from lambda and 4 mm lateral-left from midline (craniotomy #3), 2 mm rostral from lambda and 2 mm lateral-right from midline (craniotomy #4). See Figure 1.
- On the left hemisphere, screw two gold-plated screws through the craniotomies for support.
- Fix the screw in a hemostatic clamp and hold it vertically above the craniotomy. Carefully approach the bottom of the screw on top of the craniotomy. Rotate it while not deviating from the vertical position.
NOTE: Only 1.5 rotations are sufficient to obtain good mechanical stability and high-quality signals while minimizing pressure on the underlying tissue25. - On the right, screw the previously prepared electrodes (described in step 1.2.1.) through the craniotomies.
- Fix the screw in a hemostatic clamp and hold it vertically above the craniotomy. Carefully approach the bottom of the screw on top of the craniotomy. Rotate it while not deviating from the vertical position.
- With the help of forceps, carefully lift the border of the skin from the neck muscles. Insert the EMG-ECG wires, with the coiled ends inside the muscles (left and right). Glue the middle parts to the skull, such that the left EMG-ECG comes out next to the posterior left anchoring screw, while the right EMG-ECG is positioned next to the anterior left anchoring screw.
- To detect ECG signals from the heart during sleep, ensure that the EMG-ECG wires are inserted into the muscle to a depth of ~0.8 - 1 cm, with their loop ends as far from each other as possible.
- Use a spatula covered with two-component epoxy glue to apply the glue to the skull between and around the screws. Let it dry in the light, but protect the eyes of the animal from excessive lightning.
NOTE: The bases of the screws must be covered, and only the wires should be accessible, emerging from the glue. - Make sure that the glue fills the space between the two EMG-ECG electrodes extending from the surface, such that there is no electrical contact between them and the support screws. Pay meticulous care not to glue the skin to the skull; the skin should remain free to move around the glue.
- Cut the EEG and EMG-ECG wires such that they reach ~0.5 mm out of the glue. Solder the four pins at the corner of the connector prepared in step 1.2.3. to the four wires emerging from the glue (Figure 1).
- Try to place the connector pins as closely as possible to minimize the height of the implant; use a small crocodile clamp attached to the stereotactic holder that maintains the position of the connector. Minimize the time in contact with the soldering tip, as this rapidly heats the screws.
- Fill the space between the glue and the connector with dental cement to cover the soldered parts. Create smooth faces and avoid sharp edges that could hurt the animal. Moreover, avoid touching the skin, as this leads to itching.
- Remove the bulldog serrefines. If necessary, close the wound using a sterile suture thread (absorbable suturing fiber) in front and behind the connector, creating simple, interrupted closure patterns and two square knots (5-0 FS-3 needle, 45-cm filament).
- Monitor the animal until it is fully awake. Weigh the animal after the surgery and return it to its home cage for recovery.
- Post-operative care and connection to the system.
- Monitor the animal every day for a week. Look for weight loss, reduced or abnormal activity, and signs of infections. Follow the scoring procedure established by your veterinary authorities.
- 5-6 days after surgery, connect the recording cable to the head connector on the animal, leaving it in its home cage. Wait an additional 4 - 5 days before the start of recording so that the animal is habituated to the condition and sleeps naturally.
2. Basic Scoring of EEG/EMG-ECG Data for Vigilance State Determination
- Record EEG and EMG-ECG data over 48 h with a commercial polysomnographic software (e.g., Somnologica, SleepSign, or Sirenia). Use typical settings, such as 2,000x gain; a 2,000-Hz sampling rate at acquisition, down sampled to 200 Hz after acquisition; and a 0.7-Hz high-pass filter for EEG and a 10-Hz high-pass filter for EMG-ECG.
- Export the data in the ".edf" file format.
- Open the ".edf" files with a custom-written (e.g., in Matlab) software that semi-automatically classifies every 4-s epoch as awake, non-REM sleep, REM sleep, and corresponding artefacts.
NOTE: Alternatively, there are several semi-automated scoring software available. This procedure describes some of the basic steps that must be done to set up scoring with the scoring software used here; other semi-automatic scoring systems might be based on other parameters. - Using the software, separate the ".edf" files in 4 times 12 h of recordings.
- Remove artefacts that arise from EMG -ECG activity present in the EEG signal or from an unassignable behavioral state1,29.
- Calculate the mean of absolute EEG (EEGmean) and EMG (EMGmean) values over the 12 h of recordings from the EEG and the EMG-ECG traces, respectively.
- Identify the mean EEG/EMG values of each 4-s epoch (EEGEpoch/EMGEpoch).
- Classify the epochs as "Wake" when EEGEpoch<EEGmean and EMGEpoch>EMGmean and as "Non-REM sleep" when EEGEpoch>EEGmean and EMGEpoch<EMGmean.
- Classify the epochs that do not satisfy these criteria with a correcting algorithm based on preceding and subsequent epochs.
- Classify the epochs as REM sleep when EEGEpoch<EEGmean and EMGEpoch<EMGmean.
- Refine the critical points, such as transitions from non-REM sleep to wake, REM sleep epochs, and micro-arousals during non-REM sleep. Visually inspect the scoring to ensure proper vigilance state determination29,30.
NOTE: Always perform a final visual inspection and validation of the scoring.
3. Analysis of the Infra-slow Oscillation For EEG And Heartbeats
- For this analysis, select only non-REM sleep bouts lasting ≥ 96 s (i.e., at least 24 epochs of 4 s); see Figure 2.
NOTE: Customized routines are available upon request1.

Figure 2. Determining Sigma Power Dynamics During Undisturbed Non-REM Sleep.
(A) Top, EEG (black) and EMG-ECG (gray) traces during the first 100 min of the light phase in one mouse. Vigilance states are indicated by the colored bar on top of the raw traces. Middle, typical example of a continuous (>96-s) non-REM sleep bout. Bottom, a randomly picked, 16-s interval that illustrates the subdivision into 4-s epochs. The following step of the analysis is shown for these four epochs only, but it is valid for every epoch contained in the bout. (B) Top, four successive FFTs generated from the 4-s epochs shown in the bottom panel of A. The sigma band (10-15 Hz) is shaded in red. Top right, 1-s inset from the last epoch showing the R-waves present in the squared EMG-ECG signal. Bottom, time course of the sigma power extracted from the corresponding spectrum above. The dotted lines illustrate the continuation of the power values prior to and after the four non-REM bouts selected for display. (C) Normalized sigma power (red) and heartbeat (in BPM) (gray) time courses, with the portion illustrated in (B) located between the vertical dashed lines. Below is the corresponding filtered EEG signal in the sigma band (10 - 15 Hz). (D) Result of the FFT computed on the sigma power time course shown in (C), demonstrating a dominant peak at 0.016 Hz. Please click here to view a larger version of this figure.
- Extract the power values for the sigma frequency band (10-15 Hz) spectral power in 4-s bins ( Figure 2A and B) using calculations of fast Fourier transforms (FFT)1.
- Calculate the baseline spectral power for non-REM sleep by averaging the values in each frequency bin for all non-REM sleep epochs (artifacts and epochs of transition between vigilance states are excluded from this averaging). Normalize the sigma power values of each epoch to the mean power of the sigma band during non-REM sleep over the time period of interest. Plot against time (Figure 2C).
- Calculate the FFT of the sigma power time course with Hamming windowing to reveal the oscillatory frequency components of the power dynamics (Figure 2D)1.
- Note that since the non-REM sleep bouts have different durations, the resulting FFTs have different frequency resolutions. Interpolate to adjust the resolution to the highest one obtained from the longest non-REM sleep bout and average the FFTs of all bouts.
- Continue these analyses to describe the phase relationships between the dynamics of EEG and ECG signals.
- Extract the heartbeat data from the squared EMG-ECG signal after 30-Hz high-pass filtering, using appropriate routines for the peak detection of the R wave.
NOTE: Constraining the minimum time interval between two successive R waves to 80 ms helps to avoid the inclusion of occasional artefactual peaks due to muscle twitching1. - Measure the RR intervals and calculate the mean heart rate in beats per minute (BPM) every 4-s bin (Figure 2B and C).
4. Exposure to Noise
- Generate noises (i.e., white noise) through a custom-written software. Set the duration to 20 s and the intensity to 90 dB SPL (measured inside the cage). Play the noises through standard active speakers1.
- After the surgery, during the habituation to the recording condition, play experimental noises randomly, several times throughout the day and at different moments1.
- In the experimental condition (while recording EEG/EMG/ECG data), play noise pseudo-randomly during the first 100 min at light onset (ZT0). To play the noise, fulfill the following conditions1:
- Ensure that the mouse has been in non-REM sleep for > 40 s.
- Ensure that the previous exposure occurred more than 4 min before.
NOTE: This results in ~15 exposures per session.
- Mark the beginning of the recording time and the onset of each noise exposure. Keep the experimenter blind to the spectral composition of non-REM sleep during the procedure.
- Acquire all data with polysomnographic software1,29.
5. Retrospective Analysis of Sleep Based on the Behavioral Outcome During Exposure to Noise
- Manually score EEG/EMG -ECG traces in a 4-s resolution, without knowledge of the noise exposure times1.
- Use a custom-written script to extract the EEG/EMG -ECG/noise exposure data1.
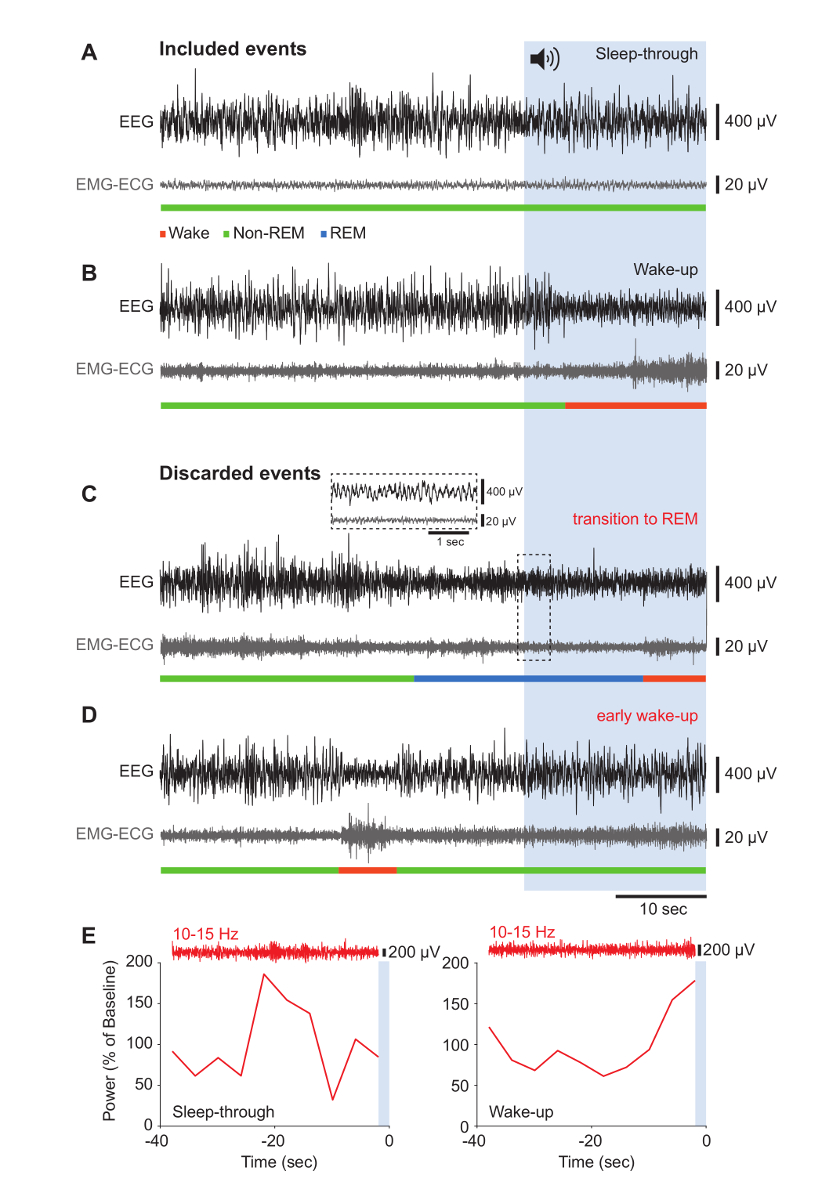
- Score as sleep-through when both EEG and EMG signals remain unaltered during noise exposure (Figure 3A). Consider a wake-up when EEG amplitude decreases and the EEG frequency increases, in combination with detected muscular activity on the EMG-ECG electrode (Figure 3B).
- Discard trials in which animals woke up during the pre-stimulus period or in the first 4 s of noise exposure (Figure 3D).
- Define the arousal success rate as the proportion of wake-up trials within all included trials ("Wake-up" and "Sleep-through").
- In all included trials, examine the dynamics of the sigma power during the pre-stimulus period (Figure 3E)1.

Figure 3. Behavioral Outcomes in Response to Noise Onset: Representative Results that Were Retained or Excluded from Analysis.
(A-D) Raw traces of the EEG (black) and corresponding EMG-ECG (gray) signals for 40 s before noise onset and during the 20 s of noise, represented by the blue-shaded area. Vigilance states are indicated in the color code. To illustrate data that were included in the analysis, representative "Sleep-through" (A) and "Wake-up" (B) events are shown. Results that were discarded contained transitions to REM sleep (C) and a precocious "Wake-up" response (D). The inset shows an expanded portion of EEG and EMG-ECG traces characteristic for REM sleep. (E) Typical examples of sigma power dynamics in the 40-s window before noise onset during a "Sleep-through" (left) and a "Wake-up" (right) event. The raw EEG trace bandpass-filtered for the sigma band is shown above. The blue area represents the noise onset. Please click here to view a larger version of this figure.
Results
Figure 2A (top panel) shows 100-min stretches of spontaneous sleep-wake behavior, recorded through polysomnographic electrodes implanted as described (see Figure 1). The increases and decreases of the EEG and EMG amplitude at non-REM sleep onset are clearly visible. Intermittent REM sleep is marked by a decrease in EEG amplitude and a further decrease in EMG tone that is not visible on this compressed time scale....
Discussion
Here, we show how to establish a continuous temporal profile of non-REM sleep that integrates EEG, EMG, and ECG variables. This is a first step towards developing an integrative description of mouse sleep, which can help to identify the previously unrecognized timescale over which high and low resilience to noise are organized during non-REM sleep1. A similar temporal structure was also described in human non-REM sleep through an analogous analysis1.
Disclosures
The authors declare that they have no competing financial interest.
Acknowledgements
We thank all lab members for their contribution to the writing and careful reading of this manuscript. We are grateful to Paul Franken for stimulating discussions, Dr. Gisèle Ferrand for helpful comments on the surgical protocol, and Dr. Jean-Yves Chatton for providing the original Labview executable files for the noise exposure. Funding was provided by the Swiss National Science Foundation (Grants 31003A_146244 and 31003A_166318) and the Etat de Vaud.
Materials
| Name | Company | Catalog Number | Comments |
| 2-components epoxy glue | Henkel | Loctite EA 3450 | |
| Absorbable Suturing Fiber (Prolene) | Ethicon | 5-0 FS-3 | |
| Adson Forceps | FST | 11006-12 | |
| Antiseptic swab | VWR | 149-0332 | |
| Attane Isoflurane | Piramal | Isoflurane 250mL | |
| Connectors 3 x 2-channels | ENA AG | 2.316 | Raster 2.54 x 2.54 mm; size 5 x 8 x 9 mm; pin size 5 mm; http://www.ena.ch/ |
| Dragonfly commutator | Dragonfly | Model #SL-10 | |
| EMBLA amplifier | EMBLA | A10 amplifier | |
| Fine scissors | FST | 14108-09 | |
| Flat Head Gold-plated steel screw | J.I. Morris | FF00CE125 | https://jimorrisco.com/ |
| Gold wire | CMSA | T.69 5gr | http://www.cmsa.ch/en/ |
| Hemostatic sponge | Pfizer | Gelfoam | |
| iodine-based disinfectant (Betadine) | Mundipharma | standart solution 60mL | |
| Komet drill steel 1/005PM104 | UNOR AG | 22310 | |
| Matlab Analysis Software | MathWorks | R2016b | https://ch.mathworks.com/products/matlab.html |
| Microdrill | Fine Science Tools | 96758 | |
| Mouse Gas Anesthesia Head Holder | Kopf Instruments | Model 923-B | http://kopfinstruments.com/product/model-923-b-mouse-gas-anesthesia-head-holder/ |
| Ophtalmic ointment | Pharmamedica | VITA-POS | |
| Paladur (liquid) | UNOR AG | 2260215 | for dental cement |
| Palavit (powder) | UNOR AG | 5410929 | for dental cement |
| Small Animal Stereotaxic Frame | Kopf Instruments | Model 930 | http://kopfinstruments.com/product/model-930-small-animal-stereotaxic-frame-assembly/ |
| Soldering wire | Stannol | 593072 | |
| Temperature controller - Mini rectal probe | Phymep | 4090502 | http://www.phymep.com/produit/dc-temperature-controller/ |
| Temperature controller- heating pad | Phymep | 4090205 | http://www.phymep.com/produit/dc-temperature-controller/ |
References
- Lecci, S., et al. Coordinated infra-slow neural and cardiac oscillations mark fragility and offline periods in mammalian sleep. Sci Adv. 3 (2), 1602026 (2017).
- Rechtschaffen, A., Kales, A. A manual of standardized terminology, techniques and scoring system for sleep of human subjects. U.S. Department of Health, Education, and Welfare. , (1968).
- Blake, H., Gerard, R. W. Brain potentials during sleep. Am J Physiol. 119, 692-703 (1937).
- Rechtschaffen, A., Hauri, P., Zeitlin, M. Auditory awakening threshold in REM and NREM sleep stages. Percept Mot Skills. 22 (3), 927-942 (1966).
- Achermann, P., Borbély, A. A. Low-frequency (< 1 Hz) oscillations in the human sleep electroencephalogram. Neuroscience. 81 (1), 213-222 (1997).
- Aeschbach, D., Borbély, A. A. All-night dynamics of the human sleep EEG. J. Sleep Res. 2 (2), 70-81 (1993).
- Astori, S., Wimmer, R. D., Lüthi, A. Manipulating sleep spindles--expanding views on sleep, memory, and disease. Trends Neurosci. 36 (12), 738-748 (2013).
- Brown, R. E., Basheer, R., McKenna, J. T., Strecker, R. E., McCarley, R. W. Control of sleep and wakefulness. Physiol Rev. 92 (3), 1087-1187 (2012).
- Buzsáki, G., Wang, X. J. Mechanisms of gamma oscillations. Annu Rev Neurosci. 35, 203-225 (2012).
- Rasch, B., Born, J. About sleep's role in memory. Physiol Rev. 93 (2), 681-766 (2013).
- Halász, P., Bòdizs, R. . Dynamic structure of NREM sleep. , (2013).
- Terzano, M. G., Parrino, L., Spaggiari, M. C. The cyclic alternating pattern sequences in the dynamic organization of sleep. Electroencephalogr Clin Neurophysiol. 69 (5), 437-447 (1988).
- Gottesmann, C. Detection of seven sleep-waking stages in the rat. Neurosci Biobehav Rev. 16 (1), 31-38 (1992).
- Benington, J. H., Kodali, S. K., Heller, H. C. Scoring transitions to REM sleep in rats based on the EEG phenomena of pre-REM sleep: an improved analysis of sleep structure. Sleep. 17 (1), 28-36 (1994).
- Sullivan, D., Mizuseki, K., Sorgi, A., Buzsáki, G. Comparison of sleep spindles and theta oscillations in the hippocampus. J Neurosci. 34 (2), 662-674 (2014).
- Vas, S., et al. Differential adaptation of REM sleep latency, intermediate stage and theta power effects of escitalopram after chronic treatment. J Neural Transm (Vienna). 120 (1), 169-176 (2013).
- Schiffelholz, T., Aldenhoff, J. B. Novel object presentation affects sleep-wake behavior in rats. Neurosci Lett. 328 (1), 41-44 (2002).
- Wimmer, R. D., et al. Sustaining sleep spindles through enhanced SK2-channel activity consolidates sleep and elevates arousal threshold. J Neurosci. 32 (40), 13917-13928 (2012).
- Fernandez, L. M. J., et al. Highly dynamic spatiotemporal organization of low-frequency activities during behavioral states in the mouse cerebral cortex. Cereb Cortex. , (2016).
- Franken, P. Long-term vs. short-term processes regulating REM sleep. J Sleep Res. 11 (1), 17-28 (2002).
- Feige, B., et al. The microstructure of sleep in primary insomnia: an overview and extension. Int J Psychophysiol. 89 (2), 171-180 (2013).
- Parrino, L., Halasz, P., Tassinari, C. A., Terzano, M. G. CAP, epilepsy and motor events during sleep: the unifying role of arousal. Sleep Med Rev. 10 (4), 267-285 (2006).
- Akinseye, O. A., et al. Sleep as a mediator in the pathway linking environmental factors to hypertension: a review of the literature. Int J Hypertens. 2015, 926414 (2015).
- Campbell, K., Muller-Gass, A. The extent of processing of near-hearing threshold stimuli during natural sleep. Sleep. 34 (9), 1243-1249 (2011).
- Nir, Y., Vyazovskiy, V. V., Cirelli, C., Banks, M. I., Tononi, G. Auditory responses and stimulus-specific adaptation in rat auditory cortex are preserved across NREM and REM sleep. Cereb Cortex. 25 (5), 1362-1378 (2015).
- Dang-Vu, T. T., et al. Interplay between spontaneous and induced brain activity during human non-rapid eye movement sleep. Proc Natl Acad Sci USA. 108 (37), 15438-15443 (2011).
- Elton, M., et al. Event-related potentials to tones in the absence and presence of sleep spindles. J Sleep Res. 6 (2), 78-83 (1997).
- McKinney, S. M., Dang-Vu, T. T., Buxton, O. M., Solet, J. M., Ellenbogen, J. M. Covert waking brain activity reveals instantaneous sleep depth. PLoS One. 6 (3), 17351 (2011).
- Mang, G. M., Franken, P. Sleep and EEG phenotyping in mice. Curr Protoc Mouse Biol. 2 (1), 55-74 (2012).
- Borbély, A. A., Tobler, I., Hanagasioglu, M. Effect of sleep deprivation on sleep and EEG power spectra in the rat. Behav Brain Res. 14 (3), 171-182 (1984).
- Jurysta, F., et al. The impact of chronic primary insomnia on the heart rate--EEG variability link. Clin Neurophysiol. 120 (6), 1054-1060 (2009).
- Silvani, A., Calandra-Buonaura, G., Benarroch, E. E., Dampney, R. A. L., Cortelli, P. Bidirectional interactions between the baroreceptor reflex and arousal: an update. Sleep Med. , (2015).
Reprints and Permissions
Request permission to reuse the text or figures of this JoVE article
Request PermissionThis article has been published
Video Coming Soon
Copyright © 2025 MyJoVE Corporation. All rights reserved