A subscription to JoVE is required to view this content. Sign in or start your free trial.
Method Article
Use of Single Molecule Fluorescent In Situ Hybridization (SM-FISH) to Quantify and Localize mRNAs in Murine Oocytes
In This Article
Summary
To reproducibly count the numbers of mRNAs in individual oocytes, single molecule RNA fluorescence in situ hybridization (RNA-FISH) was optimized for non-adherent cells. Oocytes were collected, hybridized with the transcript specific probes, and quantified using an image quantification software.
Abstract
Current methods routinely used to quantify mRNA in oocytes and embryos include digital reverse-transcription polymerase chain reaction (dPCR), quantitative, real-time RT-PCR (RT-qPCR) and RNA sequencing. When these techniques are performed using a single oocyte or embryo, low-copy mRNAs are not reliably detected. To overcome this problem, oocytes or embryos can be pooled together for analysis; however, this often leads to high variability amongst samples. In this protocol, we describe the use of fluorescence in situ hybridization (FISH) using branched DNA chemistry. This technique identifies the spatial pattern of mRNAs in individual cells. When the technique is coupled with Spot Finding and Tracking computer software, the abundance of mRNAs in the cell can also be quantified. Using this technique, there is reduced variability within an experimental group and fewer oocytes and embryos are required to detect significant differences between experimental groups. Commercially available branched-DNA SM-FISH kits have been optimized to detect mRNAs in sectioned tissues or adherent cells on slides. However, oocytes do not effectively adhere to slides and some reagents in the kit were too harsh resulting in oocyte lysis. To prevent this lysis, several modifications were made to the FISH kit. Specifically, oocyte permeabilization and wash buffers designed for the immunofluorescence of oocytes and embryos replaced the proprietary buffers. The permeabilization, washes, and incubations with probes and amplifier were performed in 6-well plates and oocytes were placed on slides at the end of the protocol using mounting media. These modifications were able to overcome the limitations of the commercially available kit, in particular, the oocyte lysis. To accurately and reproducibly count the number of mRNAs in individual oocytes, computer software was used. Together, this protocol represents an alternative to PCR and sequencing to compare the expression of specific transcripts in single cells.
Introduction
Reverse-transcriptase polymerase chain reaction (PCR) has been the gold standard for mRNA quantitation. Two assays, digital PCR (dPCR)1 and quantitative, real time PCR (qPCR)2 are currently used. Of the two PCR techniques, dPCR has greater sensitivity than qPCR suggesting that it could be used to measure mRNA abundance in single cells. However, in our hands, dPCR analysis of low abundance mRNAs in pools of 5 to 10 oocytes per each experimental sample has produced data with low reproducibility and high variation3. This is likely due to the experimental error associated with RNA extraction and reverse transcription efficiency. RNA sequencing has also been performed using a single mouse and human oocytes4,5. This technique requires cDNA amplification steps required for the library generation which likely increases variability within an experimental group. Furthermore, low abundance transcripts may not be detectable. Although sequencing prices have gone down the last few years, it can still be cost prohibitive due to the high cost of bioinformatics analyses. Finally, mRNA localization is a dynamic process with spatial changes contributing to protein function6. Therefore, we set out to adopt a technique that would produce accurate and reproducible quantitative measures and localization of individual mRNAs in single oocytes.
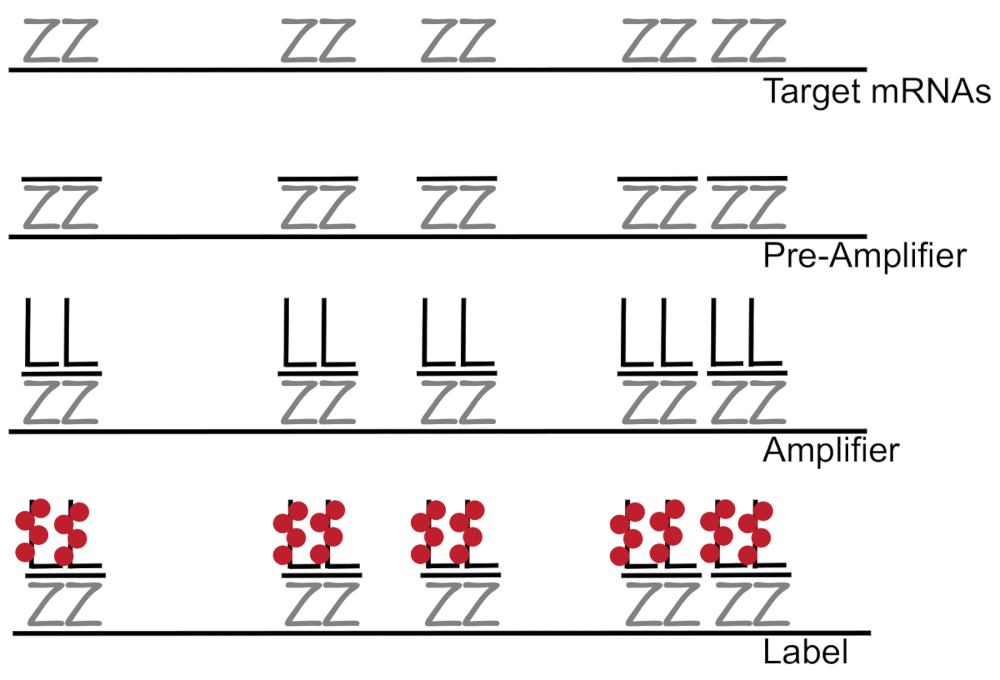
Branched DNA coupled to fluorescence in situ hybridization amplifies fluorescence signal rather than amplifying RNA/cDNA enabling detection of single mRNAs in individual cells 7,8,9. The assay is performed through a series of hybridization, amplification (using branched DNA), and fluorescence labeling steps in order to amplify the fluorescence signal7. The technique begins with binding of 18- to 25-base oligonucleotide probe pairs that are complementary to a specific mRNA3,8,10. Fifteen to twenty probe pairs are designed for each transcript ensuring specificity for the target transcript. The mRNA-specific hybridization is followed by pre-amplifier and amplifier probes that form a branched configuration. Approximately, 400 label fluorophores bind to each amplifier, resulting in an 8000-fold increase in fluorescence allowing detection of individual mRNAs (Figure 1)11.

Figure 1: Schematic of the SM-FISH protocol. Sequential hybridization of transcript specific probe, branched DNA amplifier and fluorophore to a target mRNA is shown. Please click here to view a larger version of this figure.
Previous studies using single molecule fluorescence in situ hybridization (SM-FISH) localized β-actin mRNAs in individual neurons12 and human papillomavirus DNA in cervical cancer cell lines7. The computer software Spot Finding and Tracking Program identifies individual punctate fluorescent signal and has been successfully used to quantify the number of mRNAs in each cell3,13.
Based on the results of mRNA detection in neurons12, we hypothesized that SM-FISH would prove a useful tool to quantitate transcript levels in murine oocytes and embryos including low abundance mRNAs. However, the technique is optimized for the use with adherent fixed cells and formaldehyde fixed paraffin embedded (FFPE) tissue sections. Oocytes cannot adhere to a slide, even when they are coated with Poly-L-lysine. Furthermore, they are more fragile than somatic cells and tissue sections resulting in cell lysis when subjected to some of the proprietary buffers in commercially available kits3. To overcome these challenges, oocytes were fixed and manually transferred between drops of the buffers. Furthermore, permeabilization and wash buffers in the kits were replaced to reduce the cell lysis. Predesigned probes are purchased alongside the FISH kit or specific transcripts can be requested. Each proprietary probe set is available in one of three fluorescence channels (C1, C2, and C3) to allow for multiplexing. In the current experiment, murine oocytes were dual-stained and quantified using a C2 Nanog probe and a C3 Pou5f1 probe. These probes were selected based on the reported expression of Nanog and Pou5f1 in oocytes and embryos. At the conclusion of the hybridization steps, oocytes were placed in drops of anti-fade mounting media for application to histological slides. Confocal images were used to quantify the number of punctate fluorescent signals which represent individual mRNAs. In addition to quantifying the mRNAs, imaging also showed the spatial distribution of the specific mRNA in the cell, which other RNA quantification methods are unable to achieve. This technique proved to have low variability within an experimental group allowing the use of smaller numbers of oocytes in each experimental group to identify significant differences between experimental groups3.
Protocol
Animal procedures were reviewed and approved by the Institutional Animal Care and Use Committee at the University of Nebraska-Lincoln and all methods were performed in accordance with relevant guidelines and regulations. For this study, CD-1 outbred mice had ad libitum access to normal rodent chow and water; they were maintained in a 12:12 dark: light cycle.
1. Preparation of required media
- For base media (OMM), add 100 mM NaCl, 5 mM KCl, 0.5 mM KH2PO4, and 1.7 mM CaCl2-2H2O to 100 mL sterile water.
NOTE: OMM medium can be stored for up to 1 month. - For complete media (OMOPS), add 20 mM 3-morpholinopropane-1-sulfonic acid (MOPS), 1.2 mM MgSO4-7H2O, 0.5 mM glucose, 6 mM L-lactate, 1 mM ala-gln, 0.1 mM taurine, 1x non-essential amino acids (NEAA), 0.01 mM ethylenediaminetetraacetic acid (EDTA), 10 µM alpha lipoic acid, 10 µg/mL undiluted gentamicin, 21 mM 1 M NaOH, 5 mM NaHCO3, 0.2 mM Pyruvate, 0.5 mM Citrate, 4 mg/mL FAF BSA to a 1:10 dilution of OMM in sterile water for a total volume of 100 mL. Sterilize the medium with a 0.22 µM filter.
NOTE: OMOPS can be stored for up to 1 week. - For the holding medium (HM) add 5% fetal bovine serum to OMOPS. Make 2 mL HM per mouse.
- For hyaluronidase solution add 0.1 mg/mL of hyaluronidase derived from bovine testes, to 1 mL HM.
- For the fixation buffer combine 4% paraformaldehyde in 10 mL of 1x PBS along with 0.1% embryo grade polyvinylpyrrolidone (PVP)14.
- To prepare 50 mL wash buffer (WB), add 0.1% non-ionic surfactant and 0.1% PVP to 1x PBS14.
- To Prepare 10 mL permeabilization buffer, add 1% non- ionic surfactant to 1x PBS14.
NOTE: The wash and permeabilization buffers described above replace the proprietary buffers in the commercially available kits.
2. Collection of ovulated oocytes from female mice
- Preparation:
- Stimulate female mice at 5-8 weeks of age by intraperitoneal (IP) injection of 5 IU equine chorionic gonadotropin (eCG) followed by 5 IU human chorionic gonadotropin (hCG) 44-48 h later15,16.
- Keep 35 mm Petri dishes containing 2 mL of HM on a 37 °C warming plate. Pipette one, 100-µL drop of HM containing diluted hyaluronidase followed by three, 50 µL drops of HM without hyaluronidase in a 60 mm petri dish. Place plates containing drops on the 37 °C warming plate prior to use.
NOTE: The hyaluronidase drops should be made just prior to the dissection of each oviduct pair to prevent the evaporation and concentration of the components of HM with or without hyaluronidase.
- Euthanize mice, 16 h after the IP injection of hCG, using isoflurane overdose followed by cervical dislocation.
- Clean the mouse using 70% ethanol. Expose the abdominal cavity and visualize the female reproductive tract. Hold the ovary with forceps and remove the uterine ligaments and excess adipose tissue from around the ovary. Cut the oviduct from the uterus and place the ovary-oviduct pair in the warm HM in the 35 mm dish.
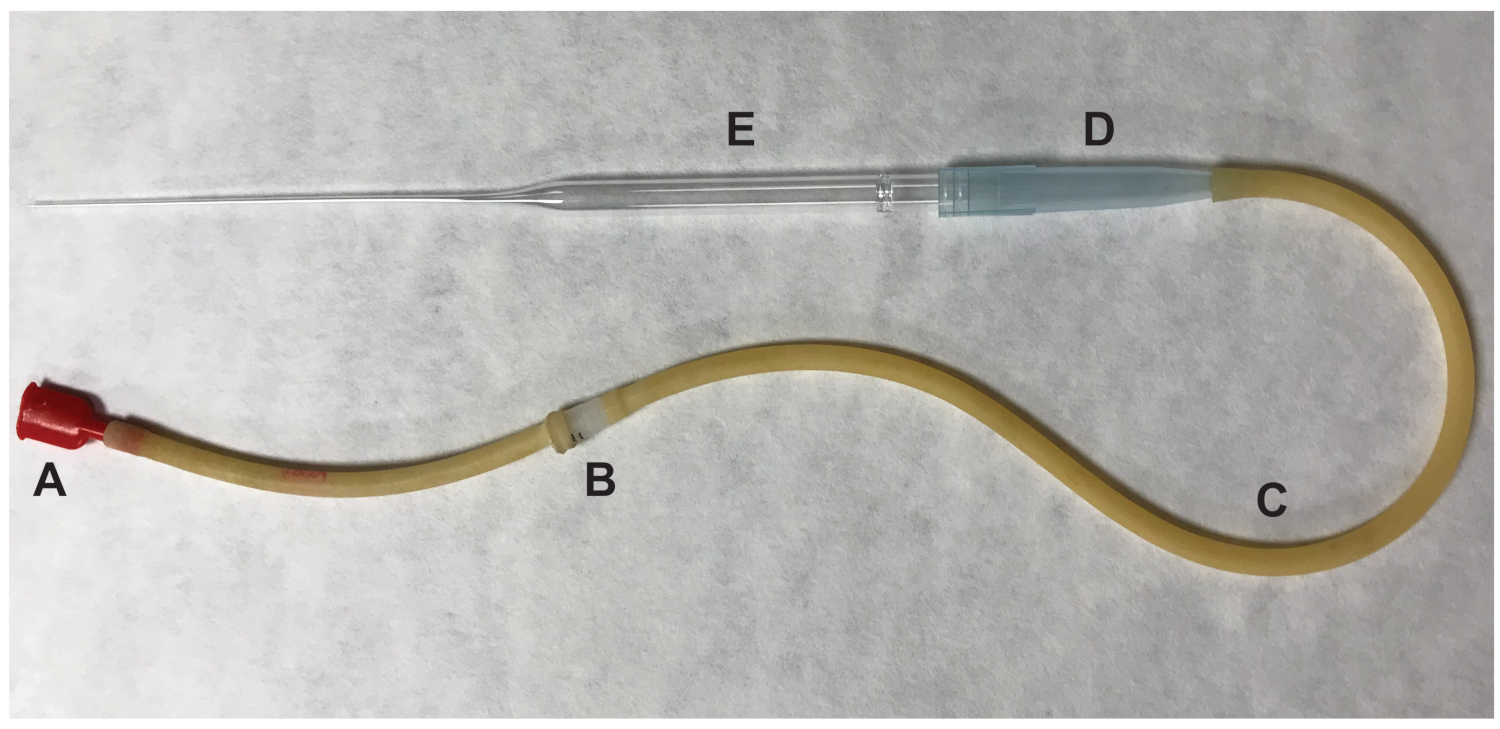
- Remove the ovary and any surrounding adipose tissue. Tear the swollen ampulla of the oviduct using a ½ inch 27-gauge needle. Push the oviduct at the site of the tear and the cumulus cell-oocyte complexes (COCs) will be expelled. Transfer the ovulated oocytes, which are presumed to be in metaphase II (MII) of meiosis, to the 100 μL drop containing HM media with hyaluronidase using a mouth pipette (Figure 2).

Figure 2: Parts of the mouth pipettor used to transfer oocytes. (A) mouth piece (B) 0.22 um, 4mm filter (C) aspirator tubing (D) 1000 μL pipet tip (E) 9" Pasteur pipet. Please click here to view a larger version of this figure.
- Pipette the MII oocyte-cumulus cell complexes up and down in the hyaluronidase containing HM with the mouth pipette to dislodge cumulus cells. Transfer each oocyte, once they are devoid of cumulus cells to a wash drop containing HM only using the mouth pipette. Repeat this for each wash droplet. Do not transfer fragmented or transparent oocytes15.
NOTE: It is important to transfer the oocytes from each drop in the 35 mm dish with as little HM as possible. This is true for every transfer in the protocol. The MII oocytes must not remain in the hyaluronidase containing HM medium for more than one minute.
3. SM-FISH Staining of Oocytes
- Fix oocytes in an individual well of a 6-well plate containing 500 µL of Fixation Buffer. Submerge 20 oocytes or less in the well. Incubate for 20 min at room temperature.
NOTE: Each SM-FISH staining step occurs within an individual well in a 6-well conical plate. Ensure that oocytes are completely submerged in buffers and not floating on top of the buffer. Each step should be performed with 20 oocytes or less in each well. - Transfer fixed oocytes to 500 μL of wash buffer (WB described in step 1.6) for 10 min each. Repeat 2 more times.
- Incubate oocytes in permeabilization buffer for 30 min at room temperature.
NOTE: The permeabilization buffer described in step 1.7 replaces the propriety permeabilization buffer.- Gather probe sets and quickly spin them down in a microcentrifuge. Warm each probe set for 10 min in a 40 °C water bath or incubator. Cool to the room temperature.
NOTE: This step should be performed during the permeabilization incubation
- Gather probe sets and quickly spin them down in a microcentrifuge. Warm each probe set for 10 min in a 40 °C water bath or incubator. Cool to the room temperature.
- Wash oocytes in 500 µL of WB for 10 min at room temperature.
- Transfer oocytes to 80 μL of Protease III Buffer (available from the kit), that is diluted 1:8 in 1X PBS, for 30 min at room temperature.
NOTE: The 80 µL volume adequately covers the bottom of an individual well in a 6-well plate. - Wash oocytes in 500 µL of WB for 10 min at room temperature.
- Dilute the warmed probe sets for Nanog, Pou5f1, and DapB (a negative control gene), 1:50 in probe diluent. Incubate oocytes in 80 μL of the transcript-specific probe for 2 hours at 40° C.
NOTE: Each proprietary probe set is available in one of three fluorescence channels (C1, C2, and C3). The Nanog and Pou5f1 probes were tagged with C2 and C3, respectively. - Warm the proprietary, Amplifier 1 (AMP 1), Amplifier 2 (AMP2), Amplifier 3 (AMP3) and Amplifier 4-fluorescence (AMP 4-FL) at room temperature.
NOTE: This step should be performed during the 2-hour transcript-specific probe incubation. - Transfer the oocytes to 500 μL of WB and incubate for 10 min at room temperature.
- Incubate oocytes sequentially in amplification buffers.
- Incubate oocytes in 80 µL of AMP1 for 30 min at 40° C. Transfer oocytes to 500 µL of WB for 10 min at room temperature.
- Incubate oocytes in 80 µL of AMP2 for 15 min at 40 °C. Transfer oocytes to 500 µL of WB for 10 min at room temperature.
- Incubate the oocytes in 80 µL of AMP3 for 30 min at 40 °C. Transfer oocytes to 500 µL of WB for 10 min at room temperature.
NOTE: The remainder of the protocol is performed in the dark because AMP-FL contains the fluorophore. When working under the dissecting microscope, reduce the light as much as possible. - Add oocytes to 80 μL of AMP4-FL for 15 min at 40° C.
NOTE: AMP4-FL is provided as alternative buffer-A (Alt-A), Alt-B or Alt-C. Select the AMP4-FL buffer dependent on which emission wavelength is desired.
- Wash oocytes in 500 µL of WB for 10 min at room temperature. Incubate oocytes in 80 µL of DAPI for 20 min at room temperature. Wash oocytes in 500 µL of WB for 5 min at room temperature.
- Pipette 12 µL of anti-fading mounting media onto the center of a slide without adding bubbles to the reagent. Transfer oocytes with as little WB as possible into the mounting media and apply a coverslip.
- Tilt the coverslip at an angle and slowly and gently place over the liquid on the slide. Avoid pressing the coverslip too hard to prevent distortion of the oocytes and introduction of bubbles.
- Store the slides in a dark box to dry overnight at room temperature. Coat the edges of the slides in clear nail polish to seal coverslip.
- Use a standard microscope to find oocytes on the slide and circle with a permanent marker.
NOTE: This step is not required but improves locating oocytes on the slide. For best results, image slides within 1 to 5 days as the fluorescent signal will begin to fade.
4. Image Processing
- Image the 3-dimensional oocytes, using z step confocal microscopy.
NOTE: To accurately analyze the images, each z step should be 1.0 µm/slice. - Save confocal images as a compressed nd2 or individual .TIFF files for each oocyte. Both image types are compatible with the open source image processing program, Fiji.
- Download and install the open access Fiji software (https://imagej.net/Fiji/Downloads).
- Drag nd2 files into Fiji and choose hyperstack. If confocal images were saved as .TIFF files skip to step 4.4.
NOTE: When the nd2 file is dropped into Fiji the hyperstack dropdown should appear automatically. - Click the Image tab, Select Color, and click Split Channels to separate the fluorescent channels of the nd2 file.
- Generate individual .TIFF files for each z-slice of the oocyte in each fluorescent channel. Click the Image tab, select Stacks, and click Stack to Images. Click the Image tab, select Type, and click RGB Color to convert each z slice to an individual RGB color image.
NOTE: The RGB color is artificial and can be chosen as desired for each emission wavelength. - Save each converted image as .TIFF file. Place images from a single oocyte for each fluorescent channel in a new folder to avoid confusion during stitching (step 4.3).
- Drag nd2 files into Fiji and choose hyperstack. If confocal images were saved as .TIFF files skip to step 4.4.
- Normalize each .TIFF image for Pou5f1 and Nanog using negative control images (DapB).
NOTE: Normalization is performed using a photo editing program. Make sure to remove the same levels of background fluorescence from each control image. - Open each normalized .TIFF file in Fiji to stitch together all z-slices for each oocyte in each wavelength.
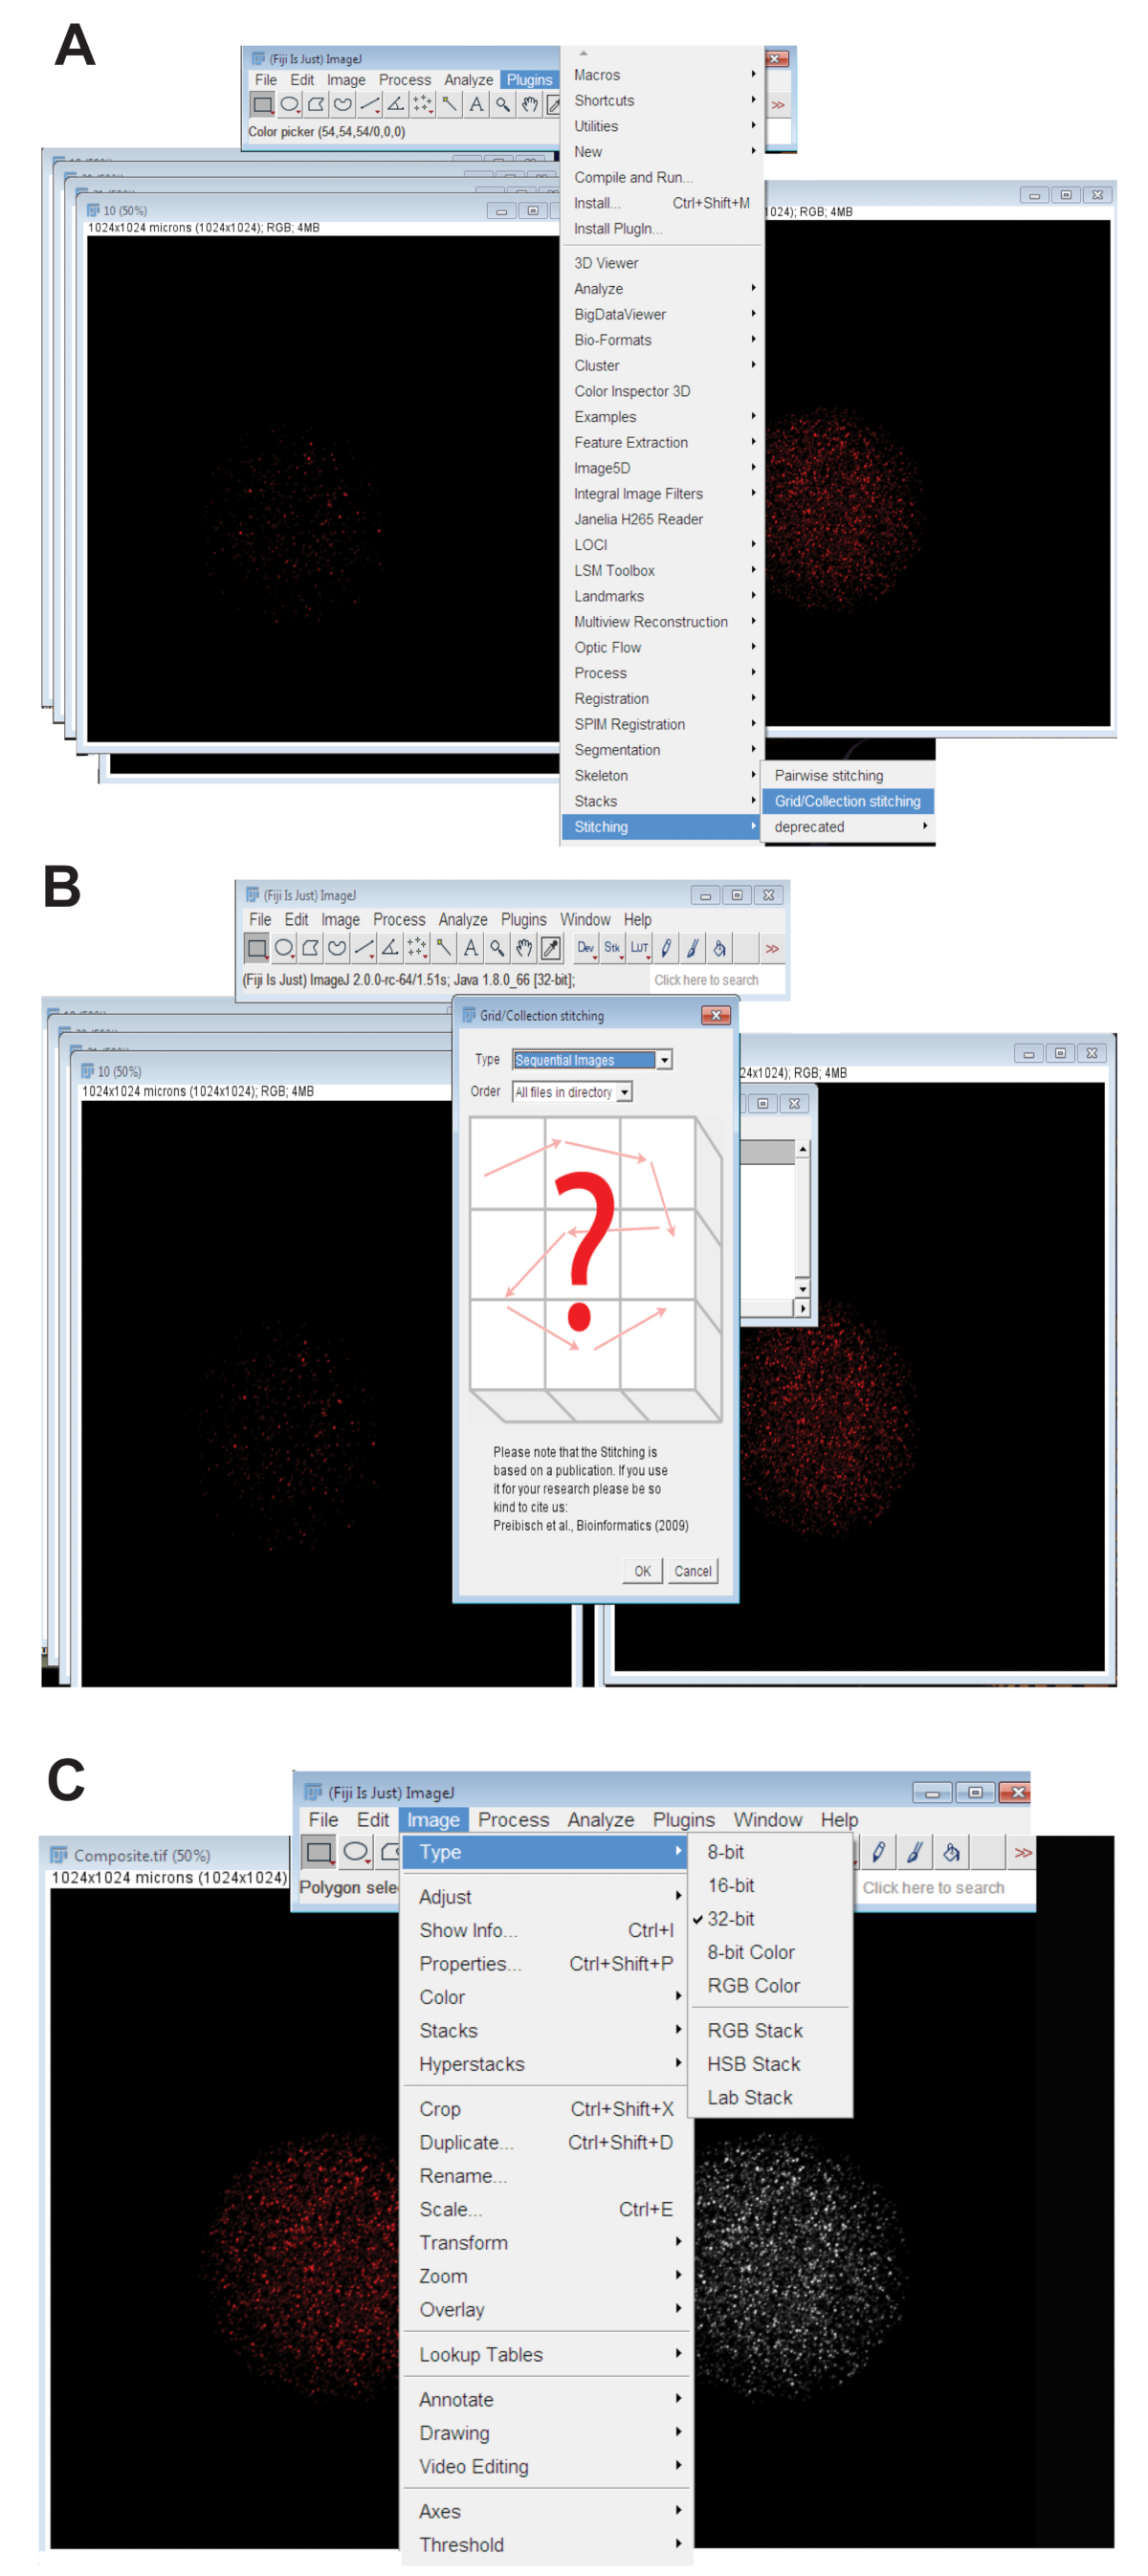
- Click the Plugins tab, select Stitching, and click on Grid/Collection (Figure 3A). Select Sequential Images from the drop-down menu and click OK (Figure 3B).
- Browse the directory and select the folder containing all of the z-slice images for an individual oocyte at one wavelength (see step 4.3.4). Click OK.
- Move the slider at the bottom of the stitched image to the appropriate color channel for the wavelength used and create the final RGB stitched image by clicking Image, selecting Type, and click RGB Color.
NOTE: This image will be used for fluorescence quantitation described in step 4.6 below.
- Convert the stitched image to 32-bit maximum projected picture. Click Image, select Type, and click 32-bit (Figure 3C). Save this image as a new .TIFF file.

Figure 3: Stitching together of confocal z-series images of oocytes. (A) Screenshot showing the Plug-in Grid/Collection tool in Fiji that was used to produce composite images of the oocyte. (B) Sequential Images uses fluorescence overlap between sequential .TIFF files to generate a composite image. (C) The composite image was saved as a 32-bit .TIFF file. Please click here to view a larger version of this figure.
- Download and install the Spot Finding and Tracking Program13, which is available from the website for D.R. Larson, an investigator at the National Institutes of Health National Cancer Institute (https://ccr.cancer.gov/Laboratory-of-Receptor-Biology-and-Gene-Expression/daniel-r-larson). Download and install the open access virtual machine for the interactive data language (IDL) operating system which is required to run the Spot Finding and Tracking Program (http://www.spacewx.com/pdf/idlvm.pdf).
- Open the 32-bit, stitched image, which was generated in step 4.6 (Figure 4A), in the Spot Finding and Tracking Program. Select the Localize dropdown and click Localize (Figure 4B), which will calculate the number spots found in the image.
NOTE: Each spot counted represents an individual mRNA. Band pass and photon threshold settings are shown in the screenshot (Figure 4B). For this protocol, default for each threshold setting was used. Representative positive and background spots are shown (Figure 4C).

Figure 4: Quantification of mRNAs using Spot Finder and Tracking. (A) Individual z-series images were stitched together as described in Figure 3 and saved as a 32-bit maximum projected .TIFF file. (B) Composite image was opened in Spot Finder and Tracking. Localize was used to count the fluorescent spots (red box). Band pass and photon threshold are indicated by the blue box. (C) The blue arrow points to a positive signal (above threshold). The white arrow shows a fluorescent spot below the threshold and, therefore, not counted. Please click here to view a larger version of this figure.
Results
Upon the completion of the protocol, the result will be individual images from confocal z-series (Figure 4A and Figure 5), stitched images (Figure 4C), and mRNA counts (Figure 4B). When multiplexing is performed, there will also be merged images showing the label for two different mRNAs (Fig...
Discussion
A series of minor steps during the protocol will ensure successful fluorescence and accurate counts of mRNAs. First, the protocol must be performed immediately after collection and fixation of the oocytes. Note that PVP is added to the 4% paraformaldehyde fixation buffer to prevent oocytes from sticking to each other. We found that it is necessary to perform the experiment immediately after the collection and fixation of the oocytes. Any delay results in a much lower fluorescence signal that would result in undercounting...
Disclosures
The authors have nothing to declare
Acknowledgements
We thank Dr. Daniel R. Larson for his generous help with the installation and use of the Spot Finding and Tracking Program 13 and the technical support of the University of Nebraska Lincoln Microscopy Core for the confocal microscopy imaging. This study represents a contribution of the University of Nebraska Agricultural Research Division, Lincoln, Nebraska and was supported by UNL Hatch Funds (NEB-26-206/Accession number -232435 and NEB-26-231/Accession number -1013511).
Materials
| Name | Company | Catalog Number | Comments |
| (±)-α-Lipoic acid | Sigma-Aldrich | T1395 | Alpha Lipoic Acid |
| Albumin, Bovine Serum, Low Fatty Acid | MP Biomedicals, LLC | 199899 | FAF BSA |
| BD 10mL TB Syringe | Becton, Dickinson and Company | 309659 | 10 mL syringe |
| BD PrecisionGlide Needle | Becton, Dickinson and Company | 305109 | 27 1/2 gauge needle |
| Calcium chloride dihydrate | Sigma-Aldrich | C7902 | CaCl2-2H2O |
| Citric acid | Sigma-Aldrich | C2404 | Citrate |
| D-(+)-Glucose | Sigma-Aldrich | G6152 | Glucose |
| Disodium phosphate | Na2HPO4 | ||
| Easy Grip Petri Dish | Falcon Corning | 351008 | 35 mm dish |
| Edetate Disodium | Avantor | 8994-01 | EDTA |
| Extra Fine Bonn Scissors | Fine Science Tools | 14084-08 | Straight, Sharp/Sharp, non-serrated, 13mm cutting edge scissors |
| Fetal Bovine Serum | Atlanta biologicals | S10250 | FBS |
| Gentamicin Reagent Solution | gibco | 15710-064 | Gentamicin |
| GlutaMAX-I (100X) | gibco | 35050-061 | Glutamax |
| Gold Seal Micro Slides | Gold Seal | 3039 | 25 x 75mm slides |
| Gonadotropin, From Pregnant Mares' Serum | Sigma | G4877 | eCG |
| hCG recombinant | NHPP | AFP8456A | hCG |
| Hyaluronidase, Type IV-S: From Bovine Testes | Sigma-Aldrich | H3884 | Hyaluronidase |
| Jewelers Style Forceps | Integra | 17-305X | Forceps 4-3/8", Style 5F, Straight, Micro Fine Jaw |
| L-(+)-Lactic Acid, free acid | MP Biomedicals, LLC | 190228 | L-Lactate |
| Magnesium sulfate heptahydrate | Sigma-Aldrich | M2773 | MgSO4-7H2O |
| MEM Nonessential Amino Acids | Corning | 25-025-Cl | NEAA |
| Microscope Cover Glass | Fisher Scientific | 12-542-C | 25 x 25x 0.15 mm cover slips |
| Mm-Nanog-O2-C2 RNAscope Probe | Advanced Cell Diagnostics | 501891-C2 | Nanog Probe |
| Mm-Pou5f1-O1-C3 RNAscope Probe | Advanced Cell Diagnostics | 501611-C3 | Pou5f1 Probe |
| MOPS | Sigma-Aldrich | M3183 | |
| Paraformaldehyde | Sigma-Aldrich | P6148 | Paraformaldehyde |
| PES 0.22 um Membrane -sterile | Millex-GP | SLGP033RS | 0.22 um filters |
| Polyvinylpyrrolidone | Sigma-Aldrich | P0930 | PVP |
| Potassium chloride | Sigma-Aldrich | 60128 | KCl |
| Potassium phosphate monobasic | Sigma-Aldrich | 60218 | KH2PO4 |
| Prolong Gold antifade reagent | invitrogen | P36934 | Antifade reagent without DAPI |
| RNAscope DAPI | Advanced Cell Diagnostics | 320858 | DAPI |
| RNAscope FL AMP 1 | Advanced Cell Diagnostics | 320852 | Amplifier 1 |
| RNAscope FL AMP 2 | Advanced Cell Diagnostics | 320853 | Amplifier 2 |
| RNAscope FL AMP 3 | Advanced Cell Diagnostics | 320854 | Amplifier 3 |
| RNAscope FL AMP 4 ALT A | Advanced Cell Diagnostics | 320855 | Amplifier 4 ALT A |
| RNAscope FL AMP 4 ALT B | Advanced Cell Diagnostics | 320856 | Amplifier 4 ALT B |
| RNAscope FL AMP 4 ALT C | Advanced Cell Diagnostics | 320857 | Amplifier 4 ALT C |
| RNAscope Fluorescent Multiplex Detection Reagents Kit | Advanced Cell Diagnostics | 320851 | FISH Reagent Kit |
| RNAscope Probe 3-plex Negative Control Probe | Advanced Cell Diagnostics | 320871 | Negative Control |
| RNAscope Probe 3-plex Positive Control | Advanced Cell Diagnostics | 320881 | Positive Control |
| RNAscope Probe Diluent | Advanced Cell Diagnostics | 300041 | Probe Diluent |
| RNAscope Protease III | Advanced Cell Diagnositics | 322337 | Protease III |
| RNAscope Protease III & IV Reagent Kit | Advanced Cell Diagnostics | 322340 | FISH Protease Kit |
| RNAscope Protease IV | Advanced Cell Diagnostics | 322336 | Protease IV |
| S/S Needle with Luer Hub 30G | Component Supply Co. | NE-301PL-50 | blunt 30 gauge needle |
| Sodium bicarbonate | Sigma-Aldrich | S6297 | NaHCO3 |
| Sodium chloride | Sigma-Aldrich | S6191 | NaCl |
| Sodium hydroxide | Sigma-Aldrich | 306576 | NaOH |
| Sodium pyruvate, >= 99% | Sigma-Aldrich | P5280 | Pyruvate |
| Solution 6 Well Dish | Agtechinc | D18 | 6 well dish |
| Taurine | Sigma-Aldrich | T8691 | Taurine |
| Tissue Culture Dish | Falcon Corning | 353002 | 60 mm dish |
| Triton X-100 | Sigma-Aldrich | X100 | Triton X-100 |
References
- Vogelstein, B., Kinzler, K. W. Digital PCR. Proceedings of the National Academy of Sciences. 96 (16), 9236-9241 (1999).
- MacK, E. M., Smith, J. E., Kurz, S. G., Wood, J. R. CAMP-dependent regulation of ovulatory response genes is amplified by IGF1 due to synergistic effects on Akt phosphorylation and NF-kB transcription factors. Reproduction. 144 (5), 595-602 (2012).
- Xie, F., Timme, K. A., Wood, J. R. Using Single Molecule mRNA Fluorescent in Situ Hybridization (RNA-FISH) to Quantify mRNAs in Individual Murine Oocytes and Embryos. Scientific Reports. 8 (1), 7930 (2018).
- Ruebel, M. L., et al. Obesity modulates inflammation and lipidmetabolism oocyte gene expression: A single-cell transcriptome perspective. Journal of Clinical Endocrinology and Metabolism. 102 (6), 2029-2038 (2017).
- Borensztein, M., Syx, L., Servant, N., Heard, E. . Mouse Oocyte Development. 1818, 51-65 (2018).
- Jansova, D., Tetkova, A., Koncicka, M., Kubelka, M., Susor, A. Localization of RNA and translation in the mammalian oocyte and embryo. PLoS ONE. 13 (3), 1-25 (2018).
- Player, A. N., Shen, L. P., Kenny, D., Antao, V. P., Kolberg, J. A. Single-copy gene detection using branched DNA (bDNA) in situ hybridization. Journal of Histochemistry and Cytochemistry. 49 (5), 603-611 (2001).
- Wang, F., et al. RNAscope: A novel in situ RNA analysis platform for formalin-fixed, paraffin-embedded tissues. Journal of Molecular Diagnostics. 14 (1), 22-29 (2012).
- Itzkovitz, S., van Oudenaarden, A. Validating transcripts with probes and imaging technology. Nature Methods. 8 (4), S12-S19 (2011).
- Derti, A., et al. ProbeDesigner: for the design of probesets for branched DNA (bDNA) signal amplification assays. Bioinformatics. 15 (5), 348-355 (1999).
- Larson, B., Malayter, D., Shure, M. Multiplexed Detection of Cytokine Cancer Biomarkers using Fluorescence RNA In Situ Hybridization and Cellular Imaging. BioTek Application Notes. , 1-5 (2016).
- Buxbaum, A. R., Wu, B., Singer, R. H. Single β-Actin mRNA Detection in Neurons Reveals a Mechanism for Regulating Its Translatability. Science. 343 (6169), 419-422 (2014).
- Thompson, R. E., Larson, D. R., Webb, W. W. Precise nanometer localization analysis for individual fluorescent probes. Biophysical Journal. 82 (5), 2775-2783 (2002).
- Herrick, J. R., Paik, T., Strauss, K. J., Schoolcraft, W. B., Krisher, R. L. Building a better mouse embryo assay: effects of mouse strain and in vitro maturation on sensitivity to contaminants of the culture environment. Journal of Assisted Reproduction and Genetics. 33 (2), 237-245 (2016).
- Pohlmeier, W. E., Xie, F., Kurz, S. G., Lu, N., Wood, J. R. Progressive obesity alters the steroidogenic response to ovulatory stimulation and increases the abundance of mRNAs stored in the ovulated oocyte. Molecular Reproduction and Development. 81 (8), 735-747 (2014).
- Xie, F., Anderson, C. L., Timme, K. R., Kurz, S. G., Fernando, S. C., Wood, J. R. Obesity-dependent increases in oocyte mRNAs are associated with increases in proinflammatory signaling and gut microbial abundance of lachnospiraceae in female mice. Endocrinology. 157 (4), 1630-1643 (2016).
- Hirao, Y., Yanagimachi, R. Detrimental effect of visible light on meiosis of mammalian eggs in vitro. Journal of Experimental Zoology. , (1978).
- Takenaka, M., Horiuchi, T., Yanagimachi, R. Effects of light on development of mammalian zygotes. Proceedings of the National Academy of Sciences. 104 (36), 14293-14293 (2007).
- Komminoth, P., Werner, M. Target and signal amplification: Approaches to increase the sensitivity of in situ hybridization. Histochemistry and Cell Biology. 108 (4-5), 325-333 (1997).
- Hornick, J. E., Duncan, F. E., Shea, L. D., Woodruff, T. K. Multiple follicle culture supports primary follicle growth through paracrine-acting signals. Reproduction. 145 (1), 19-32 (2013).
- Vlasova-St. Louis, I., Bohjanen, P. Feedback Regulation of Kinase Signaling Pathways by AREs and GREs. Cells. 5 (1), 4 (2016).
- Gilbert, C., Svejstrup, J. Q. RNA Immunoprecipitation for Determining RNA-Protein Associations In Vivo. Current Protocols in Molecular Biology. 75 (1), 27.4.1-27.4.11 (2006).
- Kwon, S., Chin, K., Nederlof, M., Gray, J. W. Quantitative, in situ analysis of mRNAs and proteins with subcellular resolution. Scientific Reports. 7 (1), 16459 (2017).
- Voigt, F., et al. Single-Molecule Quantification of Translation-Dependent Association of mRNAs with the Endoplasmic Reticulum. Cell Reports. 21 (13), 3740-3753 (2017).
- Halstead, J. M., Wilbertz, J. H., Wippich, F., Lionnet, T., Ephrussi, A., Chao, J. A. TRICK: A Single-Molecule Method for Imaging the First Round of Translation in Living Cells and Animals. Methods in Enzymology. 572, (2016).
- Cookson, W., Liang, L., Abecasis, G., Moffatt, M., Lathrop, M. Mapping complex disease traits with global gene expression. Nature Reviews Genetics. 10 (3), 184-194 (2009).
- Houle, D., Govindaraju, D. R., Omholt, S. Phenomics: the next challenge. Nature Reviews Genetics. 11, 855 (2010).
- Freimer, N., Sabatti, C. The Human Phenome Project. Nature Genetics. 34, 15 (2003).
Reprints and Permissions
Request permission to reuse the text or figures of this JoVE article
Request PermissionThis article has been published
Video Coming Soon
Copyright © 2025 MyJoVE Corporation. All rights reserved