
A subscription to JoVE is required to view this content. Sign in or start your free trial.
Method Article
ROS Live Cell Imaging During Neuronal Development
In This Article
Summary
This protocol describes the use of a genetically encoded hydrogen peroxide (H2O2)-biosensor in cultured zebrafish neurons and larvae for assessing the physiological signaling roles of H2O2 during nervous system development. It can be applied to different cell types and modified with experimental treatments to study reactive oxygen species (ROS) in general development.
Abstract
Reactive oxygen species (ROS) are well-established signaling molecules, which are important in normal development, homeostasis, and physiology. Among the different ROS, hydrogen peroxide (H2O2) is best characterized with respect to roles in cellular signaling. H2O2 has been implicated during the development in several species. For example, a transient increase in H2O2 has been detected in zebrafish embryos during the first days following fertilization. Furthermore, depleting an important cellular H2O2 source, NADPH oxidase (NOX), impairs nervous system development such as the differentiation, axonal growth, and guidance of retinal ganglion cells (RGCs) both in vivo and in vitro. Here, we describe a method for imaging intracellular H2O2 levels in cultured zebrafish neurons and whole larvae during development using the genetically encoded H2O2-specific biosensor, roGFP2-Orp1. This probe can be transiently or stably expressed in zebrafish larvae. Furthermore, the ratiometric readout diminishes the probability of detecting artifacts due to differential gene expression or volume effects. First, we demonstrate how to isolate and culture RGCs derived from zebrafish embryos that transiently express roGFP2-Orp1. Then, we use whole larvae to monitor H2O2 levels at the tissue level. The sensor has been validated by the addition of H2O2. Additionally, this methodology could be used to measure H2O2 levels in specific cell types and tissues by generating transgenic animals with tissue-specific biosensor expression. As zebrafish facilitate genetic and developmental manipulations, the approach demonstrated here could serve as a pipeline to test the role of H2O2 during neuronal and general embryonic development in vertebrates.
Introduction
Reactive oxygen species (ROS) signaling regulates development and functioning of the nervous system1. An important cellular ROS source are NADPH oxidases (NOX), which are transmembrane proteins generating superoxide and hydrogen peroxide (H2O2)2. NOX enzymes are found throughout the central nervous system (CNS), and NOX-derived ROS contribute to neuronal development3,4,5,6. Maintenance and differentiation of neural stem cells, establishing neuronal polarity, neurite outgrowth, and synaptic plasticity have been shown to require adequate levels of ROS7,8,9,10,11. On the other hand, uncontrolled production of ROS by NOXes contribute to neurodegenerative disorders including Alzheimer's Disease, multiple sclerosis, and traumatic brain injury12,13,14. Hence, production of physiologically relevant ROS is critical to maintaining healthy conditions.
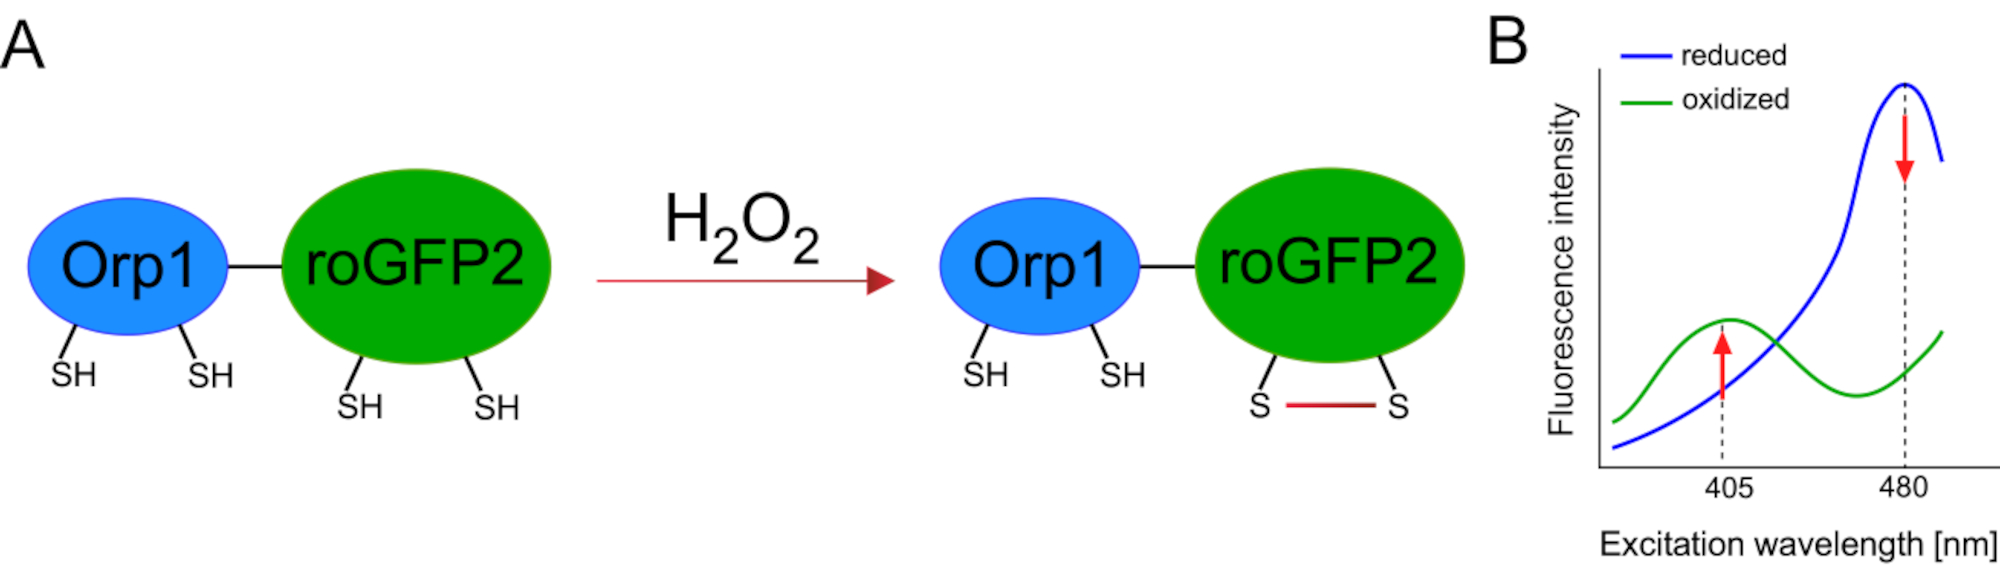
Development of genetically encoded biosensors facilitated the detection of cellular ROS greatly. One important advantage of genetically encoded biosensors is the increased temporal and spatial resolution of the ROS signal, as these sensors can be specifically targeted to distinct locations. Redox-sensitive GFP (roGFP) is one type of such ROS biosensors. The roGFP2-Orp1 variant specifically detects H2O2 through its Orp1 domain, which is a glutathione peroxiredoxin family protein from yeast15,16. The oxidation of the Orp1 protein is transferred to roGFP2 to alter its conformation (Figure 1A). The probe exhibits two excitation peaks near 405 nm and 480 nm, and a single emission peak at 515 nm. Upon oxidation, the fluorescence intensity around excitation peaks changes: while 405 nm excitation increases, 480 nm excitation decreases. Thus, roGFP2-Orp1 is a ratiometric biosensor, and H2O2-levels are detected by the ratio of fluorescence intensities excited at two different wavelengths (Figure 1B). Overall, roGFP2-Orp1 is a versatile tool for ROS imaging that can be utilized efficiently in vivo.

Figure 1: Schematic representation and excitation spectra of roGFP2-Orp1. (A) Oxidant transfer occurs between Orp1 and roGFP2 in response to H2O2, leading to conformational changes in roGFP2. (B) The excitation spectra of the roGFP2-Orp1 exhibits two excitation peaks at 405 nm and 480 nm and single emission peak at 515 nm. Upon oxidation by H2O2, the 405 nm excitation increases while 480 nm excitation decreases. This results in a ratiometric readout for H2O2 presence. The figure has been modified from Bilan and Belousov (2017)16 and Morgan et al. (2011)25. Please click here to view a larger version of this figure.
The Danio rerio (zebrafish) model system has several advantages for applying genetically encoded biosensors. The optical transparency of the embryos and larvae enables non-invasive in vivo imaging. New imaging tools are being developed to achieve higher resolution and deeper penetration17. Furthermore, there are established tools for genetic manipulation (ectopic mRNA expression, Tol2 transgenesis, etc.) and genome editing (TALENs, CRISPR/Cas9, etc.), which promotes the generation of transgenic animals18. As the zebrafish embryos develop outside of the mother, this system further allows easier access and manipulation of the embryos. For instance, one-cell stage injections and drug treatments can easily be done.
Here, we used zebrafish to transiently express the H2O2-specific biosensor roGFP2-Orp1 by injecting in vitro-transcribed mRNA. These embryos can be used for both in vitro imaging of cultured neurons and in vivo imaging (Figure 2). We describe a protocol for dissecting and plating retinal ganglion cells (RGCs) from zebrafish embryos followed by assessing H2O2-levels in cultured neurons. Then, we present a method for in vivo imaging of roGFP2-Orp1-expressing embryos and larvae using confocal microscopy. This approach not only allows to determine physiological H2O2-levels but also potential changes occurring in different developmental stages or conditions. Overall, this system provides a reliable method for detecting H2O2 in live cells and animals to study the role of H2O2 in development, health, and disease.

Figure 2. Outline of the experimental approach. Briefly, after embryo collection, roGFP2-Orp1 mRNA is injected into the yolk of one-cell stage zebrafish embryos. Developing embryos can be used for both (A) in vitro and (B) in vivo imaging. (A) GFP-positive embryos are used to dissect retinas for RGC collection at 34 hpf. Dissociated RGCs are plated on PDL/laminin-coated coverslips in ZFCM (+) media. Growth cone imaging can be conducted as RGCs extend their axons after 6-24 h of plating. Cells can be subjected to different treatments to measure the potential changes in H2O2-levels. Here, we measured H2O2-levels in the growth cones of RGCs (red). (B) GFP positive embryos are used for in vivo imaging. At the desired age, embryos can be anesthetized and mounted on 35 mm glass bottom dishes for confocal imaging. Here, embryos are mounted ventrally for retinal imaging. Schematic shows retinal development in zebrafish. RGCs form ganglion cell layer (GCL), which is the innermost layer in retina. RGC axons develop into optic nerve to cross midline, forming optic chiasm. Then, RGC axons grow dorsally to make synapses in the optic tectum in the midbrain. Please click here to view a larger version of this figure.
Protocol
All animal experiments were ethically reviewed and approved by the Purdue Animal Care and Use Committee (PACUC), following NIH guidelines with the protocol 2006002050 approved on 07/24/2020.
1. Preparation of solutions
- E2 media (1x)
- Prepare 100x E2A (500 mL), 500x E2B (100 mL) and 500x E2C (100 mL) solutions by combining all components shown in Table 1. Autoclave E2A, E2B and E2C solutions. Store at 4 °C.
- For 1x E2 media: Combine 5 mL of 100x E2A, 1 mL of 500x E2B, and 1 mL of 500x E2C. Bring the volume to 500 mL with sterile water. Adjust the pH to 7.0-7.5.
- Prepare 50 mL aliquots of 1x E2 media store at -20 °C for long-term storage. However, precipitations can occur upon thawing. Make sure precipitation is fully dissolved before using the stock solution.
| Solution | Component | Amount | Concentration |
| 100X E2A (500mL) | |||
| NaCl | 43.8 g | 1500 mM | |
| KCl | 1.88 g | 50 mM | |
| MgSO4 | 6 g | 100 mM | |
| KH2PO4 | 1.03 g | 15 mM | |
| Na2HPO4 | 0.34 g | 5 mM | |
| 500X E2B (100 mL) | |||
| CaCl2 | 5.5 g | 500 mM | |
| 500X E2C (100 mL) | |||
| NaHCO3 | 3 g | 350 mM | |
| 1X E2 (500 mL) | |||
| 100X E2A | 5 mL | 1X | |
| 500X E2B | 1 mL | 1X | |
| 500X E2C | 1 mL | 1X |
Table 1: Components of 1x E2 media for zebrafish cell culture.
- E3 Media (1x)
- Dissolve the components in 1 L sterile water as shown in Table 2 to make 100x stock. Dilute the stock in sterile water to make 1x E3 media.
- Add 0.2% methylene blue. For 20 mL of 1x E3 media, add 40 µL of methylene blue.
- Make another batch without methylene blue for fluorescent imaging.
| Component | Amount (g) | Concentration in 100X stock (mM) |
| NaCl | 29.22 | 500 |
| KCl | 1.26 | 17 |
| CaCl2 2H2O | 4.85 | 33 |
| MgSO4 7H2O | 8.13 | 33 |
Table 2: Components of 100x E3 media for maintaining zebrafish embryos.
- 80x saline stock solution
- Combine all components shown in Table 3. Add water to make 100 mL solution. Mix until all components are dissolved. Store the solution at 4 °C.
| Component | Amount (g) | Concentration in stock (mM) |
| Glucose | 1.44 | 80 |
| Sodium Pyruvate | 0.44 | 40 |
| CaCl2 2H2O | 0.148 | 10 |
| HEPES | 6.1 | 256 |
Table 3: Components of 80x saline solution for zebrafish cell culture media.
- Zebrafish cell culture medium (ZFCM+)
- Combine all components shown in Table 4 to make 250 mL media. Adjust the pH to 7.5. Filter media using 0.22 µm filter and store at 4 °C.
| Component | Amount (mL) | Volume % |
| L-15 medium (with phenol red) | 212.75 | 85.1 |
| Fetal Bovine Serum (FBS) | 5 | 2 |
| Penicillin/Streptomycin | 1 | 0.4 |
| 80X Saline solution | 3.125 | 1.25 |
| Water | 28.125 | 11.25 |
Table 4: Components of zebrafish cell culture medium with serum and antibiotics.
- Zebrafish cell culture medium for imaging (ZFCM-)
- Combine all components shown in Table 5 to make 250 mL media. Adjust the pH to 7.5. Filter media using 0.22 µm filter.
- Make single use aliquots (50 mL batches) to prevent contamination. Keep at 4 °C.
| Component | Amount (mL) | Volume % |
| L-15 medium (no phenol red) | 212.75 | 85.1 |
| 80X Saline solution | 3.125 | 1.25 |
| Water | 34.125 | 13.65 |
Table 5: Components of zebrafish cell culture medium without serum and antibiotics for in vitro imaging.
- Injection molds
- Dissolve 1.5% agarose in E3 media. Pour ~ 25 mL of agarose in a 100 x 15 mm Petri dish.
- Lay down the mold on top of the agarose with a 45° angle with respect to the surface, and let it float on agarose with a slow motion. This will help avoiding bubbles. Let the agarose cool down and solidify on bench top.
- Once completely solidified, remove the mold slowly to prevent breaking of agarose. Add fresh E3 media, add paraffin film around the dish to prevent spills, and store at 4 °C ( Figure 3).

Figure 3: Injection mold images. (A) The plastic mold that is used to make injection plates. The mold has six ramps, one 90° and one 45° beveled side for holding embryos in place. (B) The injection plate after the agarose solidified and mold is removed. Scale bars = 1 cm. Please click here to view a larger version of this figure.
2. Preparation and injection of roGFP2-Orp1 mRNA
NOTE: roGFP2-Orp1 construct was obtained from Dr. Tobias Dick, DKFZ, Germany. It was sub-cloned into the pCS2+ vector in Dr. Qing Deng's Lab, Purdue University. To prevent degradation by RNase, several precautions must be taken. RNase-free reagents and tubes must be used at all times, gloves must be worn for all steps, and, alternatively, materials and surfaces can be wiped with a cleaning agent for RNase removal.
- Linearize the 3-10 µg of pCS2+/roGFP2-Orp1 vector with NotI.
- Purify the linearized plasmid with a PCR clean-up kit.
- In vitro transcribe the roGFP2-Orp1 mRNA with an in vitro transcription kit according to the instructions provided by the manufacturer.
- Capped transcription reaction assembly
- Place RNA polymerase and linearized/purified DNA on ice. Vortex 10x reaction buffer and 2x NTP/CAP until they are completely in solution. Store NTP/CAP on ice but keep the buffer at room temperature (RT) while assembling the reaction. Touch-spin all reagents before opening tubes to prevent contamination.
- Set up RNA synthesis reaction in the order indicated below at RT in an RNase-free 0.5 mL centrifuge tube. Final volume of the reaction is 20 µL. Reaction setup is shown in Table 6.
- Add 10 µL of ribonucleotide mix, 2x NTP/CAP, and nuclease free water, if needed to the tube. Add 2 µL 10X reaction buffer. Add 1-1.5 µg of linear DNA (up to 6 µL). If needed, add nuclease-free water to make up 20 µL reaction volume.
- Close the tube, vortex briefly and touch-spin microfuge. Add 2 µL of 10x SP6 enzyme mix. Close with a finger click and touch-spin in a microfuge.
- Place in 37 °C for 2-2.5 h (can go up to 18 h).
NOTE: In the presented experiment overnight 16-18 h incubation at 37 °C was performed for best results. - Add 1 µL of DNase to remove DNA template, finger click, touch spin, and incubate at 37 °C for 15 min.
- Capped transcription reaction assembly
| Reagent | Volume (µL) | Amount in reaction |
| 2X NTP/CAP | 10 | 1X |
| 10X Reaction Buffer | 2 | 1X |
| Template DNA | Up to 6 | 1-1.5 µg |
| Nuclease-free water | Add to make 20 µL | |
| 10X SP6 enzyme mix | 2 | 1X |
Table 6: Reaction setup for roGFP2-Orp1 mRNA in vitro transcription.
- RNA recovery
- Add 25 µL of lithium chloride (LiCl) supplied in the in vitro transcription kit. Place at -20 °C in a non-frost freezer for at least 30 min.
- Spin for 25 min at maximum speed in a tabletop centrifuge at 4 °C. Remove and discard supernatant carefully, so as not to disturb pellet. Add 25 µL of cold 75% ethanol and spin for 5 min at 4 °C.
- Remove carefully and discard the supernatant. Let pellet air dry for at least 5 min at RT. Do not let over dry. Add 12 µL of nuclease free Tris-EDTA (TE) buffer (pH 7.0) and keep the sample on ice.
- Measure the RNA concentration with a spectrophotometer. 0.5- 1 µg/µL is usually obtained.
- Prepare 100 ng/µL mRNA in phenol red solution (0.5% phenol red in Dulbecco's phosphate-buffered saline -DPBS) and aliquot for single use (3-5 µL). Store the mRNA aliquots at - 80 °C.
- Microinjection of mRNA
- On the day of injection, use one of the mRNA aliquots and follow the zebrafish embryo injection protocol to inject 1 nL of the mRNA into the one-cell stage embryos through their yolk19. A brief description is provided below.
- Breed adult fish and collect embryos as previously described20.
- Pull microinjection needles with pipette puller. Cut the tip of the needles with forceps to create a 10 µm tip opening.
- Align embryos in an injection mold that was described in Step 1.6.
- Inject 1 nL of the mRNA in phenol red with a glass microinjection pipette.
- Collect embryos and keep them in E3 media.
- Keep embryos in the 27 °C incubator in E3 media until the desired developmental stage is achieved. Injected embryos can be used for both in vitro (section 3 and section 4) and in vivo imaging (section 5). Embryos expressing roGFP2-Orp1 can be pre-selected prior to experiments with a regular dissection microscope equipped with fluorescent light and a blue/green filter set.
3. Primary retinal ganglion cell culture derived from zebrafish embryos
NOTE: This protocol is adapted from a previously published method 21. Perform steps 3.1 and 3.2 in a laminar flow hood.
- Preparation of coverslips
- Prepare 4-6 culture plates in each experiment. Use acid-cleaned coverslips (22 x 22 mm square; 0.16-0.19 mm thickness) that are stored in 100% ethanol.
- Remove one coverslip from the storage container by using forceps and flame it to remove residual ethanol.
- Air dry the coverslip completely by placing it at an angle inside a 35-mm culture dish.
- Prepare Poly-D-Lysine (PDL) working solution (1x) by diluting 10x stock (5 mg/mL) in sterile water.
- Apply 100 µL of 0.5 mg/mL PDL to the center of each coverslip and avoid spreading of the solution to the edges.
- Incubate the PDL on coverslips for 20-30 min at room temperature (RT). Make sure the PDL does not dry out.
- Wash the PDL with 0.5 mL sterile water three times. Let the plates dry completely.
- Prepare laminin working solution (1x) by diluting 50x stock (1 mg/mL) in 1x PBS.
- Apply 100 µL of 20 µg/mL laminin in PBS to the center of each coverslip and avoid the spread of solution to the edges.
- Incubate the plates at 37 °C in a humidified incubator for 2-6 h. Avoid drying of the laminin solution.
- Embryo dissection and plating RGCs
- Prepare and label four 35-mm tissue culture dishes and fill with 4 mL of: 70% ethanol, "E2 media 1", "E2 media 2", "E2 media 3" on the day of dissection. Keep the dishes in the fridge until dissections.
- When zebrafish embryos are 34 hours post fertilization (hpf), take the culture dishes coated with laminin out of the incubator and wash the coverslips three times with 0.5 mL of 1x PBS.
- After the final wash, add 4 mL of ZFCM(+) media to each culture dish and avoid drying the plate.
- Retrieve the prepared culture dishes from Step 3.2.1. Let them equilibrate to RT.
- Fill 4-6 PCR tubes with 15 µL of ZFCM(+) media. One tube is needed to prepare RGCs from 4 eyes to be plated onto one coverslip.
- Retrieve zebrafish embryos from the incubator and immerse embryos in 35 mm tissue culture dish containing 70% ethanol for 5-10 s to sterilize.
- Using a transfer pipette, transfer embryos to E2 Media 1 dish containing sterile E2 media to wash excess ethanol.
- Transfer embryos to E2 Media 2 dish and remove their chorions with sharp forceps.
- Transfer embryos to final E2 Media 3 dish to perform dissections.
- Using a pair of fine forceps, dissect out the retinas as previously described 22.
- Position and hold embryos anterior to their yolk with one of the forceps and remove the tail posterior to the yolk sac with the other forceps.
- Grab the neck with forceps and take off the head to expose brain and eyes to the E2 media. Avoid cutting the yolk sac.
- With the tip of fine forceps, gently roll the eyes off from the head, while holding the cranial tissue down with the second forceps. Keep eyes isolated from the adjacent tissue debris.
- Transfer four eyes to one of the previously-prepared tubes containing ZFCM(+).
- Gently titrate up and down with the P20 pipette and a yellow tip about 45 times to dissociate cells. Avoid any air bubbles.
- Transfer the ZFCM(+) with dissociated cells to the center of the coverslip. Repeat steps 10-12 for additional coverslips.
- Maintain cultures on benchtop at 22 °C on a polystyrene foam rack to absorb vibrations.
- Perform imaging 6-24 h after plating.
NOTE: Use transfer pipette to translocate embryos to different culture dishes. Change the pipette for each solution to prevent carrying over ethanol (Steps 6-8).
4. In vitro ROS imaging of cultured RGC neurons
- On the day of imaging (typically 6-24 h after cell plating), check cells under microscope to validate growth of RGC axons.
- For live-cell imaging, transfer coverslips from culture dish to a live cell imaging chamber. In this case a custom-made open chamber, which has been previously described was used23.
- Set up microscope for imaging. Use an inverted microscope equipped with a differential interference contrast (DIC) objective, OG590 long-pass red filter, and an EM-CCD camera.
- Before imaging, replace the ZFCM(+) medium with ZFCM(-).
- Once cells are positioned with 10x objective, acquire images at 60x magnification using a high NA oil immersion objective. Use an additional 1.5x magnification.
- First, acquire DIC images. Then, image roGFP2-Orp1 using an appropriate filter set. Excite roGFP2-Orp1 with 405/20 and 480/30 nm excitation filters sequentially and acquire images with 535/30 nm emission filter after emission light has passed the dichroic mirror 505DCXR.
- After taking the first set of images, exchange media with media containing different treatment solutions. Media should be changed every 30 min of imaging to avoid pH and osmolarity changes.
5. In vivo ROS imaging of developing embryos
- For in vivo imaging, keep embryos in E3 media containing 0.003% Phenylthiourea (PTU) without methylene blue from 22-24 hpf. Exchange media and remove dead embryos on a daily basis.
- At the desired age, anesthetize embryos in 0.016% tricaine. Mount anesthetized embryos in 1% low-melting agarose on 35-mm glass bottom culture dishes. Embryos can be oriented dorsally, ventrally or laterally, depending on the region of interest for imaging.
- After agarose solidifies, fill the dishes with E3 media without methylene blue/0.016% tricaine.
- Set up the microscope for imaging. Use an inverted laser scanning confocal microscope. Alternatively, use an upright confocal microscope equipped with a water immersion lens to image embryos mounted on top of an agarose drop.
- Excite roGFP2-Orp1 with 405 nm and 488 nm excitation filters sequentially and acquire corresponding images with emission filters in the range of 515-535 nm.
- Acquire z-stacks with 5 µm section thickness through the desired part of the embryos. Embryos can be kept for imaging at later stages of development.
- After imaging, remove embryos from agarose with fine forceps and keep in the incubator until desired age in methylene blue-free media with PTU.
6. Image analysis and processing
- Measurement of H2O2 levels based on 405/480 ratio values
- Use a suitable software for image analysis. ImageJ software was used here for image analysis and processing.
- Open DIC, 405/535 and 480/535 images in ImageJ software by either dragging the files or clicking File | Open. If not already done, convert images to 32-bit by clicking Image | Type | 32-bit.
- Define region of interest (ROI) with free hand tool from the control bar (cell body, growth cone, retina, etc.). Open the ROI manager by clicking Analyze | Tools | ROI Manager. Click Add in the ROI Manager tab to add the defined ROI.
- Draw a region close to ROI and add as background ROI. Measure average background values by selecting the ROI and clicking Measure from the ROI manager tab.
- Note the average intensity values from the measurement. Subtract the value of average background from the fluorescent images by clicking Process | Math | Subtract. Perform this step for both 405/535 and 480/535 images.
- Add value of "1" to 480/535 fluorescent image to eliminate "0" values by clicking Process | Math | Add function prior to ratio calculation.
- Click Process | Image Calculator | Divide function in ImageJ to divide 405/535 image by 480/535 image pixel-by-pixel. Select 405/535 image to be divided by 480/535 image. Select a 32-bit output image.
- Apply ROI to ratio image by first clicking the ratio image and then the ROI in the ROI manager tab.
- Measure average ratio values of 405/535 image to 480/535 image by clicking Measure in the ROI manager tab.
- Do steps 6.1.2-6.1.9 for as many samples as possible to perform the appropriate statistical analysis.
- Displaying ratio image
NOTE: This procedure is to subtract the background outside the specimen and apply a color look-up table to the image.- Once the ratio image has been created in ImageJ in step 6.1.7., create a 32-bit black image by clicking File | New | Image.
- Apply the ROI you would like to display H2O2 levels for to the new image by first clicking the new image and then the ROI from the ROI manager tab.
- Create a mask by clicking Edit | Selection | Create Mask.
- Divide mask image by 255 to adjust ROI value to "1" and background values will be "0". Click Process | Math | Divide and type 255.
- Multiply mask with the ratio image by clicking Process | Image Calculator | Multiply function. This will result in a gray-scale ratio image showing only the ROI.
- Change look up table to "Fire" by clicking Image | Look up Tables | Fire.
NOTE: A multiplication factor can be applied to all images for better visualization of the ratio by clicking Process | Image | Multiply. - Convert the ratio image to 8-bit by clicking Image | Type | 8-bit.
- Add calibration bar by clicking Analyze | Tools | Calibration Bar.
Results
Cultured zebrafish RGCs extend axons within 1d. A representative 405/480 ratio image of the H2O2-biosensor is shown in Figure 4A. The cell body, axon, and growth cones are clearly visible in individual neurons. These neurons can be subjected to different treatments over time to monitor H2O2 changes. We previously found that adding 100 µM H2O2 to culture media increases the ratio values, showing that real-time changes can ...
Discussion
There are several critical steps that need attention throughout this protocol. We believe considering these points will improve the experimental flow. For primary RGC culture, the sterility of the ZFCM(-) is very important, since this culture media does not contain antibiotics and contamination can occur before or during imaging. To avoid it, we advise to prepare and use ZFCM(-) only inside a biosafety cabinet and make fresh ZFCM(-) media regularly (Step 1.5). In addition, laminin stocks should be kept at -80 °...
Disclosures
Authors declare that they have no conflict of interest.
Acknowledgements
This work was supported by the National Institutes of Health (Grant R01NS117701), National Science Foundation (Grant 1146944-IOS), the Indiana Traumatic Spinal Cord and Brain Injury Research Fund (Grant 20000289), the Purdue Research Foundation (Grant 209911), and the Office of the Executive Vice President for Research and Partnerships at Purdue University (Grant 210362). We thank Dr. Cory J. Weaver and Haley Roeder for establishing zebrafish RGC culture protocol. We thank Haley Roeder additionally for providing the data of Figure 4. We thank Leah Biasi and Kenny Nguyen for the help with RGC culture. We thank Gentry Lee for editing the text. We thank Dr. Tobias Dick for providing roGFP2-Orp1 and Dr. Qing Deng for pCS2+ vector containing roGFP2-Orp1. Figure 2 is created with Biorender.com.
Materials
| Name | Company | Catalog Number | Comments |
| 35-mm culture dish | Sarstedt | 83-3900 | |
| 35-mm glass bottom dish | MatTek | P35G-1.5-10-C | |
| Agarose | Fisher Scientific | BP160-500 | |
| Borosilicate Glass Capillary Tubes | Sutter/Fisher Scientific | NC9029378 | |
| Calcium Chloride Dihydrate | Fisher Scientific | C79-500 | |
| Cover glass | Corning | 2850-22 | |
| Disposable Petri Dishes (100 x 15 mm) | VWR | 25384-094 | |
| Fetal Bovine Serum | ThermoFisher Scientific | 26140087 | |
| Glucose | Sigma Aldich | G7528 | |
| HEPES | Sigma Aldich | H4034 | |
| Injection Mold | Adaptive Science Tools | TU-1 | |
| Inverted Microscope | Nikon | TE2000 | |
| Laminin | ThermoFisher Scientific | 23017-015 | |
| Laser Scanning Confocal Microscopy | Zeiss | 710 | |
| Leibovitz's L-15 Medium with phenol red | Gibco/Fisher Scientific | 11-415-064 | |
| Leibovitz's L-15 Medium without phenol red | Gibco/Fisher Scientific | 21-083-027 | |
| Low melting agarose | Promega | V2111 | |
| mMessage mMachine SP6 Transcription Kit | Invitrogen | AM1340 | |
| NotI | New England Biolabs | R0189S | |
| PBS | Hyclone/Fisher Scientific | SH3025601 | |
| Penicillin/streptomycin | ThermoFisher Scientific | 15140122 | |
| Phenol Red | Sigma Aldich | P0290 | |
| Phenylthiourea (PTU) | Sigma Aldich | P7629 | |
| Pneumatic PicoPump | World Precision Instruments | PV820 | |
| Poly-D-Lysine (PDL) | Sigma Aldich | P7280 | |
| QiaQUICK PCR Purification Kit | QIAGEN | 28104 | |
| Recombinant mouse slit2 | R&D Systems | 5444-SL-050 | |
| Sodium Pyruvate | Sigma Aldich | P5280 | |
| Steritop 0.22 µm filter | Millipore | S2GPT05RE | |
| TE Buffer | Ambion | AM9860 | |
| Tricaine Methanesulfonate | Sigma Aldich | E10521 | |
| Vertical Pipette Puller | David Kopf Instruments | 700C |
References
- Bórquez, D. A., et al. Dissecting the role of redox signaling in neuronal development. Journal of Neurochemistry. 137 (4), 506-517 (2016).
- Bedard, K., Krause, K. -. H. The NOX family of ROS-generating NADPH oxidases: Physiology and pathophysiology. Physiological Reviews. 87 (1), 245-313 (2007).
- Weaver, C. J., Leung, Y. F., Suter, D. M. Expression dynamics of NADPH oxidases during early zebrafish development. Journal of Comparative Neurology. 524 (10), 2130-2141 (2016).
- Terzi, A., Suter, D. M. The role of NADPH oxidases in neuronal development. Free Radical Biology and Medicine. 154, 33-47 (2020).
- Infanger, D. W., Sharma, R. V., Davisson, R. L. NADPH oxidases of the brain: Distribution, regulation, and function. Antioxidants & Redox Signaling. 8 (9-10), 1583-1596 (2006).
- Coyoy, A., Olguin-Albuerne, M., Martinez-Briseno, P., Moran, J. Role of reactive oxygen species and NADPH-oxidase in the development of rat cerebellum. Neurochemistry International. 62 (7), 998-1011 (2013).
- Le Belle, J. E., et al. Proliferative neural stem cells have high endogenous ROS levels that regulate self-renewal and neurogenesis in a PI3K/Akt-dependant manner. Cell Stem Cell. 8 (1), 59-71 (2011).
- Nayernia, Z., et al. Decreased neural precursor cell pool in NADPH oxidase 2-deficiency: from mouse brain to neural differentiation of patient derived iPSC. Redox Biology. 13, 82-93 (2017).
- Wilson, C., Nunez, M. T., González-Billault, C. Contribution of NADPH oxidase to the establishment of hippocampal neuronal polarity in culture. Journal of Cell Science. 128 (16), 2989-2995 (2015).
- Munnamalai, V., et al. Bidirectional interactions between Nox2-type NADPH oxidase and the F-actin cytoskeleton in neuronal growth cones. Journal of Neurochemistry. 130 (4), 526-540 (2014).
- Kishida, K. T., et al. Synaptic plasticity deficits and mild memory impairments in mouse models of chronic granulomatous disease. Molecular and Cellular Biology. 26 (15), 5908-5920 (2006).
- Ravelli, K. G., et al. Nox2-dependent neuroinflammation in an EAE model of multiple sclerosis. Translational Neuroscience. 10 (1), 1-9 (2019).
- Park, L., et al. Nox2-derived radicals contribute to neurovascular and behavioral dysfunction in mice overexpressing the amyloid precursor protein. Proceedings of the National Academy of Sciences. 105 (4), 1347-1352 (2008).
- Schiavone, S., Neri, M., Trabace, L., Turillazzi, E. The NADPH oxidase NOX2 mediates loss of parvalbumin interneurons in traumatic brain injury: Human autoptic immunohistochemical evidence. Scientific Reports. 7 (1), 8752 (2017).
- Gutscher, M., et al. Proximity-based protein thiol oxidation by H2O2-scavenging peroxidases. Journal of Biological Chemistry. 284 (46), 31532-31540 (2009).
- Bilan, D. S., Belousov, V. V. New tools for redox biology: from imaging to manipulation. Free Radical Biology and Medicine. 109, 167-188 (2016).
- Abu-Siniyeh, A., Al-Zyoud, W. Highlights on selected microscopy techniques to study zebrafish developmental biology. Laboratory Animal Research. 36 (1), 12 (2020).
- Sassen, W. A., Koster, R. W. A molecular toolbox for genetic manipulation of zebrafish. Advances in Genomics and Genetics. 5, 151-163 (2015).
- Rosen, J. N., Sweeney, M. F., Mably, J. D. Microinjection of zebrafish embryos to analyze gene function. Journal of Visualized Experiments. (25), e1115 (2009).
- Avdesh, A., et al. Regular care and maintenance of a Zebrafish (Danio rerio) laboratory: An introduction. Journal of Visualized Experiments. (69), e4196 (2012).
- Chen, Z., et al. Primary neuron culture for nerve growth and axon guidance studies in Zebrafish (Danio rerio). PLoS One. 8 (3), 57539 (2013).
- Zhang, L., Leung, Y. F. Microdissection of zebrafish embryonic eye tissues. Journal of Visualized Experiments. (40), e2028 (2010).
- Suter, D. M. Live cell imaging of neuronal growth cone motility and duidance in vitro. Cell Migration: Methods in Molecular Biology. , 65-86 (2011).
- Weaver, C. J., et al. nox2/cybb deficiency affects zebrafish retinotectal connectivity. Journal of Neuroscience. 38 (26), 5854-5871 (2018).
- Morgan, B., Sobotta, M. C., Dick, T. P. Measuring EGSH and H2O2 with roGFP2-based redox probes. Free Radical Biology and Medicine. 51, 1943-1951 (2011).
- Li, Z., et al. Phenylthiourea specifically reduces zebrafish eye size. PLoS One. 7 (6), 40132 (2012).
- Ermakova, Y. G., et al. Red fluorescent genetically encoded indicator for intracellular hydrogen peroxide. Nature Communications. 5, 5222 (2014).
- Oparka, M., et al. Quantifying ROS levels using CM-H2DCFDA and HyPer. Methods. 109, 3-11 (2016).
- Dickinson, B. C., Peltier, J., Stone, D., Schaffer, D. V., Chang, C. J. Nox2 redox signaling maintains essential cell populations in the brain. Nature Chemical Biology. 7 (2), 106-112 (2011).
- Cannon, M. B., Remington, S. J. Redox-sensitive green fluorescent protein: Probes for dynamic intracellular redox responses. A review. Methods in Molecular Biology. 476, 51-65 (2009).
- Meyer, A. J., Dick, T. P. Fluorescent protein-based redox probes. Antioxidants & Redox Signaling. 13 (5), 621-650 (2010).
- Panieri, E., Millia, C., Santoro, M. M. Real-time quantification of subcellular H2O2 and glutathione redox potential in living cardiovascular tissues. Free Radical Biology and Medicine. 109, 189-200 (2017).
- Breus, O., Dickmeis, T. Genetically encoded thiol redox-sensors in the zebrafish model: Lessons for embryonic development and regeneration. Biological Chemistry. , (2020).
- Morgan, B., et al. Real-time monitoring of basal H2O2 levels with peroxiredoxin-based probes. Nature Chemical Biology. 12 (6), 437-443 (2016).
- Terzi, A., Roeder, H., Weaver, C. J., Suter, D. M. Neuronal NADPH oxidase 2 regulates growth cone guidance downstream of slit2/robo2. Developmental Neurobiology. , (2020).
- Bilan, D. S., Belousov, V. V. HyPer family probes: State of the art. Antioxidants & Redox Signaling. 24 (13), 731-751 (2016).
- Ermankova, Y. G., et al. SypHer3s: a genetically encoded fluorescent ratiometric probe with enhanced brightness and an improved dynamic range. Chemistry Communications. 54 (23), 2898-2901 (2018).
- Pak, V. V., et al. Ultrasensitive genetically encoded indicator for hydrogen peroxide identifies roles for the oxidant in cell migration and mitochondrial function. Cell Metabolism. 31 (3), 642-653 (2020).
- Kwan, K. M., et al. The Tol2kit: A multisite gateway-based construction Kit for Tol2 transposon transgenesis constructs. Developmental Dynamics. 236 (11), 3088-3099 (2007).
Reprints and Permissions
Request permission to reuse the text or figures of this JoVE article
Request PermissionThis article has been published
Video Coming Soon
Copyright © 2025 MyJoVE Corporation. All rights reserved