Methods Article
3D Printing Bacteria to Study Motility and Growth in Complex 3D Porous Media
In This Article
Summary
This protocol describes a procedure for three-dimensional (3D) printing of bacterial colonies to study their motility and growth in complex 3D porous hydrogel matrices that are more akin to their natural habitats than conventional liquid cultures or Petri dishes.
Abstract
Bacteria are ubiquitous in complex three-dimensional (3D) porous environments, such as biological tissues and gels, and subsurface soils and sediments. However, the majority of previous work has focused on studies of cells in bulk liquids or at flat surfaces, which do not fully recapitulate the complexity of many natural bacterial habitats. Here, this gap in knowledge is addressed by describing the development of a method to 3D-print dense colonies of bacteria into jammed granular hydrogel matrices. These matrices have tunable pore sizes and mechanical properties; they physically confine the cells, thus supporting them in 3D. They are optically transparent, allowing for direct visualization of bacterial spreading through their surroundings using imaging. As a proof of this principle, here, the capability of this protocol is demonstrated by 3D printing and imaging non-motile and motile Vibro cholerae, as well as non-motile Escherichia coli, in jammed granular hydrogel matrices with varying interstitial pore sizes.
Introduction
Bacteria often inhabit diverse, complex 3D porous environments ranging from mucosal gels in the gut and lungs to soil in the ground1,2,3,4,5,6,7,8,9,10,11,12,13,14,15,16,17,18,19,20,21,
22,23,24,25. In these settings, bacterial movement through motility or growth can be impeded by surrounding obstacles, such as polymer networks or packings of solid mineral grains-influencing the ability of the cells to spread through their environments26, access nutrient sources, colonize new terrain, and form protective biofilm communities27. However, traditional lab studies typically employ highly simplified geometries, focusing on cells in liquid cultures or on flat surfaces. While these approaches yield key insights into microbiology, they do not fully recapitulate the complexity of natural habitats, leading to dramatic differences in growth rates and motility behavior compared to measurements performed in real-world settings. Therefore, a method to define bacterial colonies and study their motility and growth in 3D porous environments more akin to many of their natural habitats is critically needed.
Inoculating cells into an agar gel and then visualizing their macroscopic spreading by eye or using a camera provides one straightforward way to accomplish this, as first proposed by Tittsler and Sandholzer in 193628. However, this approach suffers from a number of key technical challenges: (1) While the pore sizes can, in principle, be varied by varying the agarose concentration, the pore structure of such gels is poorly defined; (2) Light scattering causes these gels to be turbid, making it difficult to visualize cells at the individual scale with high resolution and fidelity, particularly in large samples; (3) When the agar concentration is too large, cell migration is restricted to the top flat surface of the gel; (4) The complex rheology of such gels makes it challenging to introduce inocula with well-defined geometries.
To address these limitations, in previous work, Datta's lab developed an alternate approach using granular hydrogel matrices - comprised of jammed, biocompatible hydrogel particles swollen in liquid bacterial culture - as "porous Petri dishes" to confine cells in 3D. These matrices are soft, self-healing, yield-stress solids; thus, unlike with cross-linked gels used in other bioprinting processes, an injection micronozzle can move freely inside the matrix along any prescribed 3D path by locally rearranging the hydrogel particles29. These particles then re-densify rapidly and self-heal around injected bacteria, supporting the cells in place without any additional harmful processing. This process is, therefore, a form of 3D printing that enables bacterial cells to be arranged - in a desired 3D structure, with a defined community composition - within a porous matrix having tunable physicochemical properties. Moreover, the hydrogel matrices are completely transparent, enabling the cells to be directly visualized using imaging.
The utility of this approach has been demonstrated previously in two ways. In one set of studies, dilute cells were dispersed throughout the hydrogel matrix, which enabled studies of the motility of individual bacteria30,31. In another set of studies, multicellular communities were 3D-printed in centimeter-scale gels using an injection nozzle mounted on a programmable microscope stage, which enabled studies of the spreading of bacterial collectives through their surroundings32,33. In both cases, these studies revealed previously unknown differences in the spreading characteristics of bacteria inhabiting porous environments compared to those in liquid culture/on flat surfaces. However, given that they were mounted on a microscope stage, these previous studies were limited to small sample volumes (~1 mL) and, therefore, short experimental time scales. They were also limited in their ability to define inocula geometries with high spatial resolution.
Here, the next generation of this experimental platform that addresses both limitations is described. Specifically, protocols are provided by which one can use a modified 3D printer with an attached syringe extruder to 3D print and image bacterial colonies at large scales. Moreover, representative data indicates how this approach can be useful for studying the motility and growth of bacteria, using the biofilm-former Vibrio cholerae and planktonic Escherichia coli as examples. This approach enables bacterial colonies to be sustained over long times and visualized using various imaging techniques. Hence, the ability of this approach to study bacterial communities in 3D porous habitats has tremendous research and applied potential, impacting the treatment and study of microbes in the gut, the skin, the lung, and the soil. Moreover, this approach could be used in the future for 3D printing bacteria-based engineered living materials into more complex freestanding shapes.
Protocol
This approach is to convert a commercial 3D fused deposition modeling printer into a 3D bioprinter using a previously established protocol by Tashman et al.34. In brief, Tashman et al. replaced a commercial extruder head with a custom-made syringe pump extruder. This extruder enables the printing of highly concentrated liquid suspensions of bacterial cells in 3D, with its extruded volume and 3D position controlled by the G-code programming language. The extruded volume is specified in the software by the extruder step (E-step) and is additionally calibrated as described further below. These bacterial suspensions are thereby printed directly into a granular hydrogel matrix, which acts as a 3D support for the cells. Below, the protocol also describes how to prepare matrices with different polymer concentrations, characterize the resulting changes in pore size and rheological properties, and characterize subsequent bacterial motility and growth using direct imaging.
1. Conversion of a commercial 3D printer into a 3D bioprinter
- Remove the extruder and the heater from a commercial 3D printer (see Table of Materials).
- Follow previous protocols to fabricate the syringe pump extruder34, with an additional modification to accommodate a disposable Luer lock syringe. Mount the syringe pump extruder onto the printer.
NOTE: The CAD files required for modifying the syringe pump extruder for plastic syringes are provided in Supplementary Files 1-3. - Install and open the 3D printer software (see Table of Materials) on a computer. Connect the 3D printer to the computer.
- Load a 1 mL disposable syringe with an appropriately sized needle into the 3D-printed clamps by aligning the top and bottom halves of the mechanism (Figure 1). Secure the clamps around the syringe using three M8 socket bolts and thin steel hex nuts (see Table of Materials). The syringe plunger connects with the lead screw in the syringe pump extruder. Manually raise the plunger by rotating the lead screw to create an 0.5 mL of air gap in the syringe.
- If contamination is a concern for the experiment, transport the syringe-clamp complex to a biohood and sterilize with 70% ethanol spray upon entry before completing the following steps.
2. Preparation of the bacterial suspension
- For V. cholerae and E. coli, grow overnight on a 2% Lennox LB (Luria Broth, see Table of Materials) agar plate at 37 °C.
- For V. cholerae, inoculate the cells into 3 mL of liquid LB with ten sterile glass beads. Grow the cells in a shaking incubator at 37 °C for 5-6 h until the mid-exponential phase to an optical density (OD) 600 of ~0.9.
- For E. coli, inoculate the cells into 3 mL of liquid LB. Grow the cells in a shaking incubator at 37 °C overnight. Innoculate 200 µL of the overnight culture in fresh LB for 3 h until the OD reaches 0.6.
- Transfer the culture into a 10 mL centrifuge tube. Centrifuge the culture for 5 min at 5,000 x g at room temperature to form a pellet. Remove the supernatant. Resuspend with ~10 µL of liquid LB to achieve a cell density of ~9 x 10¹⁰ cells per mL.
3. Loading the bacterial suspension into the syringe
NOTE: Two methods are provided for loading the bacteria into the syringe (step 3.1 and step 3.2). Step 3.1 works for loading small volumes of bacterial suspensions, <200 µL, and step 3.2 works for loading larger volumes of bacterial suspensions, >200 µL. Step 3.1 was utilized for the representative results shown here.
- Load an empty 1 mL plastic Luer lock syringe into the 3D bioprinter. Connect the syringe plunger with the lead screw. Manually retract the syringe to add 0.2 mL of the air gap to provide space for the plunger to move in the syringe as a small volume of cells ~20-50 µL are used for each batch of experiments.
- Attach a blunt needle to the syringe tip with the needle size necessary for the size of print features required. Here, a 2-inch 20 G needle is used.
- Load the bacterial suspension into the syringe by placing a 10 mL centrifuge tube with the bacterial inoculum below the needle. Manually rotate the screw to retract the syringe plunger and load the cells into the syringe. The bacterial cell volumes are so small that often, the cells are only loaded into the needle.
- Remove the plunger from the syringe-clamp complex and use another syringe and needle to carefully load the syringe-clamp complex with the desired bacterial suspensions, being careful to avoid trapping air bubbles. The syringe-clamp complex should be filled slightly over the brim with the desired bacterial suspension and then transferred to the bioprinter.
- Carefully insert the syringe-clamp complex without the plunger into the corresponding socket on the main core of the bio-printer extruder.
- Ensure that the printer carriage is approximately halfway up the lead screw, and a collection dish is present under the loaded syringe. Then, carefully insert the plunger through both the carriage and the syringe-clamp complex until it catches on the carriage. Depress the plunger slowly into the bacterial suspension to avoid trapping air bubbles in the syringe.
- Slide the adaptor clamp onto the carriage over the back of the plunger to secure it in place for both extrusion and retraction maneuvers.
4. Calibration of the extruder step to deposited volume
- To calibrate the extruder step (E-step) to the deposited volume, first set up the bio-printer with the exact syringe, syringe needle, and depositing bacterial suspension that will be used in the experiment. Here, a 1 mL Luer lock syringe is used.
- Determine an estimated E-step range to calibrate over by extruding an arbitrary E-step number (~200) and note the plunger volume change with syringe volume markers.
- Use this coarse E-step to volume ratio to determine the E-step settings to perform the calibration sweep over. For example, if an E-step of 200 extrudes approximately 20 µL by visual inspection and one wants to deposit 10-200 µL, test E-steps between 100-2000.
- To perform the linear calibration sweep, first label and measure the dry mass of twenty 1.5 mL sampling tubes on an analytical balance with 0.1 mg sensitivity.
- Extrude bacterial suspension into the pre-measured 1.5 mL tubes. For each E-step, perform at least 2 replicates. Repeat for all E-steps over the linear range, replacing bacterial suspension as necessary. If contamination is a concern for the experiment, wipe the exterior of the syringe needle with a lint-free wipe saturated with 70% ethanol after each sample.
- Measure the mass of all 1.5 mL tubes with the same analytical balance. Subtract the first mass value from the second to obtain a net mass of bacterial suspension deposited.
- Convert the mass of bacterial suspension into a volume with the material density. For many bacterial suspensions composed primarily of water, 1 g/mL is an appropriate density approximation.
- Perform a linear fit between the E-step and the extruded volume to finish the calibration process.
5. Preparation of the granular hydrogel matrix
- In a biosafety cabinet, add dry granules of cross-linked acrylic acid/alkyl acrylate copolymers (see Table of Materials) to 400 mL of 2% Lennox Luria-Bertani (LB) to keep the matrix sterile; however, other liquid cell culture media can also be used to swell the hydrogel matrix.
NOTE: The weight percent of granules added to the LB depends on the pore size that one is aiming for. In the present study, for a 0.9% granular hydrogel matrix, 3.6 g of dry granules are added to the LB and for a 1.2% granular hydrogel matrix, 4.8 g of dry granules are added to the LB. The hydrogel granules are homogenously dispersed by mixing them in a stand mixer for 2 min. - Once mixed, adjust the pH to 7.4 by adding 20 to 500 µL increments of 10 M sodium hydroxide (NaOH) to ensure cell viability. After each addition of NaOH, measure the pH by dipping a pipette tip into the mixture and then wiping the hydrogel matrix onto a pH test paper.
NOTE: As the NaOH is added, the viscosity of the mixture will increase as the hydrogel granules start to swell. The swollen hydrogel granules are ~5 µm to 10 µm in diameter and jammed together in a hydrogel matrix. The internal mesh size of the granules is ~40 nm to 100 nm, as previously established32. The mesh size is large enough for small molecules (e.g., oxygen and nutrients) to freely diffuse but small enough for bacteria to be confined between the interstitial pores. - Next, transfer the granular hydrogel matrix to a 50 mL centrifuge tube using a 50 mL sterile plastic syringe. Centrifuge the hydrogel matrix at 161 x g for 1 min at room temperature to remove the bubbles formed during the mixing process.
- Allow the hydrogel matrix to sit for at least 2 days at room temperature to ensure that no contamination has occurred. The contamination appears as microcolonies suspended in the hydrogel matrix. After two days, centrifuge the hydrogel matrix at 161 x g for 1 min to remove any additional bubbles that formed.
NOTE: The protocol can be paused here by storing the hydrogel matrix at room temperature for up to a week. - In the biosafety cabinet, using a 30 mL sterile plastic syringe, transfer the desired amount of hydrogel matrix to the container where printing will occur (here ~20 mL for a 20 mL tissue culture flask or 1 mL for 1 mL plastic micro cuvettes were used).
6. Characterization of the granular hydrogel matrix rheological properties
- Load ~3 mL of the hydrogel matrix into a shear rheometer (see Table of Materials) with a 1 mm gap between roughened 50 mm diameter parallel plates to measure the rheological properties.
- Quantify the yield behavior using unidirectional shear measurements on the shear rheometer by measuring the shear stress as a function of a logarithmic sweep of shear rate from 10-4 s-1 to 102 s-1 (e.g., Figure 2A).
NOTE: At low shear rates, the hydrogel matrix will have a constant shear stress (the yield stress) that is independent of the shear rate. At high shear rates, the shear stress will increase with a power-law dependence on the shear rate, indicating the fluidizing of the hydrogel matrix. This yield-stress behavior allows bacteria to be 3D printed within the granular hydrogel matrix29. - Measure the storage and loss moduli, G' and G'' respectively, as a function of frequency using small amplitude oscillatory rheology with a strain amplitude of 1% and frequencies between 0.1 to 1 Hz (e.g., Figure 2B).
NOTE: The ideal granular hydrogel matrix for 3D printing should have a storage modulus larger than the loss modulus, which indicates the medium acts as a jammed elastic solid29.
7. Characterization of the granular hydrogel matrix interstitial pore size
- Sonicate 100 nm carboxylated fluorescent polystyrene nanoparticles (~3.6 x 10¹³ particles/mL, see Table of Materials) in their packaging for 15 min to resuspend to break up any aggregations/clusters of particles. Transfer 50 µL of nanoparticles to a 1.5 mL microcentrifuge tube.
- Centrifuge for 10 min at 9,500 x g at room temperature until the pellet forms and the supernatant is clear. Remove the supernatant and resuspend the pellet in 1 mL of the liquid growth media (here LB) used to prepare the granular hydrogel matrix.
NOTE: The protocol can be paused here by storing the resuspended nanoparticles at 4 °C for up to 3 months.
- Centrifuge for 10 min at 9,500 x g at room temperature until the pellet forms and the supernatant is clear. Remove the supernatant and resuspend the pellet in 1 mL of the liquid growth media (here LB) used to prepare the granular hydrogel matrix.
- Sonicate the resuspended nanoparticles for 30 min. Transfer 1 mL of granular hydrogel matrix to a 1.5 mL microcentrifuge tube. Add 1 µL of the resuspended nanoparticles to the granular hydrogel matrix and mix them with a pipette tip. After mixing, centrifuge for 30 s at 161 x g at room temperature.
- Transfer the hydrogel matrix and the nanoparticle mixture to a 35 mm diameter Petri dish with a 0.1 mm thick glass bottom well. The well is 20 mm in diameter and 1 mm in depth. Place a glass coverslip on top and press down to disable flow and evaporation during imaging. An alternative to the glass coverslip is to add 1 mL of paraffin oil on the top.
- Image the nanoparticles using a confocal microscope with a 40x oil objective with 8x additional zoom in the imaging software (see Table of Materials).
NOTE: A higher magnification objective could be used instead of using additional digital zoom in the software.- Image a time loop with no delay (ideally ~19 frames/s) in a single z-plane for 2 min with at least four nanoparticles within the field of view. Repeat 15 to 20 times in different locations to collect enough data for statistics (100 to 200 nanoparticles).
- Use a particle tracking software to analyze the displacement of the particles. Here, a custom-written script is used based on the classic Crocker-Grier algorithm to track the center of mass of the nanoparticle35 (see Supplementary File 7).
- From the particle tracking, calculate the mean square displacement (MSD). The MSD will exhibit free diffusion in the pore space at short lengths and time scales and transition to sub-diffusive scaling at large lengths and time scales due to confinement35.
- Identify the length scale where the transition to sub-diffusive scaling occurs to estimate the local pore size. Calculate pore size by adding this length scale to the nanoparticle diameter. Repeat the pore size analysis for every nanoparticle measured. This will yield a pore size distribution from which a mean pore size can be calculated (e.g., Figure 3).
8. 3D printing process
- 3D-print custom-made holders for the sample containers (see Supplementary Files 4-6 for the CAD files). Here, holders for the tissue culture flasks and microcuvettes are used. The holders allow for programming the printer to print multiple samples in a single print session. Place the sample containers with hydrogel media in the holders on the build platform.
- Open the 3D printing software. Load a pre-programmed g-code into the software. For the representative results, step 3.1 is used to load the bacterial suspension into the 3D printer.
NOTE: An example of a g-code for printing linear vertical geometries is given in Table 1. - Through the 3D printing software, move the x-y-z planes to center the print head on the x-y plane to be the first container and then home the z-axis. The homing z-axis will raise the print head. Manually rotate the screw slowly to depress the syringe plunger until a small amount of the bacterial suspension can be seen at the tip of the needle.
- Lightly wipe the excess bacterial suspension off with a sterile disposable wipe. Based on the height of the sample holder, needle, and syringe, using the 3D printing software, lower the print head a fixed distance into the hydrogel media in the sample container of choice. Start the printing process by clicking on Print.
- Once the printing is complete, close the sample containers. Wipe down the printer with 70% ethanol. Properly dispose of the syringe and needle.
9. Growing and imaging the V. cholerae
- For large field-of-view imaging, use a camera with a zoom lens attachment to image cell growth with a lightbox. Image the samples right after printing at room temperature and then transfer them to an incubator. Maintain samples at 37 °C in a stationary incubator between imaging sessions during the experiment.
- Capture images over a desired amount of time to observe the growth behavior at long periods in the granular hydrogel matrix.
Results
Using a 3D bioprinter with the granular hydrogel matrix expands the capabilities of bioprinters to print bacterial colonies into shapes that, when printed on a flat substrate instead, would slump due to the low viscosity of the bacterial suspension. The resolution of the approach presented here depends on the extrusion speed, size of the needle, speed of the print head, air in the needle, and viscosity of the bacterial suspension. Due to the low volume of bacterial suspension, air bubbles may be inadvertently introduced during the loading of the bacterial suspension into the syringe and needle. This can lead to an air bubble being deposited in the final printed structure (Figure 4). Another way for air bubbles to be introduced into the print is if one does not depress the plunger to form a small drop of bacterial suspension at the tip of the needle before printing and an air gap exists at the tip of the needle. Not depressing the syringe plunger before printing can also lead to different volumes of cells being printed in the same batch. However, as time progresses, the air bubble dissolves into the surrounding medium, as shown in Figure 4.
For calibrating the extrusion step, the deposited volume is dependent on how the linear actuator of the print head translates the syringe plunger, the inner diameter of the syringe will directly impact the volume. Further, the rheological properties of bacterial suspension will impact how easily they shear through the needle contraction to print smoothly. Thus, this calibrating procedure should be redone for every syringe/needle/bacterial suspension setup. In principle, syringe calibration could be automated. However, in practice, writing such a code that broadly applies to many use cases would be challenging. For example, a user aiming to calibrate the extrusion of approximately 300 µL from a 1 mL syringe would need to re-load the syringe much more frequently than a user calibrating around a target volume of 30 µL. Since the E-step to volume calibration constant is unknown when the calibration process begins, the user may not be able to predict exactly how frequently re-loading is actually required. Further, to automate the calibration process, the exact positions of each pre-weighed 1.5 mL tube would need to be specified. To ensure all the bioink is deposited from the needle into the tube for accurate calibration, precise contact must be made between the needle and the tube bottom/wall. Without good contact, small droplets may remain wetted and attached to the needle. Thus, any positional variation between tubes might greatly contribute to errors in the calibration process. For these reasons, the authors recommend that each user builds a calibration program that fits their unique needs.
A key feature of the approach presented here is the ability to visualize bacteria spreading through their environments directly via motility and growth using imaging. In an earlier version of the protocol for imaging, 6-well plates were filled with 19 mL of a granular hydrogel matrix. However, even with a successful 3D print of a horizontal line of cells that could be observed on an inverted microscope, a dense colony would also grow on the top surface of the medium, limiting visualization with brightfield microscopy (Figure 5). The colony on the top surface likely resulted from contamination as the syringe needle was placed into or removed from the medium during printing. To circumvent this issue, vertical lines of cells are printed in scintillation vials (Figure 6A). However, the curvature of the cylindrical vials caused distortion during imaging. This led to the selection of flat-walled cuvettes and tissue culture flasks as the sample containers for printing, allowing for undistorted imaging (Figure 6B-D). One limitation of tissue culture flasks is the small tilted neck that limits the geometries that can be printed.
Taken together, this protocol allows for the observation of bacterial motility and growth in complex porous environments over long time scales. Some examples are shown in Figure 6B-G for biofilm-forming V. cholerae using brightfield microscopy as well as planktonic cells of E. coli using laser-scanning fluorescence confocal microscopy-demonstrating the versatility of this approach. Indeed, a potential issue of hydrogel matrices is their possible autofluorescence when imaged using fluorescence microscopy; however, the images shown in Figure 6F,G demonstrate that such autofluorescence is minimal in the experimental platform presented here. Another limitation of such optical microscopy approaches is their spatial resolution, which is set by the diffraction limit at ~100 s nanometers; however, this length scale is much smaller than the size of an individual bacterial cell, and therefore, optical techniques provide the capability to image bacterial cells from the scale of individual cells (Figure 6G) to the scale of larger, multicellular colonies30,31,32,33. Additional examples are described below.
As noted above, the approach presented here can be used to 3D-print and image bacterial colonies in small (1 mL) and large (20 mL) matrix volumes. Hence, the differences in the results obtained using different volumes are described below, using 3D-printed colonies of motile and non-motile V. cholerae as representative examples. The spatial resolution (width of the line) of the print is set by the inner diameter of the nozzle. In the examples described below, a needle with an inner diameter of 0.6 mm results in an initial cylindrical colony of 0.6 mm. Previous work has demonstrated that the print resolution can be reduced even further by using a pulled glass capillary with an inner diameter of ~100-200 µm33.
For the small volumes, two different granular hydrogel matrices with two different pore size distributions are used: one with a mean pore size larger than the average diameter of a V. cholerae cell, 0.2-0.4 µm36, and the other with a mean pore size smaller than this diameter. The samples over twelve days are imaged and measured through image analysis of the areal expansion of the colonies over time (Figure 7 and Figure 8). For non-motile cells, which can only spread through their surroundings through cellular growth, the rate of areal expansion was similar between the different matrices investigated (Figure 7), indicating that differences in matrix pore size do not influence cellular spreading through growth - as expected. By contrast, for the motile cells that spread through their surroundings through active motility, the rate of areal expansion of V. cholerae was higher for the hydrogel matrix with the larger pores-for which confinement by the hydrogel grains impedes cellular motility less. These differences in bacterial spreading were also apparent in the colony morphologies (Figure 8). The colony of V. cholerae in hydrogel matrices with larger pores spread through smooth, diffuse plumes (Figure 8A), reflecting spreading through active motility as previously observed32. Indeed, consistent with this interpretation, these diffuse plumes are not observed in the case of non-motile cells (Figure 8C). Additionally, the pores are sufficiently large that the cells do not push the beads as they swim through the pores. Moreover, the viscous stress applied by swimming is less than 1 Pa, which is insufficient to deform the surrounding hydrogel matrix appreciably. By contrast, the colony in hydrogel matrices with smaller pores spreads only through rough, fractal-like plumes for both motile and non-motile cells (Figure 8B,D), reflecting spreading solely through cellular growth, whereas the cells grow they transiently deform and yield the surrounding matrix. In fact, given that the yield stress of the hydrogel matrices is much smaller than the turgor pressure of the cells, in this limit of small pore size, the matrix only provides weak resistance to cellular growth and does not appear to strongly affect the 3D printed structure, also as verified in our previous work37.
Similar results are observed for experiments performed in large-volume samples; however, given the greater abundance of nutrients in these samples, the experiments could sustain cellular growth over longer time scales. As an example, results using the granular hydrogel matrices where the average pore size was less than the cell size are shown - and thus, cellular spreading was primarily due to growth. The samples are imaged for ~30 days in the granular hydrogel matrices and observed similar areal expansion for both non-motile and motile cells for the first 150 h; however, at even longer times, strong variability is observed between samples, with some samples exhibiting faster rates of spreading (Figure 9 and Figure 10). Interestingly, upon resampling the hydrogel matrix after the experiment - a benefit of the large volume of the hydrogel matrix - a decrease in yield stress, storage moduli, and loss moduli are measured (Figure 11), indicating that the matrices became softer. This change could be due to the V. cholerae producing a molecule that is changing the hydrogel matrix properties and promoting cellular spreading at long times, which will be interesting to test in future research. Examples of the rough, fractal-like colony morphologies that result in these experiments are shown in Figure 10.
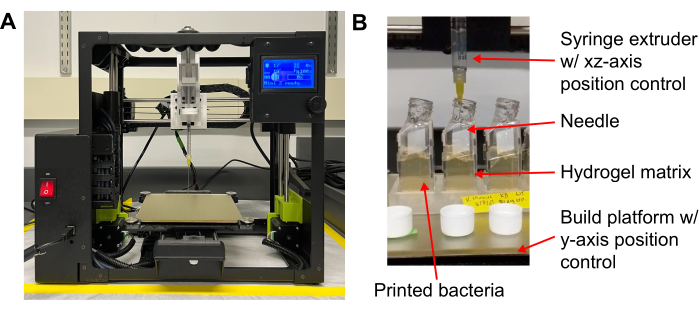
Figure 1: Images of the custom-built 3D bioprinter. (A) Bioprinter with a modified syringe pump extruder head with a disposable Luer lock syringe and needle. Bioprinter is ~46 cm wide. (B) Image of 3D printing of cells in flasks filled with jammed hydrogel matrix. The width of the image is 87 mm. Please click here to view a larger version of this figure.
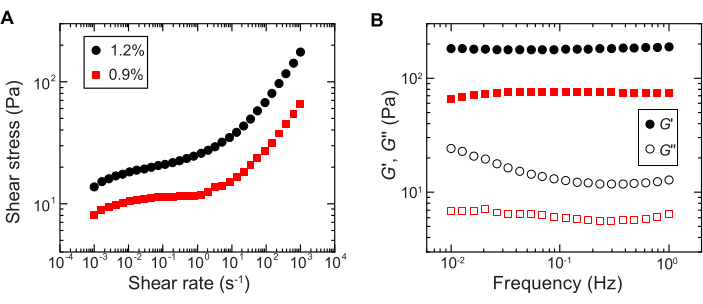
Figure 2: Characterization of the rheological properties of the granular hydrogel matrices. (A) Shear stress as a function of the applied shear rate. (B) Storage and loss moduli, G' and G'' respectively, as a function of oscillation frequency. The legend indicates the hydrogel mass fraction used to prepare each hydrogel matrix. Please click here to view a larger version of this figure.
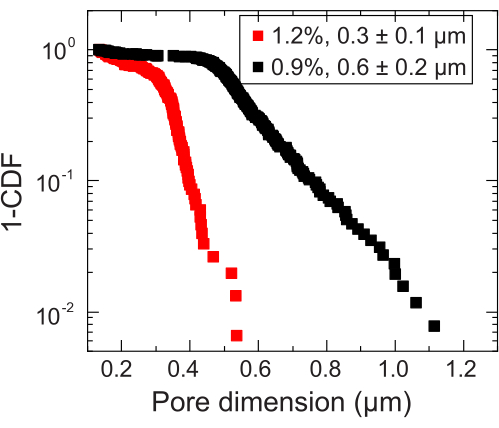
Figure 3: Pore size measurements of two representative granular hydrogel matrices. By tracking tracers, the distribution of characteristic pore dimensions is determined for each hydrogel matrix. The data are represented by 1-CDF, where CDF is the cumulative distribution function. The legend indicates the hydrogel mass fraction used to prepare each matrix. Please click here to view a larger version of this figure.
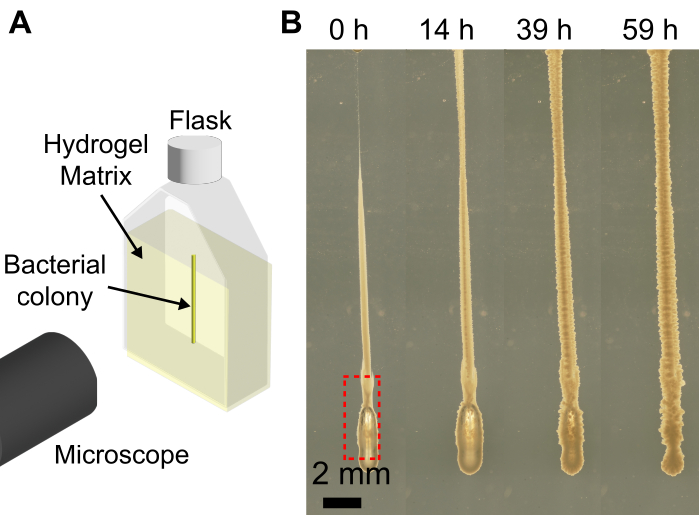
Figure 4: Examples of bubbles formed during 3D printing of bacteria. (A) Schematic of the imaging setup. (B) Snapshots of the growth of V. cholerae with a bubble at the bottom of the print (red box) in 1.2% hydrogel matrix swollen in LB. After 59 h of growing at 37 °C, the air bubble is fully dissolved, and the colony collapses back due to the elasticity of the hydrogel matrix. Scale bar = 2 mm. Please click here to view a larger version of this figure.
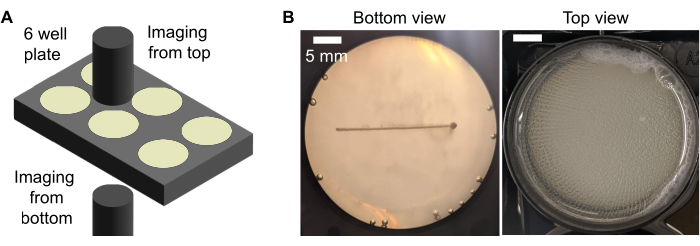
Figure 5: Images of the horizontal line of motile V. cholerae printed in a six-well plate filled with 1.2% hydrogel matrix swollen in LB and the biofilm that formed on the top surface after 48 h of incubation at 37 °C. (A) Schematic of the imaging setup. (B) The biofilm formation on the top surface due to contamination during 3D printing decreases the opacity and does not allow for clear imaging of the horizontal line. The top surface forms wrinkles, presumably due to differential growth. Scale bar = 5 mm. Please click here to view a larger version of this figure.
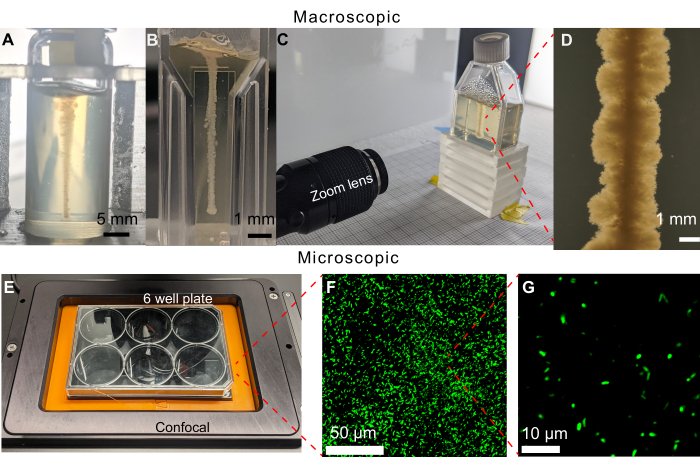
Figure 6: Examples of different sample containers that can be used in this method. (A) V. cholerae printed in a glass vialfilled with 1.2% granular hydrogel matrix after 470 h. The curvature of the vial makes imaging the growth difficult. Scale bars = 5 mm. (B) V. cholerae printed in a micro-cuvette filled with 1.2% granular hydrogel matrix. The flat sides allow for clear imaging, however, the small volumes limit the length of experiments before cells run out of growth substrates. (C) Imaging setup with a zoom lens to image V. cholerae printed in a tissue culture flask filled with 1.2% granular hydrogel matrix. Similar to the micro-cuvette case, the flat sides allow for clear imaging. The tissue culture flasks can be filled with larger volumes of granular hydrogel matrix, therefore lengthening the experimental time span. (D) Image from the zoom lens of the V. cholerae printed inside a 1.2% granular hydrogel matrix after 100 h of incubation at 37 °C. Scale bar = 1 mm. (E) Imaging setup with a confocal microscope to image fluorescent cells. (F) 3D projection of confocal micrographs of fluorescent E. coli inside the 1.2% granular hydrogel matrix after 10 days of incubation at 37 °C. Scale bar = 50 µm. (G) Single-cell resolution confocal micrograph of fluorescent E. coli inside the hydrogel matrix. Scale bar = 10 µm. Please click here to view a larger version of this figure.
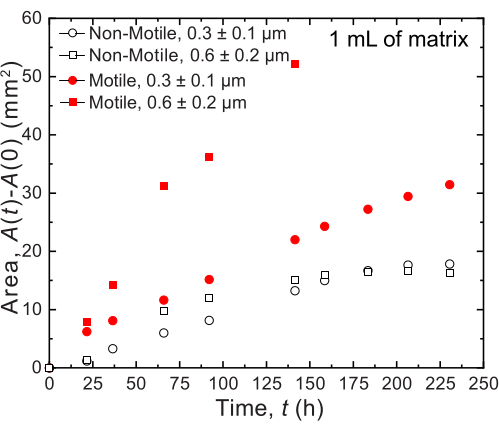
Figure 7: Area expansion as a function of time of colonies of V. cholerae printed in 1 mL of granular hydrogel support matrices. The data on the plot is from the image analysis of Figure 8. It was observed that motile cells (closed red circle and square) spread at a faster rate than the non-motile cells, reflecting spreading by both growth and motility. Additionally, the motile cells in the hydrogel matrix with a large pore size (red squares) spread at a faster rate than the cells in the hydrogel matrix with 0.3 µm pores (red circles). Non-motile cells show no difference in areal expansion rate between the two pore sizes, as they are only growing. Please click here to view a larger version of this figure.
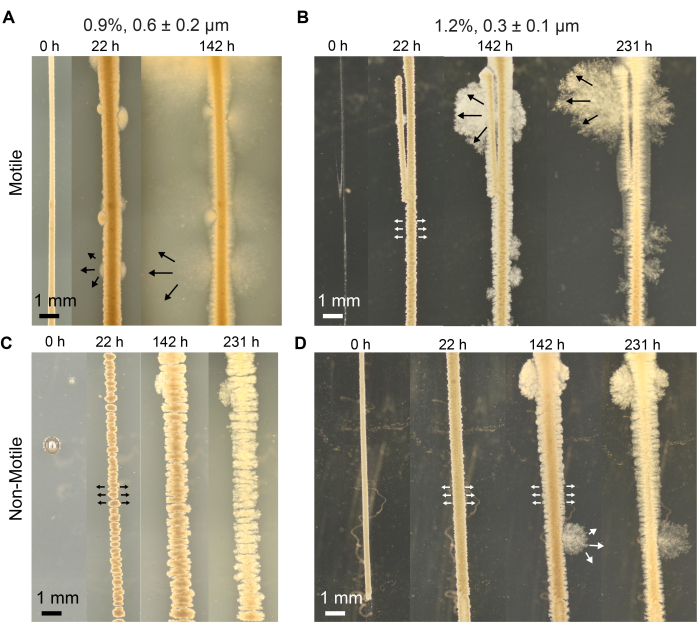
Figure 8: Colonies of V. cholerae printed in 1 mL of granular hydrogel support matrices. (A) Snapshots of the growth and motility of motile V. cholerae in 0.9% granular hydrogel matrix where the pore size is larger than the average cell diameter. Arrows indicate a diffuse plume that forms due to cells moving through the hydrogel matrix. (B) Snapshots of the growth and motility of motile V. cholerae in a 1.2% granular hydrogel matrix where the pore size is smaller than the average cell diameter. Arrows indicate rough, fractal-like plume that forms due to cellular growth. (C) Snapshots of the time evolution of non-motile V. cholerae in 0.9% granular hydrogel matrix where the pore size is larger than the average cell diameter. In this case, diffuse plumes reflecting motility are not observable. (D) Snapshots of the growth of non-motile V. cholerae in a 1.2% granular hydrogel support matrix where the pore size is smaller than the average cell diameter. In this case, rough, fractal-like plumes reflecting growth are again observable. Scale bars = 1 mm. Please click here to view a larger version of this figure.
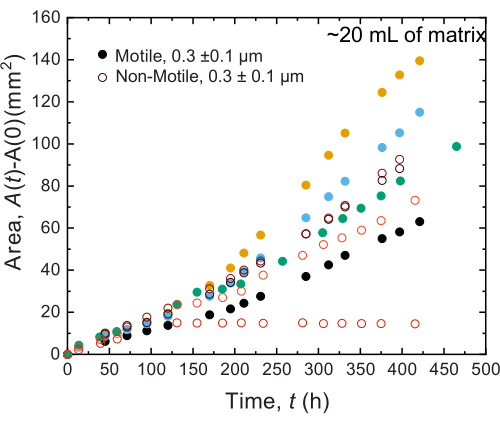
Figure 9: Area expansion as a function of time of colonies of V. cholerae printed in 20 mL of 1.2% granular hydrogel support matrices. Non-motile (open circles) and motile cells (closed circles) are observed to spread at similar rates for the first 100 h. After 100 h, differences in the areal expansion rates are observed, potentially due to the evolution of variability at long times. Please click here to view a larger version of this figure.
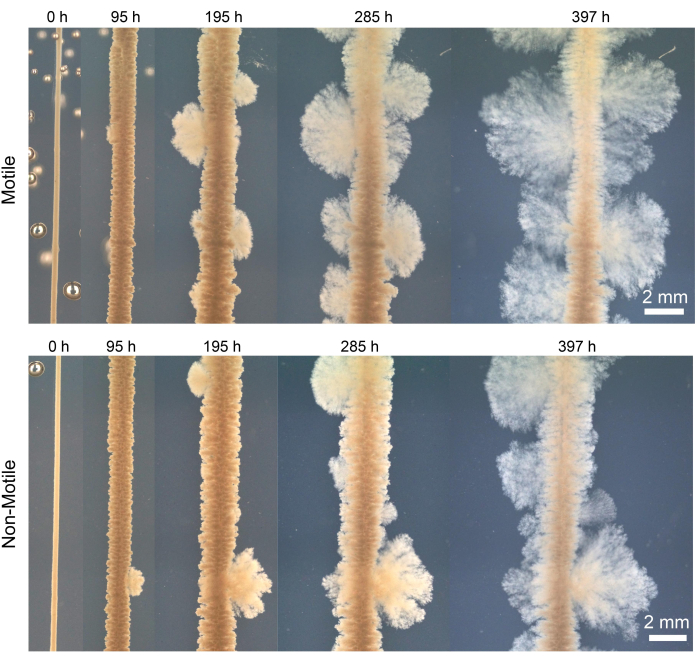
Figure 10: Colonies of V. cholerae printed in 22 mL of 1.2% granular hydrogel matrices grown at 37 °C. (Top) Snapshots of growth of motile V. cholerae. (Bottom) Snapshots of the growth of non-motile V. cholerae. In both cases, rough, fractal-like plumes reflecting growth are observable. Scale bars = 2 mm. Please click here to view a larger version of this figure.
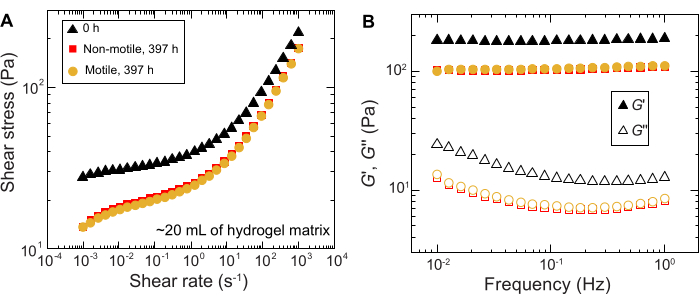
Figure 11: Characterization of the rheological properties of the 1.2% granular hydrogel matrix before (0 h) and after the experiment (397 h). (A) Shear stress as a function of the applied shear rate. (B) Storage and loss moduli, G' and G'' respectively, as a function of applied oscillation frequency. Please click here to view a larger version of this figure.
| Gcode Commands | Tasks | |||
| M82 | Absolute extrusion mode | |||
| M302 S0 | Enable cold extrusion | |||
| M92 E14575 | Set the extrusion steps per mm | |||
| G92 X35.61 Y81 Z0 E0.0 | Set the z-axis and extrusion position to zero, and the x-,y- position to 35.71 mm and y 88 mm where the the print head is when the g-code startts | |||
| M221 S100 T0 | sets the flow rate to 100% | |||
| M107 | Turn the fan off | |||
| G1 F1 X35.61 Y81 E0.1 | Extrude the 20 µL of bioink into the matrix at feed rate of 50 µL/min where the current position was set | |||
| G0 F200 Z60 | Pull the needle out of the matrix and sample contianer at a velocity of 200 mm/min | |||
| G0 F500 X65.81 Y81.0 | Move the needle to the next sample contiainer at a velocity of 500 mm/min | |||
| G0 F100 Z0 | Lower needle into the next sample contiainer to the same z-position where printing started at a velocity of 100 mm/min | |||
| G1 F1 X65.81 Y81.0 E0.2 | Extrude the 20 µL of bioink into the matrix at feed rate of 50 µL/min where the current position was set | |||
| G0 F200 Z60 | Pull the needle out of the matrix and sample contianer at a velocity of 200 mm/min | |||
| G0 F500 X96.01 Y81.0 | Move the needle to the next sample contiainer at a velocity of 500 mm/min | |||
| G0 F100 Z0 | Lower needle into the sample contiainer to the same z-position where printing started at a velocity of 100 mm/min | |||
| G1 F1 X96.01 Y81.0 E0.3 | Extrude the 20 µL of bioink into the matrix at feed rate of 50 µL/min where the current position was set | |||
| G0 F200 Z60 | Pull the needle out of the matrix and sample contianer at a velocity of 200 mm/min | |||
| G0 F500 X126.21 Y81.0 | Move the needle to the next sample contiainer at a velocity of 500 mm/min | |||
| G0 F100 Z0 | Lower needle into the next sample contiainer to the same z-position where printing started at a velocity of 100 mm/min | |||
| G1 F1 X126.21 Y81.0 E0.4 | Extrude the 20 µL of bioink into the matrix at feed rate of 50 µL/min where the current position was set | |||
| G0 F200 Z80 | Pull the needle out of the matrix and sample contianer at a velocity of 200 mm/min | |||
Table 1: G-code programming for printing vertical lines of the bacterial suspension.
Supplementary File 1: STL file for the bottom clamp 1 mL disposable Luer lock syringes for the syringe extruder. Please click here to download this File.
Supplementary File 2: STL file for the top clamp for 1 mL disposable Luer lock syringes for the syringe extruder. Please click here to download this File.
Supplementary File 3: STL file for the syringe adaptor for 1 mL disposable Luer lock syringes for the syringe extruder. Please click here to download this File.
Supplementary File 4: STL file for the cuvette sample holder. Please click here to download this File.
Supplementary File 5: STL file for the tissue flask sample holder. Please click here to download this File.
Supplementary File 6: STL file for the 6-well plate and 35 mm Petri dish print bed. Please click here to download this File.
Supplementary File 7: Custom script for particle tracking. Please click here to download this File.
Discussion
Critical steps in the protocol
It is important to ensure that when preparing each hydrogel matrix, the matrix is made in a sterile environment. If not, contamination can occur, which manifests as, e.g., microcolonies (small spheroids) in the matrix after several days. During the mixing process, it is important that all the dry granular hydrogel particles are dissolved. Additionally, when adjusting the pH of each hydrogel matrix with the NaOH, the granules will start to swell, which increases the viscosity of the hydrogel matrix, leading to mixing being more difficult. Using the stand mixer will help ensure that the NaOH is well mixed into the hydrogel matrix. During the loading of each bacterial suspension, air pockets can form in the needle. To avoid this issue, ensure that the needle tip is always sitting in the bacterial suspension in the centrifuge tube and not at the bottom of the tube or near the top surface. Another way to overcome this issue is to grow large volumes of cells and thus have larger volumes of the bacterial suspension for printing.
Limitations
Currently, during printing, the low viscosity of the bacterial suspension limits the geometries that can be printed and often leads to a biofilm-forming and growing on the top of the hydrogel matrix surface due to trace cells. There are a few potential methods for overcoming this limitation, including increasing the viscosity of the bacterial suspension or further optimizing the 3D printer settings. To increase the viscosity of the bacterial suspension, one could mix the bacterial suspension with another polymer - for example, alginate, which has been used prior for the 3D printing of bacteria onto flat surfaces38. The printer settings can be further optimized to enable retraction of the syringe plunger during the withdrawal of the needle from the granular hydrogel matrix, which would have the potential to stop cells from being deposited during the removal of the needle from the hydrogel matrix.
The significance of the method with respect to existing/alternative methods
The method described here allows for the printing of bacterial colonies into granular hydrogel matrices. The granular hydrogel matrices allow the study of the impact of external environmental factors (e.g., pore size, matrix deformability) on the motility and growth of bacteria. Additionally, while in this work, LB is used as the liquid growth medium to swell the hydrogel matrix, the hydrogel matrix can be swollen with other liquid growth media, including media with antibiotics. Previous methods for studying bacteria in confined environments were limited by the length of experimental time, the polymer mesh size, and surrounding hydrogel matrix stiffness37,38. Protocols already exist for making granular hydrogel matrices out of different polymers, so the potential for studying the impacts of different environmental conditions on the motility and growth of bacteria is vast. This method allows for the study of bacteria in control environments that more readily recapitulate the environments that bacteria inhabit in the real world, such as host mucus or soil. Another limitation of many other methods is the opacity of the surrounding matrix; however, this approach using optically transparent materials provides the ability to explore, e.g., optogenetic control and patterning of bacteria in 3D.
Beyond studying motility and growth, the 3D printing method described here overcomes the limitation of many other bioprinting methods that require the deposition of a bioink on a substrate and are, therefore, limited in the height of the engineered living material they can produce. In the future, this bioprinting protocol can be further expanded to fabricate biohybrid materials by mixing polymers with biofilm-forming cells. The granular hydrogel matrices provide support for 3D printing thicker, larger-scale engineered living materials and more complex geometries than many other current bacteria bioprinting methods. While this work only used V. cholerae and E. coli, other species, such as Pseudomonas aeruginosa, have also successfully been 3D printed37. Beyond printing, the printer can be adapted to do a controlled sampling of bacteria after growth to see if there have been any genetic changes, for example.
Disclosures
The experimental platform used to 3D print and image bacterial communities in this publication is the subject of a patent application filed by Princeton University on behalf of Tapomoy Bhattacharjee and S.S.D. (PCT Application number PCT/US/2020/030213).
Acknowledgements
R.K.B. acknowledges support from the Presidential Postdoctoral Research Fellows Program. This material is also based upon work supported by NSF Graduate Research Fellowship Program Grant DGE-2039656 (to A.M.H.). A.S.D.-M. and H.N.L. acknowledge support from the Lidow Independent Work/Senior Thesis Fund at Princeton University. We also thank the laboratory of Bonnie Bassler for providing strains of V. cholerae. S.S.D. acknowledges support from NSF Grants CBET-1941716, DMR-2011750, and EF-2124863, as well as the Eric and Wendy Schmidt Transformative Technology Fund, the New Jersey Health Foundation, the Pew Biomedical Scholars Program, and the Camille Dreyfus Teacher-Scholar Program.
Materials
| Name | Company | Catalog Number | Comments |
| 1 mL cuvettes | VWR | 97000-586 | |
| 1 mL Luer lock syringe | BH Supplies | BH1LL | |
| 10 M NaOH | Sigma-Aldrich | 72068 | |
| 100 nm carboxylated fluorescent polystyrene nanoparticles (FluoSpheres) | Invitrogen, (ThermoFischer Scientific) | F8803 | |
| 15 mL centrifuge tubes | ThermoFischer Scientific | 14-955-237 | |
| 20 G blunt needle | McMaster Carr | 75165A252 | |
| 25 mL tissue culture flasks | VWR | 10861-566 | |
| 3D printer | Lulzbot | LulzBot Mini 2 | |
| 3D printing software | Cura | Cura-Lulzbot | |
| 50 mL centrifuge tubes | ThermoFischer Scientific | 14-955-239 | |
| Agar | Sigma-Aldrich | A1296 | |
| Carbomer Granular Hydrogel Particles | Lubrizol | Carbopol 980NF | dry granules of crosslinked acrylic acid/alkyl acrylate copolymers |
| Centrifuge (2 mL tube capacity) | VWR | 2405-37 | |
| Centrifuge (50 mL tube capacity) | ThermoFischer Scientific | 75007200 | Sorvall (brand) ST 8 (model) |
| Confocal Microscope | Nikon | A1R+ inverted laserscanning confocal microscope | |
| Glass bottom petri dish | Cellvis | D35-10-1-N | |
| Lennox LB (Lubria Broth) | Sigma-Aldrich | L3022 | |
| M8 × 1.25 mm, 150 mm long, Fully Threaded Socket Cap | McMaster Carr | 91290A478 | |
| M8 × 1.25 mm, Brass Thin Hex Nut | McMaster Carr | 93187A300 | |
| Open-source syringe pump | Custom-made | Replistruder 4 | https://www.sciencedirect.com/science/article/pii/S2468067220300791 |
| Petri dish (60 mm round) | ThermoFischer Scientific | FB0875713A | |
| Shear Rheometer | Anton Paar | MCR 501 | |
| Ultrasonic cleaner | VWR | 97043-992 |
References
- Persat, A., et al. The mechanical world of bacteria. Cell. 161 (5), 988-997 (2015).
- Stoodley, P., Dodds, I., Beer, D. D., Scott, H. L., Boyle, J. D. Flowing biofilms as a transport mechanism for biomass through porous media under laminar and turbulent conditions in a laboratory reactor system. Biofouling. 21 (3-4), 161-168 (2005).
- Ludemann, H., Arth, I., Liesack, W. Spatial changes in the bacterial community structure along a vertical oxygen gradient in flooded paddy soil cores. Applied and Environmental Microbiology. 66 (2), 754-762 (2000).
- Sicard, J. F., Bihan, G. L., Vogeleer, P., Jacques, M., Harel, J. Interactions of intestinal bacteria with components of the intestinal mucus. Frontiers in Cellular and Infection Microbiology. 7, 387 (2017).
- Grice, E. A., Segre, J. A. The skin microbiome. Nature Reviews Microbiology. 9 (4), 244-253 (2011).
- Balzan, S., Quadros, C. D. A., Cleva, R. D., Zilberstein, B., Cecconello, I. Bacterial translocation: Overview of mechanisms and clinical impact. Journal of Gastroenterology and Hepatology. 22 (4), 464-471 (2007).
- Chaban, B., Hughes, H. V., Beeby, M. The flagellum in bacterial pathogens: For motility and a whole lot more. Seminars in Cell & Developmental Biology. 46, 91-103 (2015).
- Datta, S. S., Steinberg, A. P., Ismagilov, R. F. Polymers in the gut compress the colonic mucus hydrogel. Proceedings of the National Academy of Sciences. 113 (26), 7041-7046 (2016).
- Harman, M. W., et al. The heterogeneous motility of the Lyme disease spirochete in gelatin mimics dissemination through tissue. Proceedings of the National Academy of Sciences. 109 (8), 3059-3064 (2012).
- Ribet, D., Cossart, P. How bacterial pathogens colonize their hosts and invade deeper tissues. Microbes and Infection. 17 (3), 173-183 (2015).
- Siitonen, A., Nurminen, M. Bacterial motility is a colonization factor in experimental urinary tract infection. Infection and Immunity. 60 (9), 3918-3920 (1992).
- Lux, R., Miller, J. N., Park, N. H., Shi, W. Motility and chemotaxis in tissue penetration of oral epithelial cell layers by Treponema denticola. Infection and Immunity. 69 (10), 6276-6283 (2001).
- O’Neil, H. S., Marquis, H. Listeria monocytogenes flagella are used for motility, not as adhesins, to increase host cell invasion. Infection and Immunity. 74 (12), 6675-6681 (2006).
- Gill, C. O., Penney, N. Penetration of bacteria into meat. Applied and Environmental Microbiology. 33 (6), 1284-1286 (1977).
- Shirai, H., Datta, A. K., Oshita, S. Penetration of aerobic bacteria into meat: A mechanistic understanding. Journal of Food Engineering. 196, 193-207 (2017).
- Thornlow, D. N., Brackett, E. L., Gigas, J. M., Dessel, N. V., Forbes, N. S. Persistent enhancement of bacterial motility increases tumor penetration: Motility enhances bacterial tumor penetration. Biotechnology and Bioengineering. 112 (11), 2397-2405 (2015).
- Toley, B. J., Forbes, N. S. Motility is critical for effective distribution and accumulation of bacteria in tumor tissue. Integrative Biology. 4 (2), 165-176 (2011).
- Dechesne, A., Wang, G., Gülez, G., Or, D., Smets, B. F. Hydration-controlled bacterial motility and dispersal on surfaces. Proceedings of the National Academy of Sciences. 107 (32), 14369-14372 (2010).
- de Souza, R., Ambrosini, A., Passaglia, L. M. P. Plant growth-promoting bacteria as inoculants in agricultural soils. Genetics and Molecular Biology. 38 (4), 401-419 (2015).
- Turnbull, G. A., Morgan, J. A. W., Whipps, J. M., Saunders, J. R. The role of bacterial motility in the survival and spread of Pseudomonas fluorescens in soil and in the attachment and colonisation of wheat roots. FEMS Microbiology Ecology. 36 (1), 21-31 (2001).
- Watt, M., Kirkegaard, J. A., Passioura, J. B. Rhizosphere biology and crop productivity—a review. Soil Research. 44 (4), 299-317 (2006).
- Adadevoh, J. S. T., Ramsburg, C. A., Ford, R. M. Chemotaxis Increases the Retention of Bacteria in Porous Media with Residual NAPL Entrapment. Environmental Science & Technology. 52 (13), 7289-7295 (2018).
- Adadevoh, J. S. T., Triolo, S., Ramsburg, C. A., Ford, R. M. Chemotaxis Increases the Residence Time of Bacteria in Granular Media Containing Distributed Contaminant Sources. Environmental Science & Technology. 50 (1), 181-187 (2016).
- Ford, R. M., Harvey, R. W. Role of chemotaxis in the transport of bacteria through saturated porous media. Advances in Water Resources. 30 (6-7), 1608-1617 (2007).
- Wang, M., Ford, R. M., Harvey, R. W. Coupled effect of chemotaxis and growth on microbial distributions in organic-amended aquifer sediments: Observations from laboratory and field studies. Environmental Science & Technology. 42 (10), 3556-3562 (2008).
- Amchin, D. B., Ott, J. A., Bhattacharjee, T., Datta, S. S. Influence of confinement on the spreading of bacterial populations. PLoS Computational Biology. 18 (5), e1010063 (2022).
- Moore-Ott, J. A., Chiu, S., Amchin, D. B., Bhattacharjee, T., Datta, S. S. A biophysical threshold for biofilm formation. eLife. 11, e76380 (2022).
- Tittsler, R. P., Sandholzer, L. A. The use of semi-solid agar for the detection of bacterial motility. Journal of Bacteriology. 31 (6), 575-580 (1936).
- Bhattacharjee, T., et al. Polyelectrolyte scaling laws for microgel yielding near jamming. Soft Matter. 14 (9), 1559-1570 (2018).
- Bhattacharjee, T., Datta, S. S. Confinement and activity regulate bacterial motion in porous media. Soft Matter. 15 (48), 9920-9930 (2019).
- Bhattacharjee, T., Datta, S. S. Bacterial hopping and trapping in porous media. Nature Communications. 10 (1), 2075 (2019).
- Bhattacharjee, T., Amchin, D. B., Ott, J. A., Kratz, F., Datta, S. S. Chemotactic migration of bacteria in porous media. Biophysical Journal. 120 (16), 3483-3497 (2021).
- Bhattacharjee, T., Amchin, D. B., Alert, R., Ott, J. A., Datta, S. S. Chemotactic smoothing of collective migration. eLife. 11, e71226 (2022).
- Tashman, J. W., Shiwarski, D. J., Feinberg, A. W. A high performance open-source syringe extruder optimized for extrusion and retraction during FRESH 3D bioprinting. HardwareX. 9, e00170 (2021).
- Crocker, J. C., Grier, D. G. Methods of digital video microscopy for colloidal studies. Journal of Colloid and Interface Science. 179 (1), 298-310 (1996).
- Chatterjee, T., Chatterjee, B. K., Chakrabarti, P. Modelling of growth kinetics of Vibrio cholerae in presence of gold nanoparticles: Effect of size and morphology. Scientific Reports. 7 (1), 9671 (2017).
- Martínez-Calvo, A., et al. Morphological instability and roughening of growing 3D bacterial colonies. Proceedings of the National Academy of Sciences. 119 (43), e2208019119 (2022).
- Lehner, B. A. E., Schmieden, D. T., Meyer, A. S. A Straightforward approach for 3D bacterial printing. ACS Synthetic Biology. 6 (7), 1124-1130 (2017).
- Zhang, Q., et al. Morphogenesis and cell ordering in confined bacterial biofilms. Proceedings of the National Academy of Sciences. 118 (31), e2107107118 (2021).
Reprints and Permissions
Request permission to reuse the text or figures of this JoVE article
Request PermissionThis article has been published
Video Coming Soon
Copyright © 2025 MyJoVE Corporation. All rights reserved