자외선 눈에 보이는 (UV-Vis) 분광법
Overview
출처: 박사의 실험실.B 질 벤턴 - 버지니아 대학
자외선가 시동(UV-Vis) 분광법은 매우 다재다능하고 거의 모든 분자를 검출할 수 있기 때문에 가장 인기 있는 분석 기술 중 하나입니다. UV-Vis 분광법을 사용하면 UV-Vis 광이 샘플을 통과하고 샘플에 의한 빛의 투과를 측정합니다. 송신(T)에서 흡광도는 A=로그(T)로 계산할 수 있다. 흡광도 스펙트럼은 상이한 파장에서 화합물의 흡광도를 나타낸다. 모든 파장에서의 흡광도의 양은 분자의 화학 적 구조에 기인한다.
UV-Vis는 질적 방식으로 사용될 수 있으며, 기능성 군을 식별하거나 흡광도 스펙트럼을 일치시킴으로써 화합물의 정체성을 확인할 수 있다. 또한 분석물의 농도가 맥주법을 사용하여 흡수와 관련이 있기 때문에 정량적 방식으로 사용될 수 있습니다. UV-Vis 분광법은 샘플, 물 분석 및 많은 유형의 크로마토그래피에 대한 검출기로 DNA 또는 단백질의 양을 정량화하는 데 사용됩니다. 화학 반응의 운동학은 또한 시간이 지남에 따라 반복UV-Vis 측정을 취하여 UV-Vis 분광법으로 측정됩니다. UV-Vis 측정은 일반적으로 분광계로 촬영됩니다. UV-Vis는 또한 많은 화합물을 검출할 수 있기 때문에 크로마토그래피와 같은 다른 분석 기술에 매우 인기 있는 검출기입니다.
일반적으로 UV-Vis는 가장 민감한 분광법이 아니며, 많은 빛이 짧은 경로 길이에 흡수되지 않기 때문입니다. 형광과 같은 그밖 분광법은 더 높은 감도가 있습니다, 그러나 대부분의 분자가 형광이 아니기 때문에 일반적으로 적용되지 않습니다. UV-Vis는 적외선 분광법과 같은 다른 흡광도 측정에 유사한 민감성을 가집니다.
Principles
UV-Vis는 대부분의 분자가 UV-Vis 파장 범위에서 흡수하기 때문에 종종 일반적인 기술이라고 합니다. UV는 100-400 nm에서 확장되며 400-700 nm에서 가시 스펙트럼을 확장합니다. 100-200 nm 범위는 깊은 UV라고합니다. 광원은 이 범위에 대해 찾기가 더 어렵기 때문에 UV-Vis 측정에는 일상적으로 사용되지 않습니다. 일반적인 UV-Vis 분광기는 170-375nm의 빛을 생산하는 UV용 중수소 램프와 350-2,500nm의 빛을 생성하는 눈에 보이는 텅스텐 필라멘트 램프를 사용합니다.
광자 분자에 부딪히고 흡수되면 분자는 더 흥분된 활기찬 상태로 승진됩니다. 자외선은 전자를 더 높은 전자 상태로 촉진하는 충분한 에너지를 가지고 있으며, 가장 높은 점유 분자 궤도(HOMO)에서 가장 낮은 비어 있는 분자 궤도(LUMO)에 이르기까지. 호모와 LUMO의 에너지 차이를 밴드 갭이라고 합니다. 일반적으로 이러한 궤도는 결합 및 결합 방지라고 합니다. 광자의 에너지는 광자 흡수를 위한 밴드 간격과 정확히 일치해야 합니다. 따라서, 다른 화학 구조를 가진 분자는 다른 에너지 밴드 간격 및 다른 흡수 스펙트럼을 갖는다. UV-Vis 범위에 속하는 가장 일반적인 전환은 π-π*와 n-π*입니다. 파이 궤도는 이중 결합으로 인해 발생하고, n 궤도는 비 결합 전자입니다. 파이 스타는 안티 본드 파이 궤도입니다. 따라서, 최고의 UV-Vis 흡수는 이중 결합을 포함하는 분자에 의한 것입니다. 접합이라고 불리는 서로 인접한 Pi 궤도는 일반적으로 흡수를 증가시킵니다. 단일 채권과 관련된 시그마-σ* 전환은 에너지가 높고 깊은 UV에 떨어지므로 일상적인 사용에 덜 유용합니다. UV-Vis 구조에 넓은 밴드 또는 어깨의 모양은 약간 다른 에너지의 별도의 에너지 밴드 간격으로 이어지는 분자의 수많은 진동 및 회전 상태 때문입니다.
가시 적인 지역에서 흡수 하는 분자에 대 한, 화합물은 종종 색깔 표시 됩니다. 그러나, 일반적인 오해는 화합물에 대한 피크 흡수(λmax)의파장이 나타나는 색이라는 것이다. 빨간색으로 나타나는 화합물은 스펙트럼의 적색 영역에서 많은 흡수를 하지 않습니다. 대신, 빨간색으로 보이는 화합물의 λ최대값은 녹색입니다. 화합물의 색상은 빛의 파장이 시료를 통해 선택적으로 전달되기 때문에 발생하므로 흡수되지 않습니다. 컬러 휠은 관찰된 색상에서 휠을 가로질러 직접 색상이 가장 흡수되는 색상이기 때문에 화합물이 흡수할 색상과 λmax의 범위를 결정하는 데 도움이 됩니다.
흡수는 맥주의 법칙, a=θbC를 따르며, ε 어금니 감쇠 계수이고, b는 경로 길이이고, C는 농도입니다. 어금니 감쇠 계수는 주어진 파장에서 흡수하는 개별 화합물의 특성이며, 이 성질은 기능성 군, 컨쥬게이션 등에 기인한다. 화합물이 높은 감쇠 계수를가지고 있지 않은 경우, 흡광도를 높이기 위해 적절한 그룹으로 태그될 수 있습니다. 경로 길이는 일반적으로 큐벳의 크기와 관련이 있으며 표준 분광계에서 1cm입니다.
UV-Vis는 전통적인 분광계에서 부터 현대판 판독기까지 다양한 계측기에서 수행됩니다. 흡광도 파장을 필터 또는 모노크로마토르를 사용하여 선택해야 합니다. 단색로마토르는 빛의 파장을 공간적으로 분리한 다음 원하는 빛의 파장이 있는 출구 슬릿을 배치하는 장치입니다. 단색광제는 전체 흡광도 스펙트럼을 제공하기 위해 스캔할 수 있습니다. 또는 다이오드 어레이 계측기는 모든 색상의 빛이 시료를 통해 전달될 수 있게 하고, 빛은 공간적으로 서로 다른 파장으로 분리되고 포토다이오드를 사용하여 감지됩니다. 다이오드 어레이 계측기는 전체 스펙트럼을 더 빠르게 수집하지만 더 복잡하고 더 비쌉습니다.
Procedure
1. 분광계 교정
- UV-Vis 분광기를 켜고 램프가 적절한 기간(약 20분)동안 예열하여 안정화되도록 합니다.
- 큐벳을 샘플용 용매로 채우고 외부가 깨끗한지 확인합니다. 이것은 빈 역할을하고 용매에 의한 산란 또는 흡수로 인한 가벼운 손실을 설명하는 데 도움이됩니다.
- 큐벳을 분광계에 놓습니다. 큐벳은 핸들링(홈일 수 있음)을 위한 양면을 가지고 있으며 빛을 비추기 위한 것이 아니기 때문에 큐벳을 올바르게 정렬해야 합니다.
- 빈 공간을 읽으십시오. 흡수도는 최소화해야 하지만, 흡수도는 향후 샘플에서 빼야 합니다. 일부 계측기는 빈 데이터를 저장하고 빼기 작업을 자동으로 수행할 수 있습니다.
2. 흡광스펙트럼 수행
- 큐벳을 샘플로 채웁니다. 전송이 정량적인지 확인하려면 큐벳을 샘플로 두 번 헹구고 약 3/4 전체를 채웁니다. 외부가 지문 등을 깨끗하게 하고 있는지 확인하십시오.
- 큐벳을 분광기에 올바른 방향으로 배치합니다.
- 큐벳을 덮어 주변 광을 방지합니다.
- 악기가 다른 파장을 통해 스캔하고 흡수도를 수집 할 수 있도록하여 흡수 스펙트럼을 수집합니다. 파장 범위는 특정 샘플에 대한 정보로 설정할 수 있지만 200-800 nm의 범위는 표준입니다. 다이오드 어레이 계측기는 한 번의 실행으로 전체 흡광도 스펙트럼을 수집할 수 있습니다.
- 수집된 흡수 스펙트럼으로부터, 흡수도 최대(λmax)를결정한다. 스펙트럼의 컬렉션을 반복하여 λ 최대값에서 오차 추정치를얻습니다.
- 교정 곡선을 만들려면 다양한 농도 샘플의 UV-Vis 스펙트럼을 수집합니다. 분광계는 종종 선형 범위에서 제한되며 1.5보다 큰 흡광도 값을 측정할 수 없습니다. 샘플의 흡광도 값이 계측기의 선형 범위 외부에 있는 경우 샘플을 희석하여 선형 범위 내에서 값을 가져옵니다.
3. UV-비스 분광기와 운동 실험
- UV-Vis는 시간이 지남에 따라 흡광도의 변화를 검사하여 운동 실험에 사용할 수 있습니다. 운동 학 실험의 경우 샘플을 초기 읽기로 하십시오.
- 시약을 빠르게 추가하여 화학 반응을 시작합니다.
- 잘 저어서 샘플과 섞습니다. 소량이 추가되면 큐벳에서 이 작업을 수행할 수 있습니다. 또는 시약을 시료와 혼합하여 큐벳에 빠르게 붓습니다.
- 시간이 지남에 따라 관심 있는 단량에 대 한 λ최대에서 흡광도측정. 측정 중인 시약을 사용하는경우(즉, 흡수시약이 적기 때문에 흡수성이 올라가고 있음), 부패는 반응의 순서를 나타냅니다.
- 교정 곡선을 사용하여, 흡수성 값을 농도로 변환, 시간 대 Aalyte 농도의 플롯을 합니다. 거기에서,이 그래프는 반응 속도 상수를 결정하기 위해 적절한 방정식에 맞을 수 있습니다.
Results
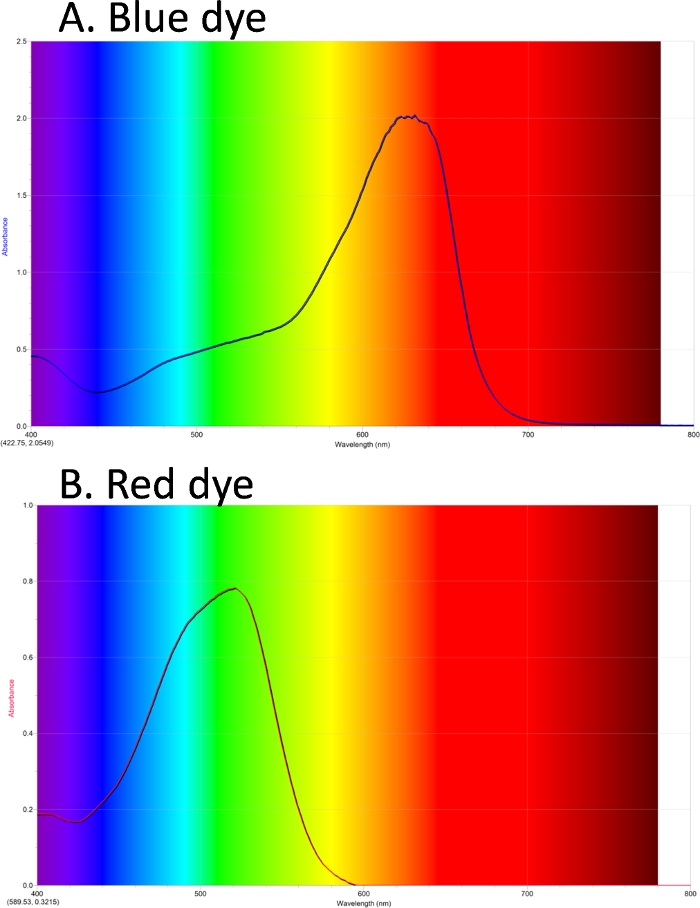
UV-Vis는 유색 화합물의 스펙트럼을 얻기 위해 사용될 수있다. 도 1A에서,청색 염료의 흡광스펙트럼이 도시된다. 배경은 가시 스펙트럼의 빛의 색상을 보여줍니다. 파란색 염료는 주황색/빨간색의 λ최대 흡광도를 가지고 있습니다. 도 1B는 녹색에 λ최대가 있는 적색 염료의 스펙트럼을 나타낸다.
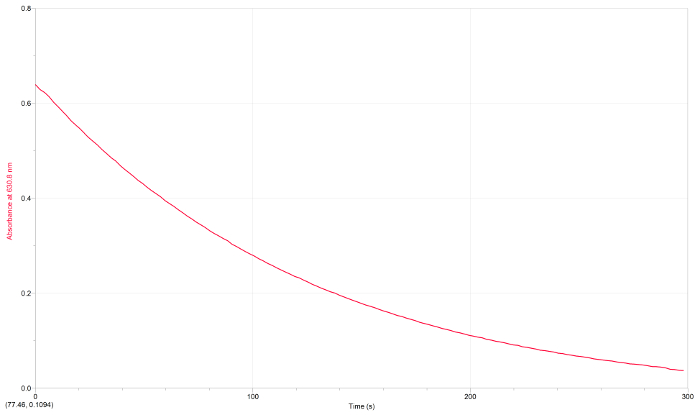
운동학은 시간이 지남에 따라 한 파장에서 흡광도의 플롯에서 측정 될 수있다. 도 2는 표백제와 반응할 때 파란색 염료(630 nm)의 흡광도 플롯을 나타낸다.

그림 1. UV-비스 흡광도 스펙트럼. A. 파란색 염료 #1 주황색/빨간색의 최대 흡광도를 가합니다. B. 붉은 염료 #40 녹색에 최대 흡광도가 있습니다. 이 그림의 더 큰 버전을 보려면 여기를 클릭하십시오.

그림 2. 운동용 UV-Vis. 표백제와 반응할 때 파란색 염료의 흡수성이 #1. 곡선은 지수 붕괴와 맞을 수 있으며, 이는 첫 번째 순서 역학을 나타냅니다. 이 그림의 더 큰 버전을 보려면 여기를 클릭하십시오.
Application and Summary
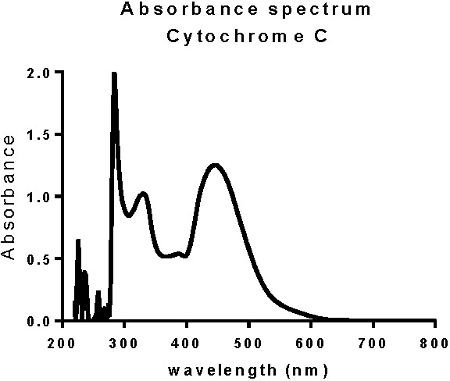
UV-Vis는 많은 화학 적 분석에 사용됩니다. 대부분의 단백질이 280 nm에서 강하게 흡수되기 때문에 용액에서 단백질의 양을 양량화하는 데 사용됩니다. 도 3은 혈중으로 인해 280과 450에서 높은 흡광도를 가지는 사이토크롬 C의 예를 나타낸다. UV-Vis는 또한 모든 염기가 260 nm에서 강하게 흡수되기 때문에 샘플에서 DNA의 양을 정량화하는 표준 기술로 사용됩니다. RNA와 단백질은 또한 260 nm에서 흡수되기 때문에 다른 파장의 흡광도는 간섭을 확인하기 위해 측정할 수 있습니다. 특히, 단백질은 280 nm에서 강하게 흡수되므로 280/260의 흡광도 비율은 샘플에서 DNA에 대한 단백질 의 비율을 측정할 수 있습니다.
대부분의 간단한 분석은 한 번에 하나의 파장을 측정합니다. 그러나, 측정이 동시에 많은 파장에서 이루어지는 경우에 더 많은 화학 정보가 존재합니다. 다이오드 어레이 계측기는 전송되는 모든 빛을 캡처하고, 프리즘 또는 홀로그램 격자를 사용하여 빛을 다른 색상으로 분할한 다음, 다른 파장에서 흡수성이 선형 광다이오드 배열에 포착됩니다. 이 방법의 장점은 많은 다른 분자를 동시에 측정하는 데 유용하다는 것입니다.

그림 3. 단백질의 UV-Vis 스펙트럼. 280 nm의 피크는 단백질을 나타냅니다. 450에서 피크는 사이토크롬 C에서 헴 그룹의 흡수성 때문입니다.
Tags
건너뛰기...
이 컬렉션의 비디오:

Now Playing
자외선 눈에 보이는 (UV-Vis) 분광법
Analytical Chemistry
623.5K Views

분석 특성화를 위한 샘플 준비
Analytical Chemistry
84.7K Views

내부 표준
Analytical Chemistry
204.8K Views

표준 추가 방법
Analytical Chemistry
320.1K Views

교정 곡선
Analytical Chemistry
796.8K Views

화학 분석을 위한 라만 분광법
Analytical Chemistry
51.2K Views

엑스레이 형광 (XRF)
Analytical Chemistry
25.4K Views

화염 이온화 감지를 갖춘 가스 크로마토그래피(GC)
Analytical Chemistry
282.0K Views

고성능 액체 크로마토그래피 (HPLC)
Analytical Chemistry
384.5K Views

이온 교환 크로마토그래피
Analytical Chemistry
264.5K Views

모세관 전기 포레시스 (CE)
Analytical Chemistry
93.9K Views

질량 분광법 소개
Analytical Chemistry
112.2K Views

스캐닝 전자 현미경 검사법 (SEM)
Analytical Chemistry
87.2K Views

전위요스타트/갈바노스타트를 사용하여 지원되는 촉매의 전기화학적 측정
Analytical Chemistry
51.4K Views

순환 볼탐량 (CV)
Analytical Chemistry
125.2K Views
Copyright © 2025 MyJoVE Corporation. 판권 소유