Aby wyświetlić tę treść, wymagana jest subskrypcja JoVE. Zaloguj się lub rozpocznij bezpłatny okres próbny.
Method Article
Measuring Left Ventricular Pressure in Late Embryonic and Neonatal Mice
W tym Artykule
Podsumowanie
Measuring left ventricular pressure (LV) in embryonic and neonatal mice is described. Pressure is measured by inserting a needle connected to a fluid-filled transducer into the LV under ultrasound guidance. Care must be taken to maintain normal cardiac function during the experimental protocol.
Streszczenie
Blood pressure increases significantly during embryonic and postnatal development in vertebrate animals. In the mouse, blood flow is first detectable around embryonic day (E) 8.51. Systolic left ventricular (LV) pressure is 2 mmHg at E9.5 and 11 mmHg at E14.52. At these mid-embryonic stages, the LV is clearly visible through the chest wall for invasive pressure measurements because the ribs and skin are not fully developed. Between E14.5 and birth (approximately E21) imaging methods must be used to view the LV. After birth, mean arterial pressure increases from 30 - 70 mmHg from postnatal day (P) 2 - 353. Beyond P20, arterial pressure can be measured with solid-state catheters (i.e. Millar or Scisense). Before P20, these catheters are too big for developing mouse arteries and arterial pressure must be measured with custom pulled plastic catheters attached to fluid-filled pressure transducers3 or glass micropipettes attached to servo null pressure transducers4.
Our recent work has shown that the greatest increase in blood pressure occurs during the late embryonic to early postnatal period in mice5-7. This large increase in blood pressure may influence smooth muscle cell (SMC) phenotype in developing arteries and trigger important mechanotransduction events. In human disease, where the mechanical properties of developing arteries are compromised by defects in extracellular matrix proteins (i.e. Marfan's Syndrome8 and Supravalvular Aortic Stenosis9) the rapid changes in blood pressure during this period may contribute to disease phenotype and severity through alterations in mechanotransduction signals. Therefore, it is important to be able to measure blood pressure changes during late embryonic and neonatal periods in mouse models of human disease.
We describe a method for measuring LV pressure in late embryonic (E18) and early postnatal (P1 - 20) mice. A needle attached to a fluid-filled pressure transducer is inserted into the LV under ultrasound guidance. Care is taken to maintain normal cardiac function during the experimental protocol, especially for the embryonic mice. Representative data are presented and limitations of the protocol are discussed.
Protokół
1. Ultrasound and pressure system
- Start the ultrasound system according to the manufacturers instructions (Vevo 770, Visualsonics). Fill the appropriate probe (age E18 - P7 = model 708, age > P7 = model 707B) with distilled water and connect to the ultrasound system. Place the probe in the adjustable stand at the approximate orientation necessary to obtain an LV long-axis view for a mouse mounted on the imaging platform so that the LV apex is pointed toward the injection arm.
- The pressure system consists of a fluid-filled pressure transducer, bridge amplifier, data acquisition system and data recording software (LabChart). The connections consist of three-way stopcocks, tubing, luer locks and hose barbs. A 20 mL syringe is filled with 10% heparinized saline for flushing at one end. The other end connects to a needle and a 3 mL syringe body is modified for use as a casing to hold the needle tubing in the injection arm (Figure 1).
- Calibrate the pressure transducer system with a manometer.
- Mount the needle tubing and casing in the injection arm of the ultrasound system. Clamp the pressure transducer in a ring stand at the approximate height of the imaging platform. Attach a needle appropriate for the age of the mouse (age E18 - P3 = 30G, age > P3 = 25G) to the needle tubing. Smaller needles get clogged easier, are more difficult to advance through the chest wall, and have a slower response time. Hence, the largest needle size that fits in the LV lumen is used for each age.
- Place a mound of ultrasound gel on the imaging platform and carefully line up the probe using the adjustable stand so that the needle can be advanced directly into the gel under the center of the imaging probe (Figure 2). The needle must be far enough below the probe to not puncture the probe cover, but close enough to be within the probe focal depth. If necessary, the needle may be bent by hand so that it remains in the correct plane throughout its travel.
- Maintaining alignment, retract the needle and raise the imaging probe to place a mouse on the imaging platform. Flush the needle to eliminate any gel that may have entered the tip.
2. Mouse preparation
- All methods shown in this protocol have been approved by the Institutional Animal Care and Use Committee. Anesthetize a timed pregnant mother (E18) or neonatal mouse (P1 - 20) by continuous inhalation of 1.5% isoflurane. Tubing can be inserted into a standard nose cone to accommodate the small head of an early neonatal mouse (P1 - 15).
- Secure the mouse to the imaging platform of the ultrasound system in a dorsal decubitus position with the LV apex pointing toward the injection arm. For pregnant mothers, apply ultrasound gel to monitor heart rate with the attached ECG detector and insert the rectal thermometer for feedback control of the body temperature. Neonatal mice are too small for these detectors, so heart rate is monitored during the pressure measurements and body temperature is maintained with an external heat lamp.
- Remove hair from the abdomen of the pregnant mother or chest of the young mouse with a depilatory cream. Neonatal mice (P1 - 10) do not require any hair removal.
- For pregnant mothers, cut open the abdomen using dissecting scissors and curved forceps. Externalize one uterine horn and place on gauze moistened with warm saline solution. Carefully manipulate an embryo into the proper position to obtain a parasternal long axis view of the LV using the ultrasound probe. Measure the pressure in all embryos on this side before externalizing the other uterine horn. Keep all embryos and the abdomen of the mother moist with periodic addition of warm saline.
3. Pressure measurement
- Place prewarmed, degassed ultrasound gel on the embryonic or neonatal mouse. Neonatal mice that have not been depilated should have a small amount of ultrasound gel rubbed onto their chest before the remaining ultrasound gel is applied to enhance coupling. Lower the imaging probe and adjust the angle of the imaging platform to obtain an optimal parasternal LV long axis view. Do not adjust the angle of the probe because the needle alignment will be lost.
- While monitoring the LV image on the ultrasound screen, slowly advance the needle until it is near the bottom of the probe. Adjust the needle and probe position, if necessary, to correct alignment shifts. Gently flush the needle with saline. Start recording pressure data and zero the pressure transducer with the LabChart software. The transducer drifts with temperature and position, so it is important to zero it just before measuring pressure in each mouse.
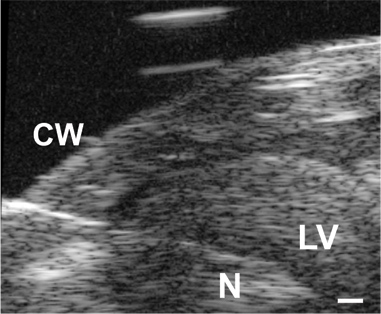
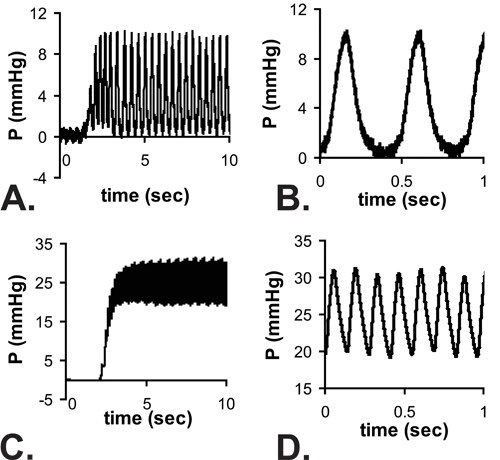
- Slowly advance the needle until it can be seen at the edge of the ultrasound image, but not yet in the LV. Adjust the needle position, if necessary, to enter the LV at the apex. Adjust the probe position, if necessary, to maintain a clear image of the needle. Advance the needle into the LV lumen (Figure 3), while recording pressure data and monitoring the needle location on the ultrasound image. The start of pulsatile recordings from the pressure transducer confirms the location inside the LV lumen (Figure 4).
- If the needle appears to be in the LV lumen, but pressure recordings are not pulsatile, flush with a light tap on the syringe plunger, just until a pressure increase is detected (about 5 - 10 μL volume). This should clear any clogs that may be preventing an accurate reading. If pressure readings are still not pulsatile, the needle may be above or below the correct plane and not be inserted into the LV lumen. Retract the needle, flush with saline, and advance again. If pulsatile readings are still not obtained, move on to the next mouse. Use a new needle for each mouse.
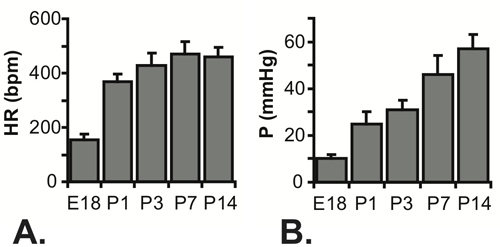
- Successful pressure readings can be obtained from 75% of the embryonic and neonatal mice attempted. Readings should take 5 - 10 minutes each and the pressure data for a mouse should not be included if the heart rates are significantly different than expected (Figure 5A). Heart rate has a significant effect on cardiovascular measures and altered heart rates are indicative of cardiac distress. Embryonic distress usually occurs 1 - 1.5 hours after first externalization of the uterus, so speed is important for measuring pressures in an entire litter.
4. Representative Results
All results shown are for C57BL6J mice. An image of the needle in the LV lumen for a P1 mouse in shown in Figure 3. The needle is necessary to puncture the chest wall and gain access to the small LV lumen, but it significantly increases the response time of the pressure system. When an approximate step increase in pressure is manually applied to the system, the time to reach 67% of the maximum pressure is .067 sec with the tubing only (most likely indicative of the real time to apply the pressure step), 0.105 sec with a 25 G needle and 0.529 sec with a 30 G needle. The delay in reaching maximum pressure can be seen in the complete tracings shown in Figure 4A and 4C. Although the response time is slower with the 30G needle, the waveform is better captured at the embryonic and early neonatal stages, because heart rate increases with age in mice5. Despite this limitation, the systolic pressure can be calculated assuming that the true LV diastolic (minimum) pressure is zero, and the systolic (maximum) LV pressure is two times the mean LV pressure determined from the readings at steady state (Figure 4B and 4D)6. It is generally assumed that the systolic LV and arterial pressures are equal. The measured heart rates and calculated LV pressures for various ages between E18 and P14 are shown in Figure 5.

Figure 1. Image of the pressure transducer with attached three-way stopcocks, male (M) and female (F) luer lock connections, hose barbs, tubing, syringes and needle.

Figure 2. Image of the set up to align the needle with the imaging probe (A). The imaging platform is rotated so that the LV apex of the mouse is facing the injection arm. The probe is mounted in the adjustable stand at the approximate orientation necessary to obtain an LV long-axis image. The needle tubing casing is mounted in the injection arm. The needle is advanced into a mound of ultrasound gel on the imaging platform to determine the proper angle and vertical and horizontal position with respect to the imaging probe (B).

Figure 3. Image of the needle (N) advanced through the chest wall (CW) and into the LV lumen in a P1 mouse. Scale bar = 0.1 mm.

Figure 4. Example pulsatile pressure readings as the needle enters the LV of an E18 (A) and P14 (C) mouse. There is a delay in reaching a steady state due to the response time of the system with the needle attached. Zoom views of the readings at steady state are shown in B and D. Note that the minimum E18 LV pressures are near zero, but the full waveform from zero to the maximum pressure cannot be recorded at the higher heart rates of P14 mice. The mean pressures are measured from the steady state readings and it is assumed that LV systolic pressure = 2 x measured mean pressure.

Figure 5. Measured heart rates (A) and calculated systolic LV pressures (B) for E18 - P14 mice. N = 7 for E18, 5 for P1, 22 for P3, 23 for P7 and 16 for P145-7.
Dyskusje
The protocol presented here provides a method for measuring LV pressure in late embryonic and early neonatal mice. The main limitation of this protocol is the temporal resolution of the pressure system. The pressure signal is damped as it travels from the LV through the needle to the transducer, and only mean pressure values can be recorded. The damping can be minimized by using the largest needle possible, but the needle must fit within the LV lumen for different aged mice. Because the diastolic pressure can be approxim...
Ujawnienia
No conflicts of interest declared.
Podziękowania
This work was funded, in part, by NIH grants HL087653 and HL105314. Some of the methods were developed in the laboratory of Dr. Robert Mecham at the Washington University School of Medicine.
Materiały
| Name | Company | Catalog Number | Comments |
| High resolution ultrasound system | VisualSonics, inc. | Vevo 770 | Or other appropriate ultrasound system |
| High frequency ultrasound probes | VisualSonics, inc. | 708 and 707B | |
| Imaging platform and injection arm | VisualSonics, inc. | Imaging Station 2 | With ECG and temperature feedback control of platform |
| Pressure transducer | ADInstruments | MLT 844 | |
| Bridge amplifier | ADInstruments | ML221 | |
| Data acquisition system | ADInstruments | ML866 | |
| Data recording software | ADInstruments | LabChart | |
| Ring stand and clamp | Various | To hold pressure transducer during measurements | |
| 3-way stopcocks with luer connections, male lock | Cole-Parmer | 30600-02 | |
| 1/16" ID Tygon Tubing | Cole-Parmer | 06408 | |
| Male and female luers w/ 1/16" hose barb | Cole-Parmer | 45510-50 45510-00 | |
| 24" tubing with male and female luer at each end | Cole-Parmer | 30600-60 | |
| 3 and 10 mL syringes | BD Biosciences | ||
| 30 and 25G needles | BD Biosciences | 1.5 inches in length | |
| Big Ben manometer | Riester | 1456-100 | |
| Saline | Various | ||
| Heparin | Various | ||
| Ultrasound gel | Parker Hannifin Corporation | Aquasonic 100 | |
| Hair remover lotion | Nair |
Odniesienia
- Ji, R. P. Onset of cardiac function during early mouse embryogenesis coincides with entry of primitive erythroblasts into the embryo proper. Circ. Res. 92 (2), 133-135 (2003).
- Ishiwata, T., Nakazawa, M., Pu, W. T., Tevosian, S. G., Izumo, S. Developmental changes in ventricular diastolic function correlate with changes in ventricular myoarchitecture in normal mouse embryos. Circ. Res. 93 (9), 857-865 (2003).
- Huang, Y., Guo, X., Kassab, G. S. Axial nonuniformity of geometric and mechanical properties of mouse aorta is increased during postnatal growth. Am. J. Physiol. Heart Circ. Physiol. 290 (2), H657-H664 (2006).
- Ishii, T., Kuwaki, T., Masuda, Y., Fukuda, Y. Postnatal development of blood pressure and baroreflex in mice. Auton. Neurosci. 94 (1-2), 34-41 (2001).
- Le, V. P., Knutsen, R. H., Mecham, R. P., Wagenseil, J. E. Decreased aortic diameter and compliance precedes blood pressure increases in postnatal development of elastin-insufficient mice. Am. J. Physiol. Heart Circ. Physiol. , (2011).
- Wagenseil, J. E. Reduced vessel elasticity alters cardiovascular structure and function in newborn mice. Circ. Res. 104 (10), 1217-1224 (2009).
- Wagenseil, J. E. The importance of elastin to aortic development in mice. Am. J. Physiol. Heart Circ. Physiol. 299 (2), H257-H264 (2010).
- Ramirez, F., Sakai, L. Y., Rifkin, D. B., Dietz, H. C. Extracellular microfibrils in development and disease. Cell. Mol. Life Sci. 64 (18), 2437-2446 (2007).
- Li, D. Y. Elastin point mutations cause an obstructive vascular disease, supravalvular aortic stenosis. Hum. Mol. Genet. 6 (7), 1021-1028 (1997).
- Roth, D. M., Swaney, J. S., Dalton, N. D., Gilpin, E. A., Ross, J. Impact of anesthesia on cardiac function during echocardiography in mice. Am. J. Physiol. Heart Circ. Physiol. 282 (6), H2134-H2140 (2002).
- Phoon, C. K. Imaging tools for the developmental biologist: ultrasound biomicroscopy of mouse embryonic development. Pediatr. Res. 60 (1), 14-21 (2006).
Przedruki i uprawnienia
Zapytaj o uprawnienia na użycie tekstu lub obrazów z tego artykułu JoVE
Zapytaj o uprawnieniaPrzeglądaj więcej artyków
This article has been published
Video Coming Soon
Copyright © 2025 MyJoVE Corporation. Wszelkie prawa zastrzeżone