
Aby wyświetlić tę treść, wymagana jest subskrypcja JoVE. Zaloguj się lub rozpocznij bezpłatny okres próbny.
Method Article
Single-Cell Optical Action Potential Measurement in Human Induced Pluripotent Stem Cell-Derived Cardiomyocytes
W tym Artykule
Podsumowanie
Here we describe optical acquisition and characterization of action potentials from induced pluripotent stem cell derived cardiomyocytes using a high-speed modular photometry system.
Streszczenie
Conventional intracellular microelectrode techniques to quantify cardiomyocyte electrophysiology are extremely complex, labor intensive, and typically carried out in low throughput. Rapid and ongoing expansion of induced pluripotent stem cell (iPSC) technology presents a new standard in cardiovascular research and alternate methods are now necessary to increase throughput of electrophysiological data at a single cell level. VF2.1Cl is a recently derived voltage sensitive dye which provides a rapid single channel, high magnitude response to fluctuations in membrane potential. It possesses kinetics superior to those of other existing voltage indicators and makes available functional data equivalent to that of traditional microelectrode techniques. Here, we demonstrate simplified, non-invasive action potential characterization in externally paced human iPSC derived cardiomyocytes using a modular and highly affordable photometry system.
Wprowadzenie
Electrophysiological modeling of cardiomyocytes and the construction of efficient platforms for cardiac drug screening is essential for the development of therapeutic strategies for a variety of arrhythmic disorders. Rapid expansion of induced pluripotent stem cell (iPSC) technology has produced promising inroads into human disease modelling and pharmacological investigation using isolated patient derived cardiomyocytes (iPSC-CM). “Gold standard” techniques for electrophysiological characterization of these cells through patch-clamp (current-clamp) can quantify action potential (AP) morphology and duration, however, this method is incredibly complex and slow, and not well suited for high throughput data acquisition1. iPSC-CMs are regularly reported to have an increased diastolic membrane potential and increased leak current when compared to adult native cardiomyocytes2. It is suggested that smaller cell size and reduced membrane capacitance observed in iPSC-CMs may produce some systematic error when using the current-clamp technique, perhaps explaining these deviations3. In order to maximize the usefulness of an iPSC-CM platform, an additional method is valuable to increase throughput and ensure data accuracy when characterizing transmembrane voltage changes at a single cell level in iPSC-CMs.
Voltage sensitive dyes (VSD) have long been a proposed method to provide faster, non-invasive and equivalent analysis of cardiac AP kinetics comparative to those of traditional techniques4. A recent study has demonstrated the suitability of ratiometric voltage sensitive probe photometry to accurately quantify the cardiac AP5. Furthermore, the ability to readily scale up optical photometry approaches lends this technique to large scale cardiotoxicity screens critical in therapeutic drug development (e.g., CiPA). Development of standardized cardiotoxicity protocols in a blinded multi-site study using microelectrode array and voltage-sensing optical techniques has demonstrated the key value of this approach6.
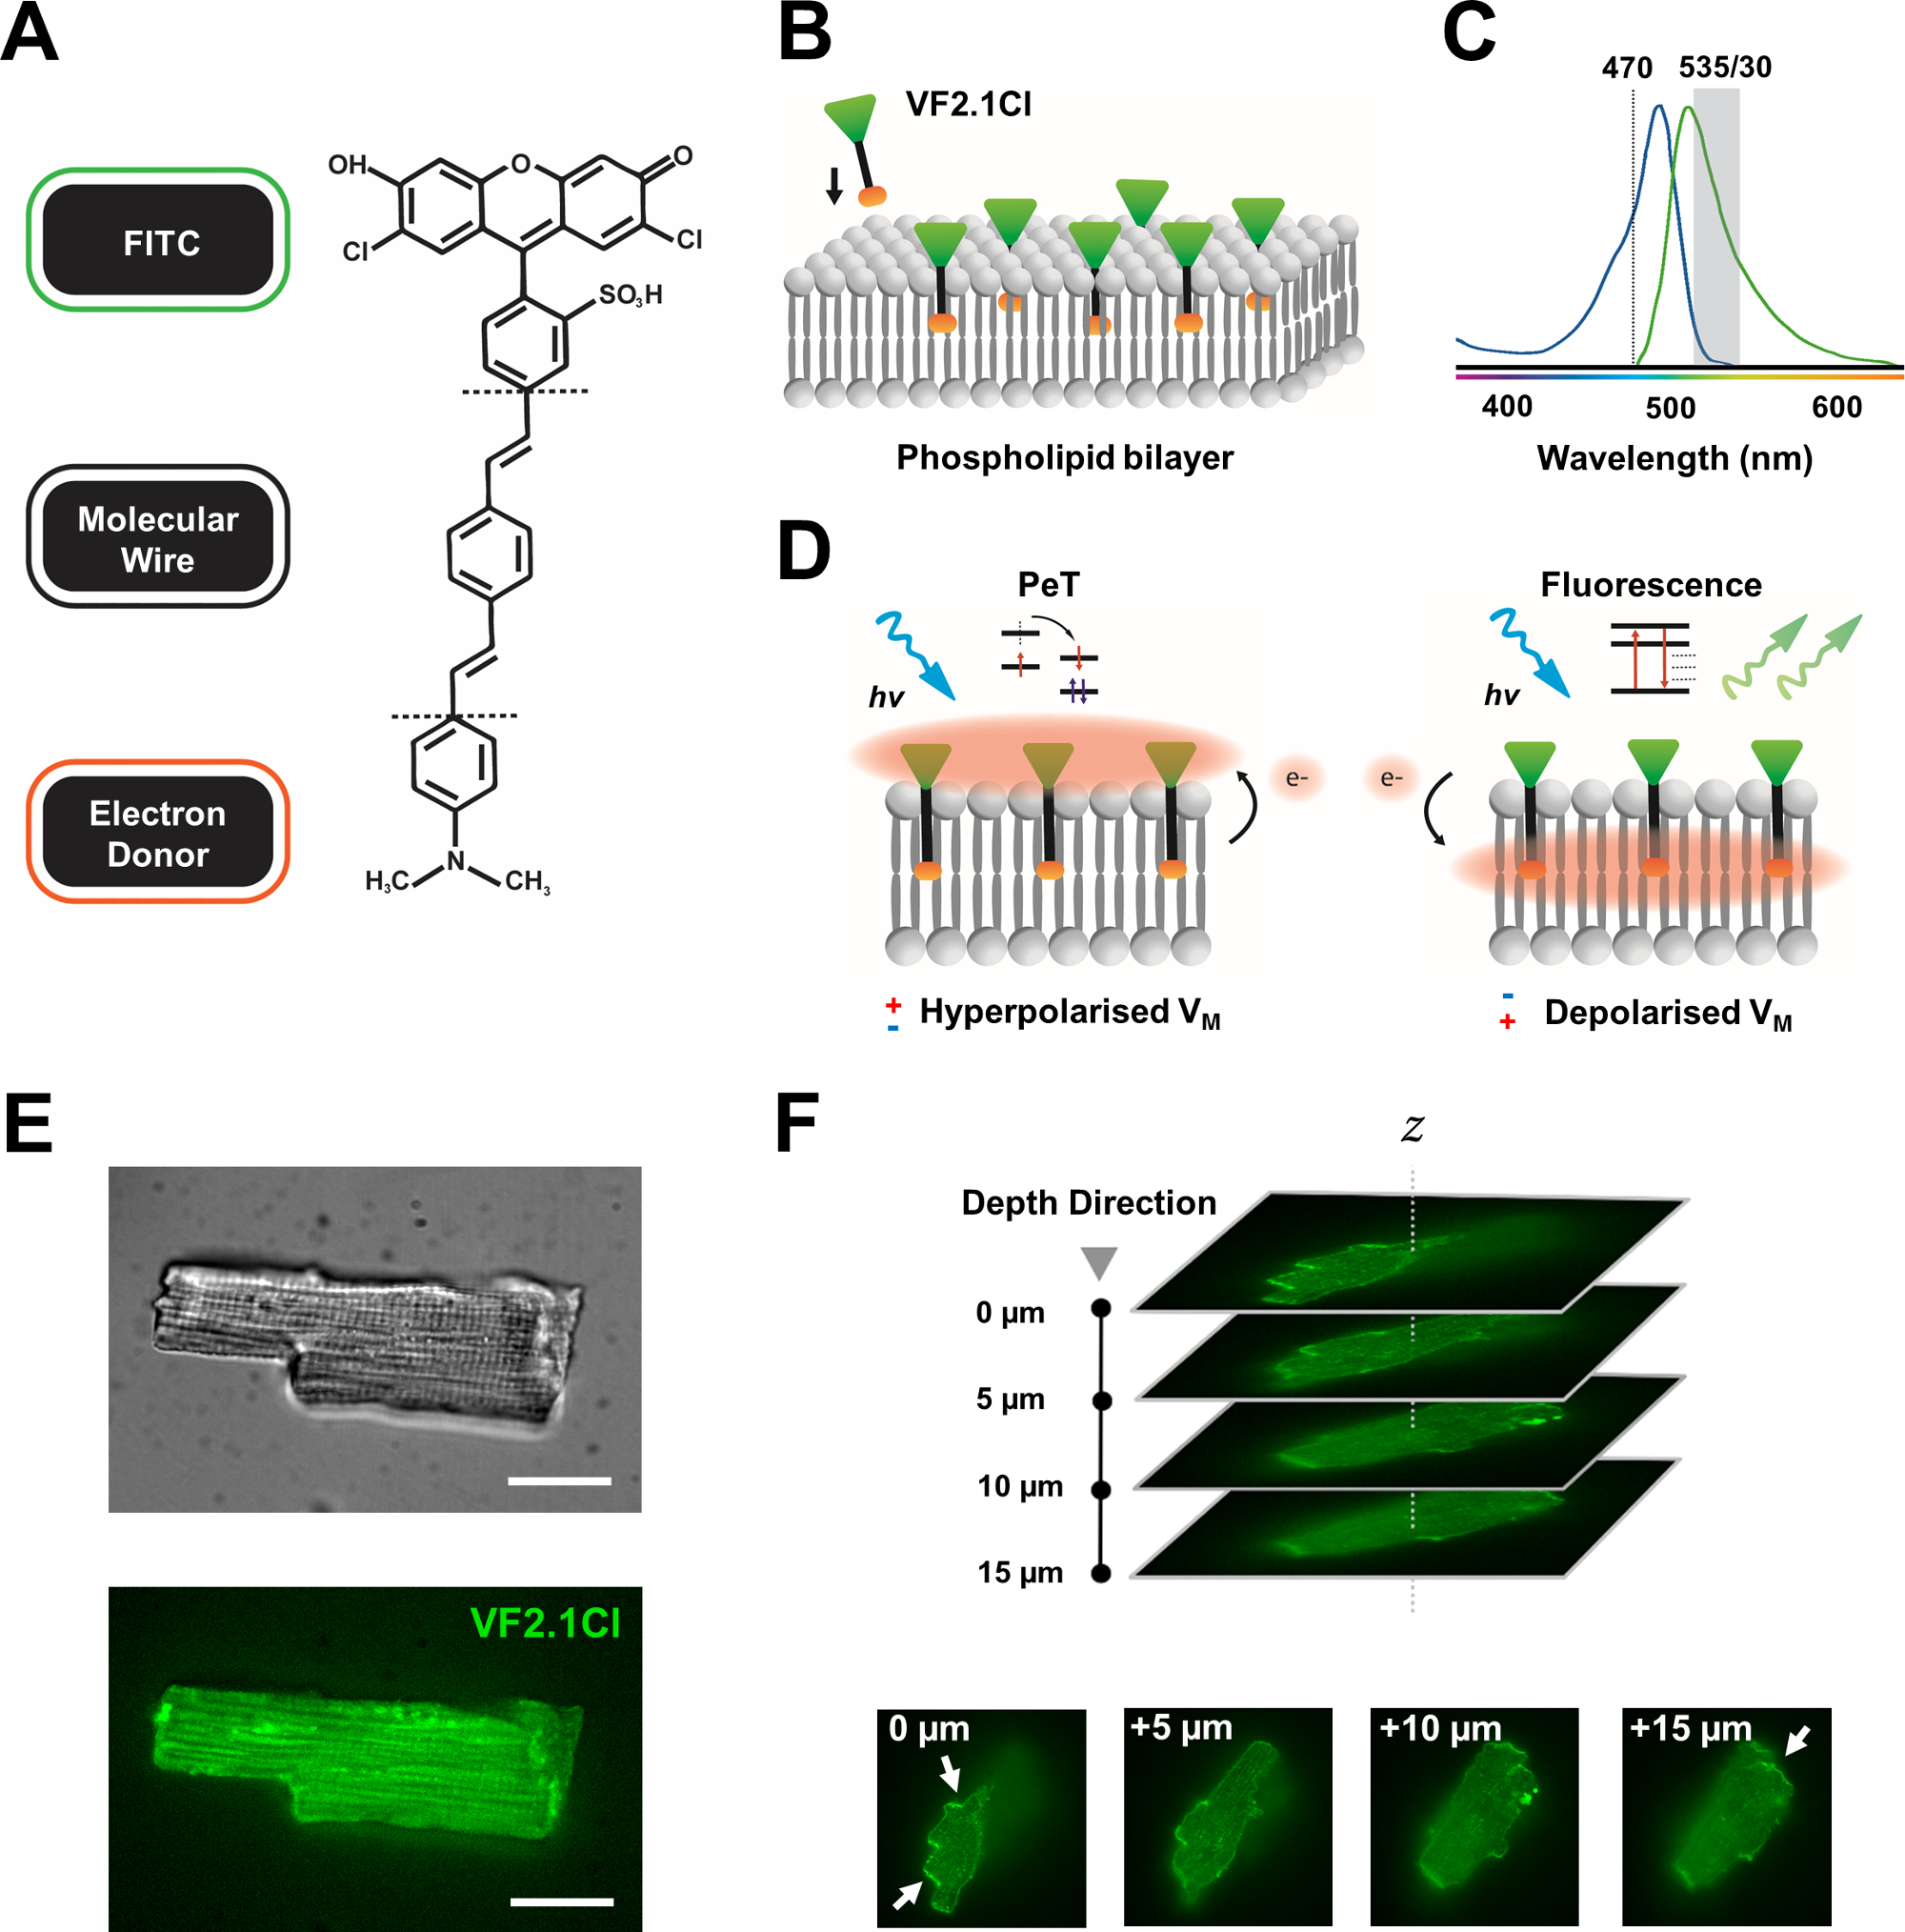
Many potentiometric dyes are commercially available, and ongoing synthetic development of new probes show exciting potential for streamlining their effectiveness across a variety of cardiac and neural constructs. The ideal VSD will have augmented kinetics and sensitivity, while displaying decreased capacitive load, photobleaching and cytotoxicity. The recently synthesized VF2.1Cl (FluoVolt) expresses many of these beneficial properties largely due to its novel wire-based molecular structure, shared by other members of the new VoltageFluor (VF) family7. In contrast to common electrochromic VSDs in which simple probes molecularly and electrically conjugate to the plasma membrane, this dye consists of a passively inserted, membrane-spanning synthetic wire which pairs an electron-rich donor with a modified fluorescein fluorophore (FITC). Mechanistic details are provided in Figure 1. This dye demonstrates excellent sensitivity to membrane voltage fluctuations, displaying a 27% change in emission intensity per 100 mV as opposed to ~10% seen in other common probes at comparable speeds7. In addition, wire-based PeT systems do not directly interact with the cellular electric field which produces minimal electrical interference and negligible changes in cellular capacitive load.

Figure 1: Chemical, spectral and mechanistic parameters of VF2.1Cl dye. (A) Chemical structure of VF2.1Cl. Molecular features to note include multiple alkyl groups within the phenylene vinylene molecular wire which facilitate insertion into the plasma membrane. A negatively charged sulfonic acid group conjugated to the FITC probe ensures fluorophore stabilization on the extracellular surface and aids near perpendicular insertion relative to the electrical field of the lipid bilayer. (B) A simplified schematic of perpendicular VF2.1Cl embedding into the plasma membrane of a target cell. (C) Absorption and emission spectra of VF2.1Cl dye. Spectra is identical to that of standard FITC and GFP probes. (D) Depiction of the mechanistic mode of action of VF2.1Cl. In resting conditions (hyperpolarized), negative intracellular voltages drive free electrons towards the rostral fluorophore. Electron abundance ensures photo-induced electron transfer (PeT) is favored as a pathway out of the excited state after the optical excitation, effectively quenching fluorescence. In contrast, a depolarized membrane potential influences downward electron movement favoring fluorescence upon optical excitation. The resulting fluorescent response is linearly related to membrane voltage and can be precisely utilized to gather detailed temporal information on cellular electrophysiological kinetics. (E) Representative brightfield (upper) and fluorescence at 470 nm (lower) images of leporine cardiomyocytes loaded with VF2.1Cl. (F) Z stack of a single loaded cardiomyocyte. Arrows indicate areas of clear localization of VF2.1Cl to the cellular membrane. Images were acquired with a spinning disk confocal system consisting of a X-lightv3 spinning disk confocal head with a 50 µm pinhole pattern; LDI-7 illuminator; Prime95B camera and a PlanApo Lambda 100x objective. Scale bar: 20 µm. Please click here to view a larger version of this figure.
The FITC probe conjugated to VF2.1Cl ensures that it can be used effectively under standard and GFP filter configurations, and it only requires a single channel acquisition system, both of which are common features of fluorescent imaging platforms. Analysis of dense human iPSC-CM monolayers with this dye has been recently reported8,9,10,11. Our protocol differs to these studies due to our investigation of single, isolated iPSC-CMs, unperturbed by the electrical and paracrine influences of dense syncytial monolayers, and our use of an affordable and customizable photometry system as opposed to complex confocal or wide-field imaging arrangements.
Here, we describe our protocol for the rapid acquisition and analysis of robust optical APs from isolated human iPSC-derived cardiomyocytes and native cardiomyocytes (see Supplementary File). We use VF2.1Cl coupled with a customizable state of the art platform for single cell photometry measurements. These experimental protocols have been approved by the ethics committee of the University Medical Center Göttingen (No. 10/9/15).
Protokół
1. Cellular preparations
NOTE: Human iPSCs used in this protocol were derived from healthy donors and differentiated in monolayers using fully defined small molecule modulation of WNT signaling and lactate purification techniques as previously described12,13,14. iPSC-CMs were maintained every 2-3 days with a culture medium outlined below.
- Prepare a culture medium of basal medium (RPMI 1640) and 2% supplement (B27). Store at 4 °C. Use at room temperature (RT).
- Prepare a plating medium of basal medium (RPMI 1640), 2% supplement (B27) and 1:2000 ROCK inhibitor. Store at 4 °C. Use at RT.
- Coat sterilized 10 mm round glass #0 coverslips with 150 µL of 1:60 factor free basement membrane matrix and incubate at 4 °C for 4 h.
NOTE: Optimization of coverslip volume is necessary to ensure the entire glass is covered while maintaining adequate surface tension to prevent spillage. 150 µL is recommended for 10 mm round coverslips. Batch size, coverslip type, coverslip volume and culture plate type can be suited to the experimenters needs. - Begin iPSC-CM dissociation with an EDTA-based cell dissociation reagent. Ensure that the monolayer is completely detached by gently flushing with a 1,000 µL pipette.
- Transfer the cellular suspension into a 15 mL tube and add double volume plating medium. Centrifuge for 10 min at 100 x g.
- Resuspend the pellet with a desired volume (resuspension volume) of plating medium. Count cells manually or electronically.
- Select optimal density per coverslip (15,000) which will allow for the isolated cellular analysis later.
- Calculate the volume of ‘active’ cellular suspension (A) needed to plate all coverslips at this desired density. Apply the following formula and withdraw into a separate tube:

- Calculate the volume of extra plating medium (B) needed to accommodate each coverslip at a desired volume. Apply the following formula and add the resulting volume to the tube of active suspension:

- Remove the matrix from coverslips and apply the ‘coverslip volume’ of cell suspension (A+B) to each coverslip. Regularly resuspend in the tube to ensure even cellular distribution.
- Incubate at 37 °C for 1 h. Gently fill the well with plating medium.
- After 24 h, exchange media with normal culture medium and maintain every 2-3 days.
2. Experimental setup
- Equip an inverted epifluorescence microscope with a 40x magnification, high numerical aperture lens (N.A: > 0.75) to conduct experiments.
- Couple a fast switching warm white LED to the transmitted illumination port of the microscope. Insert a simple red 660 nm filter into the transmitted light path.
NOTE: This light can be activated throughout photometry experiments to observe the sample without contaminating the green fluorescent signal. - Mount a fast switching 470 nm LED head for photometry recording. Insert a 470/40 excitation filter at the epifluorescent port of the microscope to clean-up the light generated by the LED.
NOTE: For optimum signal quantification an illumination system with high speed feedback control of optical output is recommended. - Insert a microscope cube containing a 495 nm long pass beam splitter in the mirror unit carousel within the microscope.
- Fit a detection arm containing an adjustable field diaphragm to the microscope C-mount port to allow region of interest selection.
- Separately couple a photomultiplier detector (PMT) and a USB camera to the microscope. This will form the basis of the emission detection system.
- Insert a filter cube containing a 565 nm long pass beam splitter and a 535/50 emission filter into the PMT port. This splits emission light between the two detectors.
NOTE: A camera attached to the transmitted port of the emission detection system can detect transmitted light under brightfield throughout all experiments. - Couple the PMT to a power supply and a PMT amplifier. Connect the PMT amplifier output to an analogue input pin of a data acquisition system.
- Filter analogue data from the PMT at 1 kHz or higher.
- Digitize data at a frequency that is at least double that of the highest frequency present in analogue signal (2 kHz or higher) to fulfill Nyquist criteria and prevent aliasing.
3. Cellular loading with VF2.1Cl
NOTE: All steps involving this dye must be carried out in low light conditions.
- Prepare a Tyrode’s bath solution of (in mM): 140 NaCl, 10 HEPES, 10 Glucose, 4 KCl, 1 MgCl2, 2 CaCl2, pH = 7.35 and warm to 37 °C.
- Prepare an aliquot of loading solution in a microcentrifuge tube by mixing 5 µL of 1,000x VF2.1Cl and 50 µL of 20% solubilizing poloxamer solution.
- Apply 5 µL of the loading solution to 5 mL of warmed Tyrode’s solution (total 0.1x dye concentration) in a 20 mm Petri dish.
NOTE: Final dye concentration is 0.1x. This is 1/10th that suggested by the manufacturer. This conserves resources, ensures negligible cytotoxicity, and importantly, still retains clear optical signals from loaded cells with high signal to noise ratios. - Add a single iPSC-CM cover slip to the dish and incubate at 37 °C for 20 min.
- Assemble a heated live cell imaging chamber. Mount onto the microscope stage and fill with 500 µL of fresh Tyrode’s solution.
- Wash the coverslip with fresh Tyrode’s solution at 37 °C.
- Carefully apply the iPSC-CM coverslip to the pre-warmed bath chamber using fine point forceps.
NOTE: Ensure the chamber and its contents are always heated at physiological temperatures. If desired, commence with continuous perfusion of warmed Tyrode’s solution.
4. Electrical field stimulation
NOTE: External triggering of iPSC-CM is optional but useful for standardization of cellular dynamics and experimental parameters. It increases the ease of analysis and allows for the investigation of frequency-dependent effects.
- Attach a stimulation insert with two platinum electrodes spaced 5 mm apart into the recording chamber.
- Connect an external stimulator to the stimulation insert. Set to 5 ms bipolar field pulses at 0.5 Hz.
- Determine optimal stimulation voltage by increasing the stimulus from 1 V upwards. Threshold stimulus is defined as the lowest voltage at which cells begin to contract. Apply voltages roughly 25% above this threshold. Normal range is between 1 V and 30 V.
- Fix stimulation frequency with the external stimulator or trigger it with acquisition software.
5. Optical action potential acquisition
NOTE: This protocol uses a commercial software for acquisition and analysis.
- Visualize the myocytes in brightfield view using the transmitted light path and the USB camera.
- Select an isolated cell and tightly crop its optical path with the field diaphragm ensuring only light from the cell of interest is monitored.
- Activate the PMT amplifier and set the PMT supply to 750 V.
- Run the stimulation protocol (see step 4) along with the acquisition software and simultaneously activate the 470 nm excitation light. The latter can be done via a remote panel or automated at a fixed intensity (TTL signal).
- Adjust gain and offset of the PMT amplifier to make sure the signal does not saturate and is optimized for the detection range of the recording system.
- Record 10 sweeps ensuring stable action potentials are detected.
- Continue recording and immediately move the microscope stage to briefly acquire background signal from a region devoid of cells. Turn off the excitation light.
NOTE: This background value (Foffset ) will be used to account for any background fluorescence. - If desired, locally perfuse reference drugs such as 1 µM nifedipine to identify cellular responses to pharmacological manipulation.
- In a sequential fashion, repeat steps 5.2–5.7, each time selecting a new cell. Swap out coverslips if desired to ensure high experimental turnover in a single sitting.
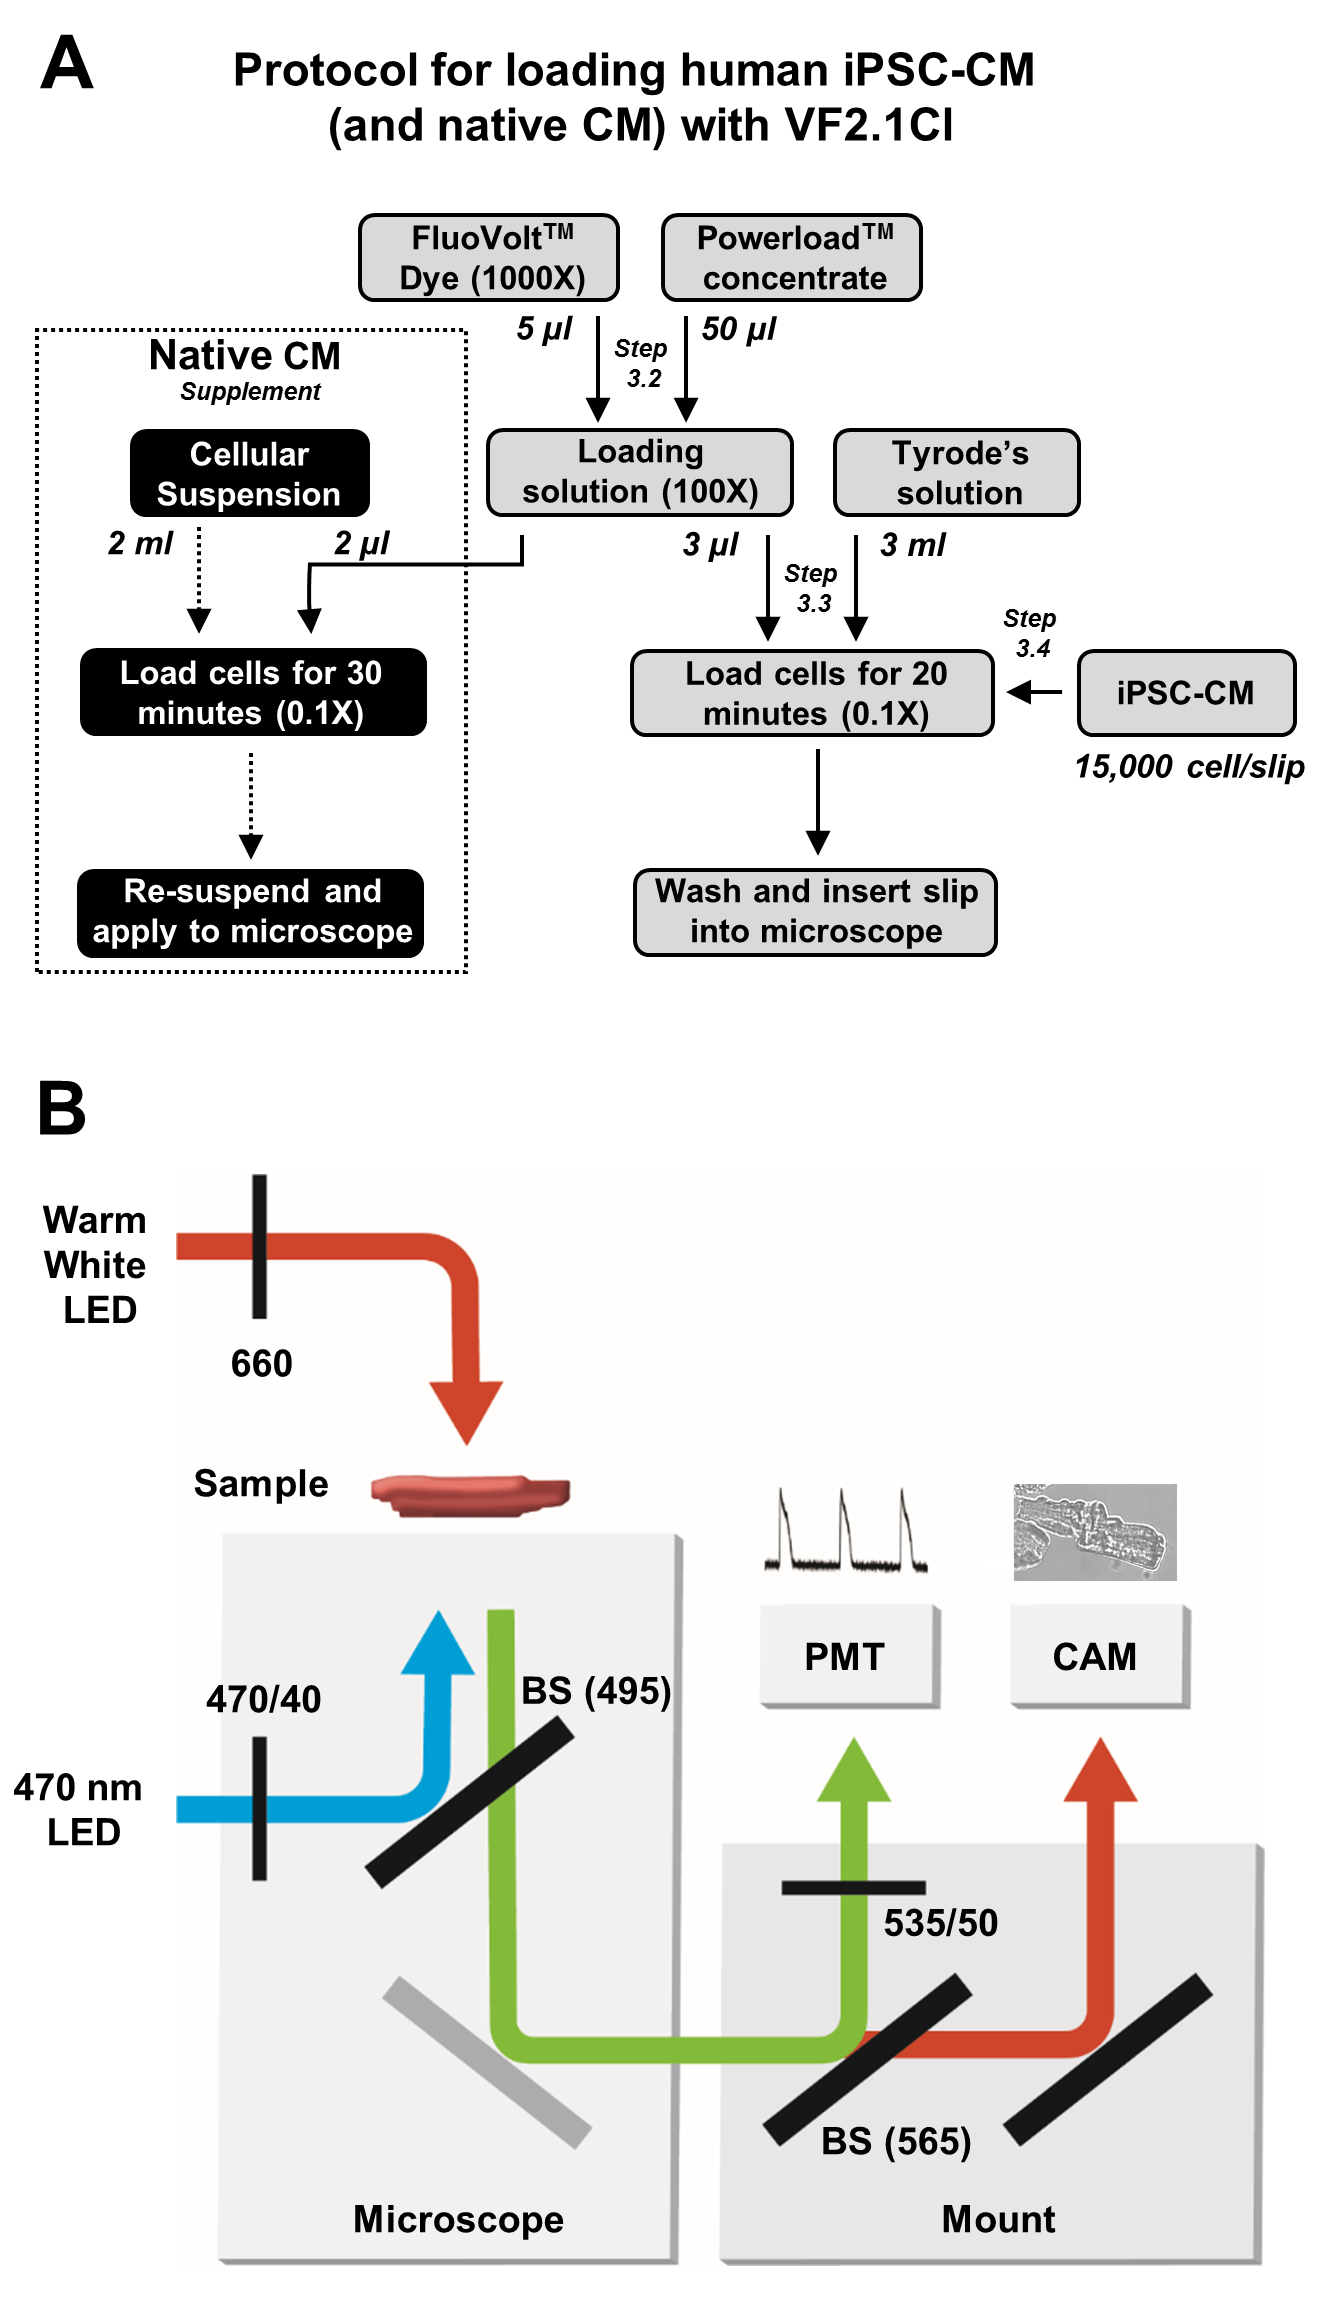
NOTE: Loading and image acquisition protocols are described in Figure 2.
6. Data analysis
- Open a saved recording with the analysis software and average 10 sweeps containing stimulated action potentials from a single cell.
- Take a mean of the baseline signal representing Foffset and subtract this from the averaged trace.
- Calculate ∆F/F0 with the following formula (where F is measured fluorescence and F0 is diastolic fluorescence):

- Identify the trace baseline (diastolic) and area of interest (AP) and measure the desired cardiac action potential parameters. This includes but is not limited to the decay time for 50% (APD50) and 90% (APD90) repolarization.
- Export the data from this single cell to a spreadsheet software.
- Repeat steps 6.1 – 6.5 for all recordings. Assess results with appropriate unpaired tests or analysis of variance.

Figure 2: Loading and image acquisition protocols. (A) Flow chart of complete VF2.1Cl loading protocol for iPSC-CMs and native cardiomyocytes. (B) A simplified schematic of beam splitter (BS) and filter configurations used in this protocol for excitation and detection of VF2.1Cl emission in response to changes in transmembrane voltage. Please click here to view a larger version of this figure.
Wyniki

Figure 3: Optical action potential (AP) profiles of isolated native cardiomyocytes and human induced pluripotent stem cell derived cardiomyocytes (iPSC-CM). (A) Representative optical AP of a single murine cardiomyocyte (center) with Mean ± SEM of APD50 and APD90 (n = 7, right). (B) Representative optical AP of a singl...
Dyskusje
Here we describe a basic protocol to easily acquire detailed AP profiles from isolated iPSC-CMs suitable for electrophysiological modelling and cardiac drug screening. We detect regular, robust APs from our sparsely seeded iPSC-CMs which suggests both indicator functionality and methodological fidelity.
Due to the wide spectrum of commercial methodologies for iPSC reprogramming and lack of standardization for cardiac differentiation protocols, iPSC based models can show immense variability in ...
Ujawnienia
Cairn Research Ltd supported this publication by covering production costs of the video file.
Podziękowania
The authors would like to acknowledge Cairn Research Ltd. for their kind financial contribution which covered production costs of this publication. In addition, we thank Ms. Ines Mueller and Ms. Stefanie Kestel for their excellent technical support.
The authors’ research is supported by the German Center for Cardiovascular Research (DZHK), the Deutsche Forschungsgemeinschaft (DFG, German Research Foundation, VO 1568/3-1, IRTG1816 RP12, SFB1002 TPA13 and under Germany’s Excellence Strategy - EXC 2067/1- 390729940) and the Else-Kröner-Fresenius Stiftung (EKFS 2016_A20).
Materiały
| Name | Company | Catalog Number | Comments |
| Reagents | |||
| 0.25 Trypsin EDTA | Gibco | 25200056 | |
| B27 Supplement | Gibco | 17504044 | |
| CaCl2 | Carl Roth | HN04.2 | |
| D(+)-Glucose anhydrous BioChemica | ITW Reagents | A1422 | |
| Fetal Bovine Serum | Gibco | 10270-106 | |
| FluoVolt Membrane Potential Kit | Invitrogen | F10488 | |
| HEPES | Carl Roth | HN77.4 | |
| KCl | Sigma-Aldrich | 6781.1 | |
| Lamanin | Sigma-Aldrich | 114956-81-9 | |
| Matrigel | BD | 354230 | |
| NaCl | Sigma-Aldrich | 9265.2 | |
| Nifedipine | Sigma-Aldrich | 21829-25-4 | |
| Penicillin/Streptomycin | Invitrogen | 15140 | |
| ROCK Inhibitor Y27632 | Stemolecule | 04-0012-10 | |
| RPMI 1640 Medium | Gibco | 61870010 | |
| Versene EDTA | Gibco | 15040033 | |
| Equipment | |||
| 495LP Dichroic Beamsplitter | Chroma Technology | ||
| Axopatch 200B Amplifier | Molecular Devices | ||
| Circle Coverslips, Thickness 0 | Thermo Scientific | CB00100RA020MNT0 | |
| Digidata 1550B | Molecular Devices | ||
| Dual OptoLED Power Supply | Cairn Research | ||
| ET470/40x Excitation Filter | Chroma Technology | ||
| ET535/50m | Chroma Technology | ||
| Etched Neubauer Hemacytometer | Hausser Scientific | ||
| Filter Cubes | Cairn Research | ||
| IX73 Inverted Microscope | Olympus | ||
| MonoLED | Cairn Research | ||
| Multiport Adaptors | Cairn Research | ||
| Myopacer Cell Stimulator | IonOptix | ||
| Optomask Shutter | Cairn Research | ||
| Optoscan System Controller | Cairn Research | ||
| PH-1 Temperature Controlled Platform | Warner Instruments | ||
| Photomultiplier Detector | Cairn Research | ||
| PMT Amplifier Insert | Cairn Research | ||
| PMT Supply Insert | Cairn Research | ||
| RC-26G Open Bath Chamber | Warner Instruments | ||
| SA-OLY/2AL Stage Adaptor | Olympus | ||
| T565lpxr Dichroic Beamsplitter | Chroma Technology | ||
| T660lpxr Dichroic Beamsplitter | Chroma Technology | ||
| TC-20 Dual Channel Temperature Controller | npi Electronic | ||
| UPLFLN 40X Objective | Olympus | ||
| USB 3.0 Colour Camera | Imaging Source | ||
| Software | |||
| Clampex 11.1 | Molecular Devices | ||
| Clampfit 11.1 | Molecular Devices | ||
| IC Capture 2.4 | Imaging Source | ||
| Prism 8 | Graphpad |
Odniesienia
- Miller, E. W. Small molecule fluorescent voltage indicators for studying membrane potential. Current Opinion in Chemical Biology. 33, 74-80 (2016).
- Liang, P., et al. Drug screening using a library of human induced pluripotent stem cell-derived cardiomyocytes reveals disease-specific patterns of cardiotoxicity. Circulation. 127 (16), 1677-1691 (2013).
- Horváth, A., et al. Low resting membrane potential and low inward rectifier potassium currents are not inherent features of hiPSC-derived cardiomyocytes. Stem Cell Reports. 10 (3), 822-833 (2018).
- Salama, G., Morad, M. Merocyanine 540 as an optical probe of transmembrane electrical activity in the heart. Science. 191 (4226), 485-487 (1976).
- Hortigon-Vinagre, M., et al. The use of ratiometric fluorescence measurements of the voltage sensitive dye Di-4-ANEPPS to examine action potential characteristics and drug effects on human induced pluripotent stem cell-derived cardiomyocytes. Toxicological Sciences. 154 (2), 320-331 (2016).
- Blinova, K., et al. International multisite study of human-induced pluripotent stem cell-derived cardiomyocytes for drug proarrhythmic potential assessment. Cell Reports. 24 (13), 3582-3592 (2018).
- Miller, E. W., et al. Optically monitoring voltage in neurons by photo-induced electron transfer through molecular wires. Proceedings of the National Academy of Sciences. 109 (6), 2114-2119 (2012).
- Bedut, S., et al. High-throughput drug profiling with voltage- and calcium-sensitive fluorescent probes in human iPSC-derived cardiomyocytes. American Journal of Physiology-Heart and Circulatory Physiology. 311 (1), 44-53 (2016).
- McKeithan, W. L., et al. An automated platform for assessment of congenital and drug-induced arrhythmia with hiPSC-derived cardiomyocytes. Frontiers in Physiology. 8, 766 (2017).
- Duncan, G., et al. Drug-mediated shortening of action potentials in LQTS2 human induced pluripotent stem cell-derived cardiomyocytes. Stem Cells and Development. 26 (23), 1695-1705 (2017).
- Asakura, K., Hayashi, S., Ojima, A., Taniguchi, T., Miyamoto, N. Improvement of acquisition and analysis methods in multi-electrode array experiments with iPS cell-derived cardiomyocytes. Journal of Pharmacological and Toxicological Methods. 75, 17-26 (2015).
- Lian, X., et al. Directed cardiomyocyte differentiation from human pluripotent stem cells by modulating Wnt/β-catenin signaling under fully defined conditions. Nature Protocols. 8 (1), 162-175 (2013).
- Burridge, P. W., et al. Chemically defined generation of human cardiomyocytes. Nature methods. 11 (8), 855-860 (2014).
- Kleinsorge, M., Cyganek, L. Subtype-directed differentiation of human iPSCs into atrial and ventricular cardiomyocytes. STAR Protocols. , 100026 (2020).
- Knollmann, B. C., Katchman, A. N., Franz, M. R. Monophasic action potential recordings from intact mouse heart: validation, regional heterogeneity, and relation to refractoriness. Journal of Cardiovascular Electrophysiology. 12 (11), 1286-1294 (2001).
- Leopold, J. A., Loscalzo, J. Emerging role of precision medicine in cardiovascular disease. Circulation Research. 122 (9), 1302-1315 (2018).
- Voigt, N., Zhou, X. B., Dobrev, D. Isolation of human atrial myocytes for simultaneous measurements of Ca2+ transients and membrane currents. Journal of Visualized Experiments. (77), e50235 (2013).
- Voigt, N., et al. Enhanced sarcoplasmic reticulum Ca2+ Leak and increased Na+-Ca2+ exchanger function underlie delayed afterdepolarizations in patients with chronic atrial fibrillation. Circulation. 125 (17), 2059-2070 (2012).
- Voigt, N., et al. Cellular and molecular mechanisms of atrial arrhythmogenesis in patients with paroxysmal atrial fibrillation. Circulation. 129 (2), 145-156 (2014).
- Fakuade, F. E., et al. Altered atrial cytosolic calcium handling contributes to the development of postoperative atrial fibrillation. Cardiovascular Research. , 162 (2020).
- Gross, E., Bedlack, R. S., Loew, L. M. Dual-wavelength ratiometric fluorescence measurement of the membrane dipole potential. Biophysical Journal. 67 (1), 208-216 (1994).
- Matiukas, A., et al. Near-infrared voltage-sensitive fluorescent dyes optimized for optical mapping in blood-perfused myocardium. Heart Rhythm. 4 (11), 1441-1451 (2007).
- Mutoh, H., et al. Spectrally-resolved response properties of the three most advanced fret based fluorescent protein voltage probes. PLoS One. 4 (2), 4555 (2009).
- Hochbaum, D. R., et al. All-optical electrophysiology in mammalian neurons using engineered microbial rhodopsins. Nature Methods. 11 (8), 825-833 (2014).
- Huang, Y. L., Walker, A. S., Miller, E. W. A photostable silicon rhodamine platform for optical voltage sensing. Journal of the American Chemical Society. 137 (33), 10767-10776 (2015).
- Deal, P. E., Kulkarni, R. U., Al-Abdullatif, S. H., Miller, E. W. Isomerically pure tetramethylrhodamine voltage reporters. Journal of the American Chemical Society. 138 (29), 9085-9088 (2016).
- Fluhler, E., Burnham, V. G., Loew, L. M. Spectra, membrane binding, and potentiometric responses of new charge shift probes. Biochemistry. 24 (21), 5749-5755 (1985).
- Fromherz, P., Muller, C. O. Voltage-sensitive fluorescence of amphiphilic hemicyanine dyes in neuron membrane. Biochimica et Biophysica Acta. 1150 (2), 111-122 (1993).
- Salama, G., et al. Properties of new, long-wavelength, voltage-sensitive dyes in the heart. Journal of Membrane Biology. 208 (2), 125-140 (2005).
- Jin, L., et al. Single action potentials and subthreshold electrical events imaged in neurons with a fluorescent protein voltage probe. Neuron. 75 (5), 779-785 (2012).
- Kralj, J. M., Douglass, A. D., Hochbaum, D. R., MacLaurin, D., Cohen, A. E. Optical recording of action potentials in mammalian neurons using a microbial rhodopsin. Nature Methods. 9 (1), 90-95 (2012).
- Tsutsui, H., Karasawa, S., Okamura, Y., Miyawaki, A. Improving membrane voltage measurements using FRET with new fluorescent proteins. Nature Methods. 5 (8), 683-685 (2008).
- Lundby, A., Mutoh, H., Dimitrov, D., Akemann, W., Knöpfel, T. Engineering of a genetically encodable fluorescent voltage sensor exploiting fast Ci-VSP voltage-sensing movements. PLoS One. 3 (6), 2514 (2008).
- Bradley, J., Luo, R., Otis, T. S., DiGregorio, D. A. Submillisecond optical reporting of membrane potential in situ using a neuronal tracer dye. The Journal of neuroscience. 29 (29), 9197-9209 (2009).
- Herron, T. J., Lee, P., Jalife, J. Optical imaging of voltage and calcium in cardiac cells & tissues. Circulation Research. 110 (4), 609-623 (2012).
- Kappadan, V., et al. High-resolution optical measurement of cardiac restitution, contraction, and fibrillation dynamics in beating vs. blebbistatin-uncoupled isolated rabbit hearts. Frontiers in Physiology. 11, 464 (2020).
- Kettlewell, S., Walker, N. L., Cobbe, S. M., Burton, F. L., Smith, G. L. The electrophysiological and mechanical effects of 2,3-butane-dione monoxime and cytochalasin-D in the Langendorff perfused rabbit heart. Experimental Physiology. 89 (2), 163-172 (2004).
- Képiró, M., et al. para-Nitroblebbistatin, the non-cytotoxic and photostable Myosin inhibitor. Angewandte Chemie International Edition. 53 (31), 8211-8215 (2014).
Przedruki i uprawnienia
Zapytaj o uprawnienia na użycie tekstu lub obrazów z tego artykułu JoVE
Zapytaj o uprawnieniaPrzeglądaj więcej artyków
This article has been published
Video Coming Soon
Copyright © 2025 MyJoVE Corporation. Wszelkie prawa zastrzeżone