
Aby wyświetlić tę treść, wymagana jest subskrypcja JoVE. Zaloguj się lub rozpocznij bezpłatny okres próbny.
Method Article
Using Microfluidics and Fluorescence Microscopy to Study the Assembly Dynamics of Single Actin Filaments and Bundles
W tym Artykule
Podsumowanie
We present protocols for simple actin filament microfluidic assays, in combination with fluorescence microscopy, that allow one to accurately monitor individual actin filaments in real-time while sequentially exposing them to different protein solutions.
Streszczenie
In order to decipher the complex molecular mechanisms that regulate the assembly and disassembly of actin filaments, it is a great asset to monitor individual reactions live in well-controlled conditions. To do so, live single-filament experiments have emerged over the past 20 years, mostly using total internal reflection fluorescence (TIRF) microscopy, and have provided a trove of key results. In 2011, in order to further expand the possibilities of these experiments and to avoid recurring problematic artifacts, we introduced simple microfluidics in these assays. This study details our basic protocol, where individual actin filaments are anchored by one end to the passivated coverslip surface, align with the flow, and can be successively exposed to different protein solutions. We also present the protocols for specific applications and explain how controlled mechanical forces can be applied, thanks to the viscous drag of the flowing solution. We highlight the technical caveats of these experiments and briefly present possible developments based on this technique. These protocols and explanations, along with today's availability of easy-to-use microfluidics equipment, should allow non-specialists to implement this assay in their labs.
Wprowadzenie
The assembly and disassembly of actin filaments and actin filament networks are controlled by several biochemical reactions and depend on the mechanical context. In order to gain insight into these complex mechanisms, it is invaluable to be able to observe individual reactions on individual filaments (in sufficiently large numbers). Over the past decades, the observation of dynamic actin filaments in real-time, mostly using total internal reflection fluorescence (TIRF) microscopy, has emerged as a key technique and has provided an impressive list of results that could not have been obtained with bulk solution biochemical assays1.
To achieve this, one needs to maintain fluorescently labeled actin filaments close to the surface of the microscope coverslip while exposing them to solutions of actin-binding proteins (ABPs), which can also be fluorescently labeled. Doing so provides a means to monitor events taking place on individual filaments in well-controlled biochemical conditions, and thus quantify reaction rates. However, a number of specific limitations should be considered. Artificially maintaining filaments close to the surface, often thanks to multiple anchoring points or by using a crowding agent such as methylcellulose, can alter their behavior (e.g., causing pauses in their polymerization and depolymerization2). Tracking the contour of each filament can be challenging, particularly if new filaments or filament fragments accumulate in the field of view over time. The reactions take place in a finite volume where the concentration of actin monomers and ABPs can vary over time, potentially making it difficult to derive accurate rate constants. Finally, renewing or changing the solution of ABPs is difficult to achieve in less than 30 s and will often lead to inhomogeneous protein content in the sample.
A bit over 10 years ago, inspired by what was already done to study individual Deoxyribonucleic Acid (DNA) strands3, we introduced a new technique based on microfluidics to observe and manipulate individual actin filaments4. It allows one to circumvent the aforementioned limitations of classical single-filament techniques. In these microfluidics assays, actin filaments are grown from spectrin-actin seeds adsorbed on the coverslip. Filaments are thus anchored by one end only to the bottom of the microfluidic chamber and fluctuate above the surface without sticking. Filaments align with the flow of incoming solutions, thereby easing the monitoring of their contour length and maintaining them in a shallow region above the coverslip where TIRF can be used. Different solutions are simultaneously flowed into the chamber without mixing, and the filaments can be exposed to them sequentially and rapidly.
Here, we propose a series of basic protocols to set up single-actin-filament microfluidics assays in the lab. Coverslips and microfluidics chambers can be prepared in advance (in half a day), and the experiment itself, where several biochemical conditions can be tested, is done in less than a day.
Protokół
1. Microfluidic chamber preparation
- Select a SU-8 master mold with several chamber patterns. Typical chambers are cross-shaped with three inlets and one outlet, 20 µm high and 800 µm wide (Figure 1). Such master molds can be purchased from external companies or made in academic laboratories (e.g., Gicquel, Y. et al.5).
- Place tape around the edge of the mold.
- Put ~50 cm long, 19 mm wide, standard transparent office tape (see Table of Materials) on a bench, sticky side up. Place the mold vertically at one end and along the midline of the tape.
- Roll the mold to the other end of the tape to create a 1 cm border around the mold. Fold down the tape over the bottom of the mold.
- Prepare Polydimethylsiloxane (PDMS) solution.
- In a disposable weighing dish, directly pour 25-30 g of PDMS base (Table of Materials). Add 10% weight/weight PDMS curing agent (Table of Materials) with a disposable plastic Pasteur pipette.
- Mix manually and thoroughly with a plastic stick. Ensure that the curing agent is well incorporated into the PDMS base, even if stirring creates lots of bubbles.
- Degas the PDMS solution in a vacuum desiccator (Table of Materials) for at least 5 min at room temperature (RT). Bubbles will expand, rise to the surface, and burst when the vacuum is broken.
- Pour the PDMS solution over the SU-8 mold. Use a plastic stick to scrape and transfer as much of the mixture as possible.
- Degas PDMS for a second time (5 min in the vacuum desiccator). Make sure to get rid of most bubbles (a few small bubbles at the top surface are fine).
- Place the mold in an oven at 70 °C for at least 5 h for the PDMS to reticulate and solidify.
- Remove solid PDMS chambers from the mold.
CAUTION: Silicon wafers for SU-8 molds are extremely fragile, so extensive care must be taken when separating the PDMS from wafers. Work on a hard, flat surface and keep the wafer flat on the surface.- With a razor blade, make a circular cut in the PDMS, about 1 cm away from the edge of the mold. All patterns must be at least 0.5 cm inside the cut. Gently peel off the central PDMS block with gentle tugs.
CAUTION: When peeling off, maintain the SU-8 mold flat on the benchtop to prevent breaking it. - Place PDMS on clean aluminum foil, the molded surface facing the aluminum foil, to protect its surface from dust and to make patterns more visible.
- With a razor blade, make a circular cut in the PDMS, about 1 cm away from the edge of the mold. All patterns must be at least 0.5 cm inside the cut. Gently peel off the central PDMS block with gentle tugs.
- Choose and cut a chamber with a razor blade at least 0.5 cm away from the pattern. The resulting PDMS block is around 0.5 cm high, 1.5 cm wide, and 3 cm long. Pierce three inlets and one outlet with a biopsy punch 0.75 mm I.D. (Table of Materials).
- Clean the PDMS chamber with ultrapure ethanol (Table of Materials) and air-dry using a safety blowgun (Table of Materials). Place the PDMS with the pattern facing up in a clean Petri dish, and close the dish with its lid.
2. Glass coverslip cleaning
NOTE: Here, a standard coverslip cleaning procedure, based on a series of sonication steps, is detailed. Other glass coverslip-cleaning procedures have been described in many other publications that can achieve similar satisfying results6,7,8,9.
- Place 10-20 coverslips (40 mm long) on a Polytetrafluoroethylene (PTFE) holder (Table of Materials). Sonicate the coverslips in 0.5 L of 2% glass cleaning solution (Table of Materials) in a 1 L glass beaker (35 °C, 30 min).
- Dispose the glass cleaning solution and rinse the coverslips extensively with dH2O in at least three successive 0.5 L baths.
- Prepare 0.5 L of 2 M KOH in a 1 L glass beaker. Sonicate the coverslips in KOH (RT, 30 min). Dispose KOH and rinse the coverslips with dH2O in at least three 0.5 L baths.
CAUTION: Use appropriate lab safety protection equipment (gloves, glasses, and lab coat). - Transfer and sonicate the coverslips in 0.5 L of ultrapure ethanol (RT, 30 min). Coverslips can be kept in ethanol for up to 2 weeks. Close the beaker with thermoplastic film (Table of Materials) to prevent evaporation. Before use, dry the coverslip with air flow.
3. PDMS chamber assembly
- Preheat the hot plate to 100 °C. Place up to three cleaned PDMS chambers and glass coverslips in a clean Petri dish. Place the open Petri dish in a deep Ultraviolet (UV) cleaner (λ = 185 nm, see Table of Materials) and expose it to UV light for 3-5 min.
NOTE: Alternatively, PDMS chambers and coverslips can be exposed to air or oxygen plasma for 30 s. - Gently position the PDMS chamber over the coverslip. Make sure the two surfaces put in contact were directly exposed to UV. The PDMS automatically sticks to the glass and the chamber becomes clearly visible.
- To remove any air trapped at the PDMS-coverslip interface, very gently press the surface with a finger. For a tighter bonding, press more strongly over corners and sides. Make sure that the ceiling of the chamber does not come in contact with the glass surface.
- Place the chamber with the glass bottom facing the hot plate at 100 °C for 5 min. After this step, the glass-PDMS bonds become permanent, and chambers can only be used once. Use the chamber immediately or store it in a clean Petri dish for up to a week.
4. [OPTIONAL] Direct passivation and functionalization
NOTE: Depending on the application, chambers can be passivated and functionalized either once connected to the microfluidic controlling device (see Table of Materials) or by manually injecting solutions directly into the chamber with a pipette prior to its connection to the microfluidic device. The latter offers the advantage of consuming less reagent and avoiding potential contamination by flowing the solution through the polyether ether ketone (PEEK) tubing of the microfluidic device. In all the following steps, solutions are injected by directly sticking the pipette tip into the outlet. In order to avoid creating bubbles inside the chamber, make sure to have a tiny droplet sticking out of the pipette tip when plugging the tip into the outlet of the PDMS chamber. Likewise, remove the pipette tip before the entire volume has been injected.
- Inject 20 µL of PLL-PEG (1 mg/mL in Phosphate-buffered saline (PBS)). Incubate for a minimum of 1 h (or overnight) at RT. To prevent evaporation, place the PDMS chamber in a humid box (e.g., an empty tip box with water in the lower compartment and the PDMS chamber on the tip-holding platform).
- Inject 20 µL of 100 pM spectrin-actin seeds (in F-buffer, see Table 1 and Table 2). Wait for no more than 1 min. Adjust the seed concentration and timing to tune seed surface density, high enough for large statistics and low enough for filaments not to overlap.
NOTE: Alternatively, if spectrin-actin seeds are not available, use biotin-functionalized short filament segments that will be immobilized on a streptavidin-coated coverslip9,10. - [OPTIONAL] Inject 20 µL of 5% bovine serum albumin (BSA) in F-buffer. Leave at RT for 10 min.
- [OPTIONAL] Inject 20 µL of 1 mg/mL β-casein in F-buffer. Leave at RT for 10 min.
NOTE: Follow steps 4.3 and/or 4.4 to further passivate the chamber. The choice of passivation depends on the proteins used and does not work equally well on all ABPs. When using actin alone, PLL-PEG or BSA is sufficient.
5. Connect microfluidic device
NOTE: Use a pressure-based microfluidic system with up to four channels to control flows in the microfluidic chamber (Figure 1A, see Table of Materials). To avoid bubbles forming in the microfluidic tubing and perturbing flow stability, degas all solutions. Place 5 mL of dH20 and 10 mL of F-buffer stock in a vacuum desiccator connected to a vacuum pump (ultimate vacuum <250 mbar) and degas for at least 1 h at RT.
- Rinse inlets + outlet tubings with dH2O (500 µL, 300 mbar).
- Fill all 2 mL reservoir tubes (see Table of Materials) with 300 µL of F-buffer. Set pressure to 300 mbar and let five to eight drops go to waste. Repeat for each channel and set pressure to 0.
- Connect the outlet and rinse the chamber extensively.
- Set the pressure for the reservoir tube 4 (outlet) to 50 mbar. Once a droplet comes out from the tubing end, connect the tubing to the outlet of the PDMS chamber. The liquid fills in the chamber and comes out of all inlets.
- [OPTIONAL] If the chamber has been directly passivated (section 4), set pressure to 100 mbar to rinse the chamber with 50-100 µL of F-buffer (3-5 min). Remove the excess liquid at inlets with a cleaning tissue.
- Set pressure to 20 mbar.
- Connect inlets.
- Set the pressure for the reservoir tube 1 to 50 mbar. To avoid introducing air bubbles, ensure that a droplet comes out of the tubing and the PDMS inlet.
- Connect the tubing to inlet 1 (the two droplets merging when connecting). Set the pressure to 30 mbar.
- Repeat steps 5.4.1-5.4.2 to connect inlets 2 and 3.
- Set the pressure of all inlets to 20 mbar and the outlet pressure to 0 mbar. Ensure that the flow rates in the inlets are roughly equal (see Troubleshooting section).

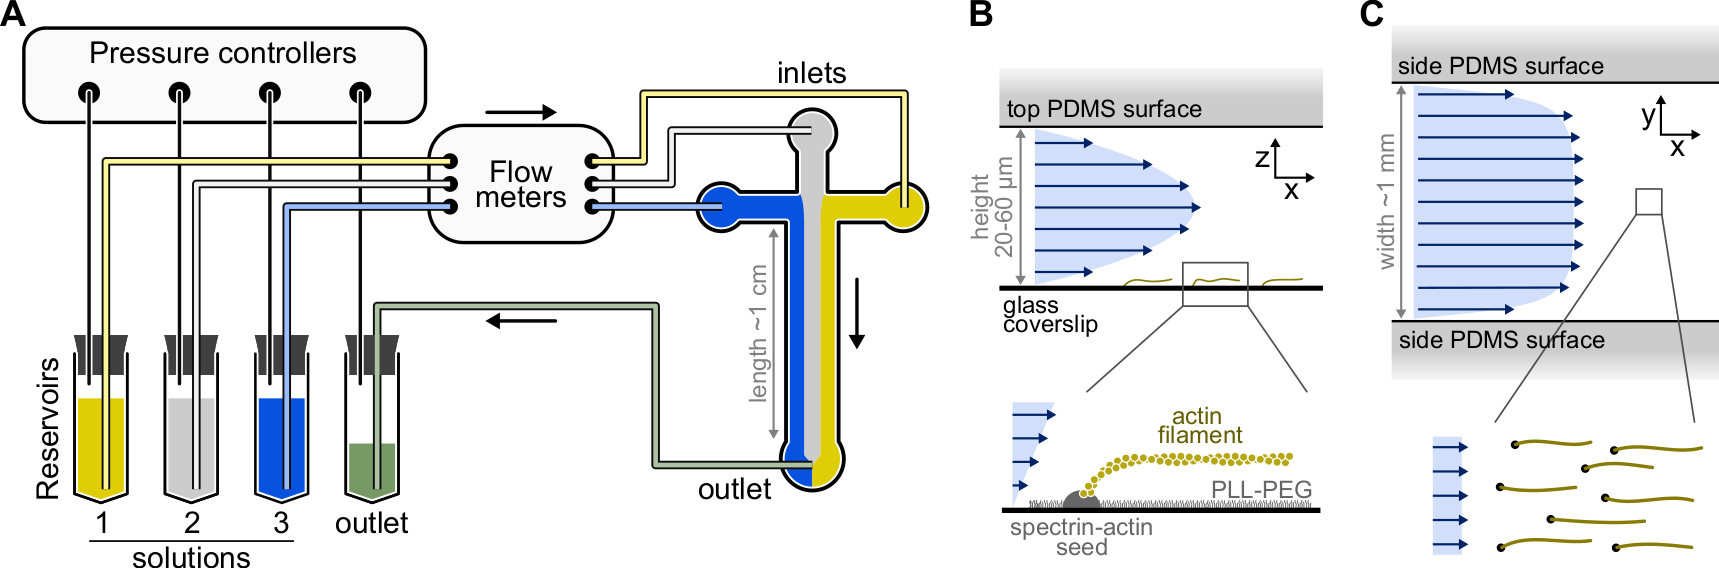
Figure 1: Injecting solutions through a microfluidic chamber. (A) Standard microfluidic setup for single actin filaments experiments. Protein solutions, placed in reservoirs 1-3, are pushed into the chamber by adjusting the pressure in the gas phase. The generated flow rates are measured by flow meters. Inside the microfluidic chambers, solutions do not mix and occupy space depending on the relative pressures applied (here, equal pressure on all inlets). Typical dimensions: reservoir tubes contain up to 2 mL of solution. PEEK tubing (0.25 mm inner diameter) connects the reservoirs to the flow meters (after 10 cm of tubing) and then to the PDMS chamber (after another 70 cm). Silicon tubing and stainless steel tubing couplers are used to connect the PEEK tubing to the PDMS inlets. The main microfluidic channel is 20-60 µm high, around 1 mm wide and 1 cm long. (B,C) Flow profiles inside the microfluidic chamber. (B) The fluid generates a parabolic profile across the chamber height: v(z) = 6z(h-z)R/h3w, where h and w are the chamber height and width, and R is the total flow rate. Bottom: Single actin filament polymerized from surface-anchored spectrin-actin seeds. (C) When the chamber width is considerably larger than its height, the flow is nearly uniform across the chamber, except at the PDMS surfaces, where it goes to zero. Please click here to view a larger version of this figure.
6. Configuring the setup with standard flow rates
NOTE: The computer-controlled pressure system allows easy and precise adjustment of the pressures of all inlets/outlet connected to the PDMS chamber, therefore the control of incoming and outcoming flow rates. Preset configurations can be saved and turned on/off with a single mouse click. Below are the recommended configurations (unless otherwise stated, outlet pressure is set to 0 mbar). See Table 3 for expected flow rates for these preset configurations. The pressures indicated here must be adjusted depending on the chamber geometry and system configuration.
- Change: Use this preset when changing one or more reservoir(s). It creates a mild backward flow in the tubing of interest to prevent introducing bubbles.
- Set all inlet pressures to 12 mbar and outlet pressure to 5 mbar (Figure 2B).
- High Flow 'All': Use this preset to rapidly inject three solutions in parallel. They will reach the chamber within 4 min.
- Set all inlet pressures to 150 mbar.
- High Flow 'x': Use this preset to rapidly inject a solution. It will reach the chamber within 3 min (Figure 3A-C).
- Set inlet 'x' pressure to 150 mbar (~15 µL/min). The pressure in the other inlets is adjusted to around 100 mbar, such that the resulting flow rate in these inlets is ~500 nL/min.
- Mid Flow 'All': Use this preset to pause the system.
- Set all inlets to 20 mbar (Figure 2A).
- Mid Flow 'x': Use this preset to allow the solution 'x' to fill in most of the main channel width (see Figure 2C,D), while restricting the other inlet solutions to the channel sides. Actin filaments in the chamber will thus be exposed to the biochemical condition imposed by solution 'x' only.
- Set inlet 'x' pressure to 12 mbar. Set the pressure in the other inlets and adjust to ~9 mbar, such that their respective flow rates are ~ 150 nL/min.

Figure 2: The pressure applied to each reservoir controls the partition/spatial distribution of solutions inside the microfluidic chamber. (A) With equal pressure applied to the reservoirs, each solution occupies one-third of the chamber. (B) When changing a reservoir tube (here reservoir 3), the effective pressure drops down to zero, creating a backward flow. (C,D) Increasing the relative pressure on one of the reservoirs allows exposure of the glass surface to a single solution. The field of view in the middle of the chamber can be sequentially exposed to solutions 1 and 2 by alternating between configuration Mid Flow 1 (C) and Mid Flow 2 (D). Please click here to view a larger version of this figure.
7. Changing solution 'x'
NOTE: As shown in Figure 3A-C, it is important to keep in mind that solutions take minutes to flow from a reservoir tube to the main channel of the chamber. This minimal 'dead' time is imposed by the liquid volume contained in the tubing and the flow profile within the tubing (Figure 3A-C).
- Prepare 200-300 µL of solution in a new reservoir tube. Set pressure to Change setting (see section 6).
- Unscrew the reservoir tube of inlet 'x'. The solution in the tubing will slowly flow backwards, from the chamber to the free tubing tip. The measured flow rate becomes negative (Figure 2B).
- Once a tiny droplet has formed at the tubing tip, screw in the new tube with the fresh solution. Once the tube is correctly tightened to the pressure system, the flow rate of the inlet returns to positive.
- Set the pressure setting to High Flow 'x'.
- Depending on the microfluidic configuration and chamber geometry, wait for 3-5 min for the solution to fully fill in the tubing and reach the chamber.
- [OPTIONAL] Follow this process by measuring the increase in fluorescence over time (Figure 3C).

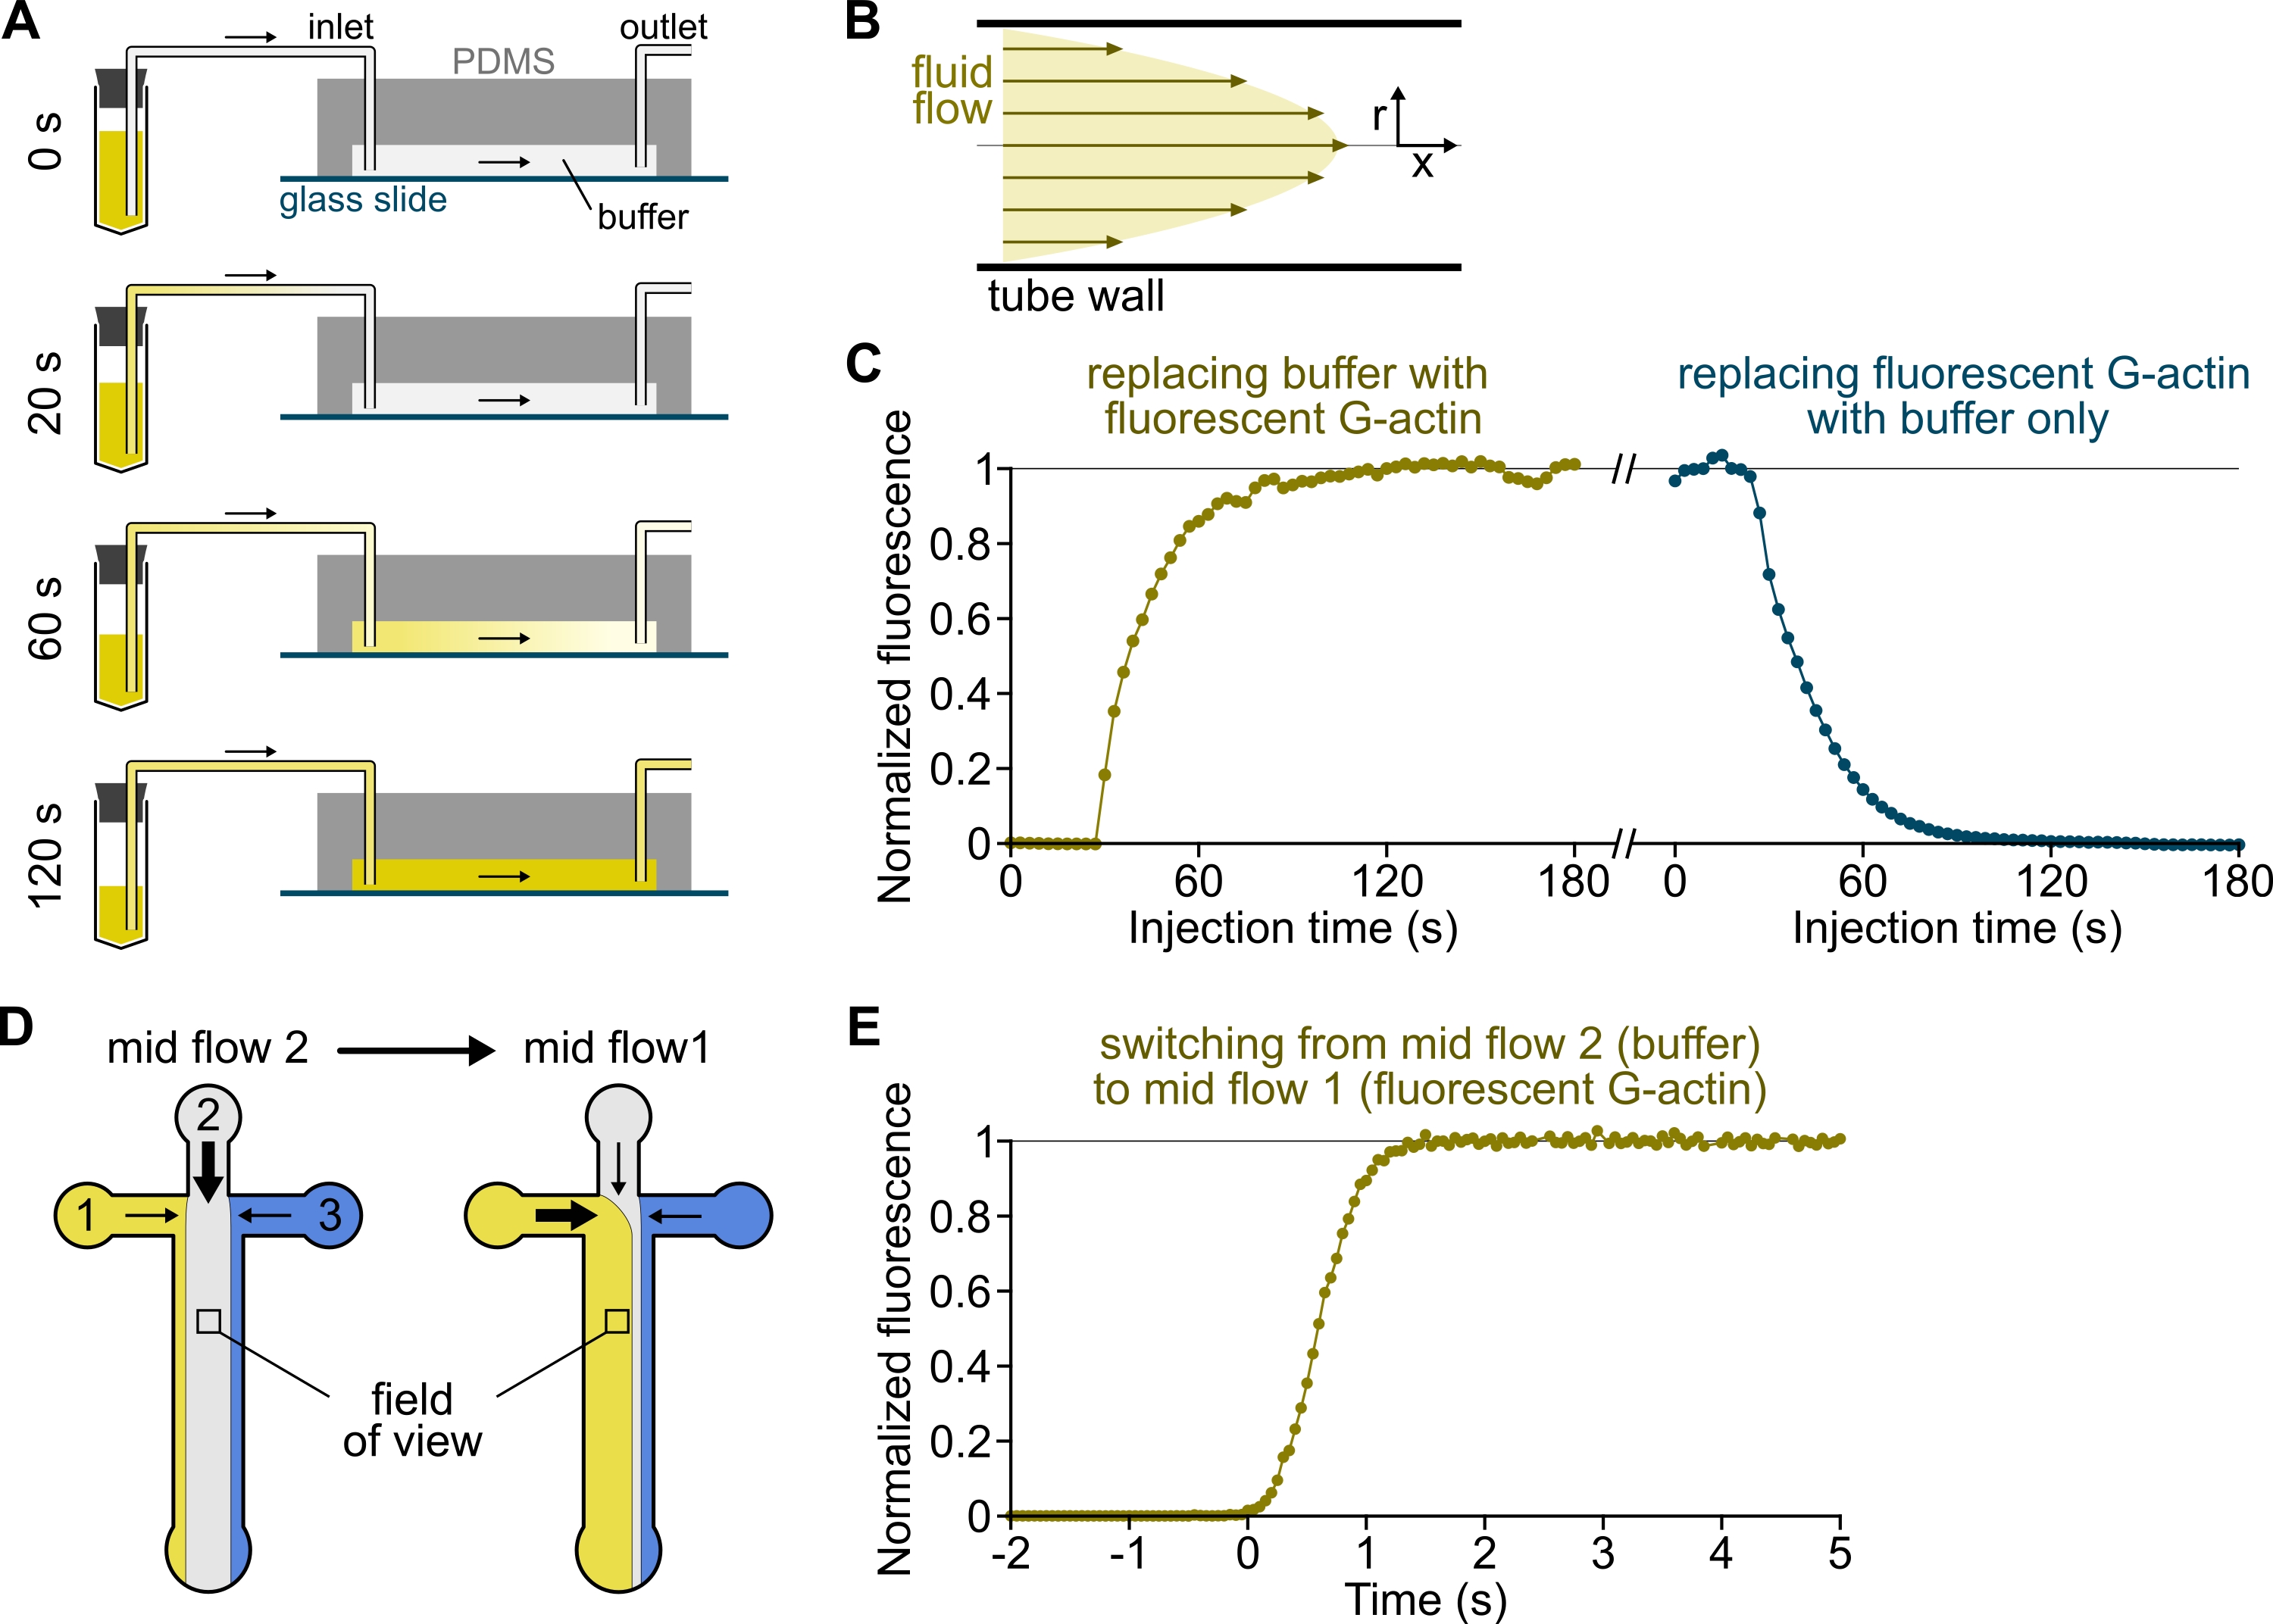
Figure 3: Delayed arrival of solutions from the reservoirs to the PDMS chamber and rapid change of biochemical conditions. (A-C) Delayed arrival of solutions from the reservoirs to the PDMS chamber. (A) Depending on the chamber geometry, the tube length, and the applied pressure at the inlet(s), the replacement of one solution by another is not instantaneous. After changing the reservoir tube to one containing a fluorescent solution (0 min), the solution progressively fills in the tubing (0.4 min) and the PDMS chamber (1-2 min). Indicative timing is given for a 150 mbar applied pressure, 80 cm PEEK tubing, and a 1600 µm wide, 20 µm high PDMS chamber. (B) The parabolic flow profile inside the PEEK tubing generates an effective gradient of fluorescence along the tubing radial profile and inside the chamber (see also Figure 1B). (C) Delayed arrival of solutions can be quantified by measuring the background epifluorescence signal in the chamber as a function of time. Experimental conditions: 0.5 µM 10% Alexa-568-labeled G-actin is injected with 150 mbar through a flow meter and 80 cm PEEK tubing. (D,E) Rapid change of biochemical conditions. (D) Pattern of incoming solutions in two Mid Flow conditions. (E) Increase in background fluorescence as a readout of actin concentration. Time t = 0 is set as the onset of fluorescence increase. Solution 1: 0.5 µM 10% Alexa-488-labeled G-actin, solution 2: F-buffer. (C,E) PDMS chamber: 20 µm high and 1600 µm wide. The epifluorescence intensity, ~2 µm above the surface, was quantified by averaging the signal over the full field of view, normalized to 0 in the absence of fluorophore and 1 at maximum intensity. Please click here to view a larger version of this figure.
8. Basic single filament experiment: Adenosine diphosphate (ADP)-actin barbed end depolymerization
NOTE: This section assumes a non-functionalized chamber (section 5 only). If the chamber has been directly functionalized (section 4), start at step 8.4.
- Surface functionalization with actin filament seeds:
- Change solution 3 to 200 µL of 50 pM spectrin-actin seeds11 in F-buffer (see section 7).
NOTE: Alternatively, if spectrin-actin seeds are not available, one can use biotin-functionalized short filament segments that will be immobilized on a streptavidin-coated coverslip (refer to9,10 for details). - Inject for 2 min with High Flow 3.
NOTE: Adjust the concentration and time depending on the final seed density.
- Change solution 3 to 200 µL of 50 pM spectrin-actin seeds11 in F-buffer (see section 7).
- Surface passivation:
- Change tube 3 with 300 µL of 5% BSA in F-buffer.
- Inject for 5 min at High Flow 3, followed by 5 min at Mid Flow 3. During this second step, reduce pressure in channels 1 and 2 to 7-8 mbar to get a counter flow ~-100 nL/min, so that the entire chamber surfaces are BSA passivated.
NOTE: Since the BSA solution is more viscous, the pressures need to be adjusted accordingly.
- Change tube 3 to F-buffer and rinse the channel (5 min, High Flow 3).
- Prepare the following 200-300 µL solutions, all proteins being diluted in F-buffer:
Inlet 1, polymerization solution: 1 µM 10% Alexa-488 labeled G-actin, 1 µM profilin (Table 1).
Inlet 2, aging solution: 0.15 µM 10% Alexa-488 labeled G-actin.
Inlet 3, depolymerization solution: F-buffer only.
NOTE: Profilin is used here to prevent spontaneous nucleation and to maintain a constant concentration of G-actin. - Change tubes 1 to 3 (section 7). Inject using the High Flow All preset for 3-4 min. The three solutions have now filled the PEEK tubing and reached the chamber (Figure 3A). The glass surface can be exposed to any inlet solution without deadtime (<1 s, Figure 3D,E).
- Switch on the microscope. Set the settings: 150 mW 488 nm excitation laser at 10%-20% power, 100-200 ms camera exposure time, 200-300 nm TIRF penetration depth, 60x objective. These settings are used throughout the manuscript.
- Filament polymerization (Figure 4A):
- Set the pressure setting to Mid Flow 1 for ~10 min.
- [OPTIONAL] Record polymerization (1 frame/20 s, TIRF). Filaments should polymerize at around 10 subunits/second (sub/s)1,12.
- Filament aging: Set the pressure setting to Mid Flow 2 for 15 min. At the critical concentration, 0.15 µM G-actin, filament length will remain constant, and filaments will turn to >99% ADP-F-actin4.
- Depolymerization (Figure 4A):
- Start acquisition at 1 frame/5 s, in epifluorescence mode. As there is a very low fluorescence background in channels 2 and 3, it is not necessary to use TIRF.
- After one to two frames, switch to Mid Flow 3. Filaments should depolymerize at around 10 sub/s (reference12).
- To reset the experiment, break all fluorescently labeled filaments by continuously exposing them to the laser at maximum power for ~2 min. To test different conditions, change solutions 1, 2, or 3 and inject them (High Flow, 3-4 min). Repeat steps 8.7-8.9.
9. Other single-filament experiments
- Testing the interactions of ABPs with F-actin
NOTE: Microfluidics has been successfully used to quantify the activity of several side-binding ABPs, such as cofilin, tropomyosin, and Arp2/3. Following the protocol in section 8:- Change channel 3 to the fluorescent ABP of interest in F-buffer. Inject (High Flow 3, 3 min).
- Filament polymerization: Set the pressure setting to Mid Flow 1 for 10 min.
- ABP binding: Start acquisition with TIRF. Adjust frame rate depending on the ABP concentration. After 1-2 frames, switch to Mid Flow 3.
NOTE: Depending on the ABP, it can also be possible to rapidly (e.g., for less than 5 s) switch to Mid Flow 2 to further reduce the background fluorescence when taking an image. - ABP unbinding: While continuing the acquisition, switch to Mid Flow 2.
- Polymerization with formin at the free barbed end
NOTE: Formins have been shown to affect filament barbed end polymerization. Microfluidics is particularly adapted to measure formin binding and unbinding rates and their impact on filament elongation.- Prepare the following solutions:
Channel 1: 10 nM formin in F-buffer (Table 1).
Channel 2: 1 µM 10% Alexa-488 labeled G-actin, 4 µM profilin.
Channel 3: F-buffer. - Change tubes 1, 2, and 3 (section 7). Inject using the High Flow All preset for 3-4 min.
- Initiate filament polymerization: Set the pressure setting to Mid Flow 2 for 2 min.
- Formin binding to filament barbed end: Set the pressure settings to Mid Flow 1 for 30 s.
- Formin-mediated polymerization: Set the pressure setting to Mid Flow 2. With formin mDia1 at their barbed end, filaments should polymerize at around 50 sub/s13,14,15.
- Prepare the following solutions:
- Polymerization/depolymerization from surface-anchored formin
NOTE: The polymerization and depolymerization rates of formin-decorated barbed ends have been shown to depend on the tension applied to the filament. In microfluidics, the friction of the fluid flow along the filament side generates a tension proportional to the filament length and to the flow rate14,16.- Use the method in section 8 described above, replacing steps 8.1, 8.2, and 8.3 for surface passivation with:
- Change tube 3 to 1 µg/mL anti-His antibody in F-buffer. Inject for 2 min with High Flow 3.
- Change tube 3 with 5% BSA in F-buffer. Inject for 5 min at High Flow 3, followed by 5 min at Mid Flow 3. During this second step, reduce pressure in channels 1 and 2 to 7-8 mbar to get a counter flow ~-100 nL/min so that the entire chamber surfaces are BSA passivated.
- Change tube 3 to 100 nM His-tagged formin in F-buffer. Inject for 5 min with High Flow 3. Change tube 3 with F-buffer. Inject for 5 min with High Flow 3 to ensure that no formins remain in the tubing.
- Prepare and inject the following solutions (200-300 µL each, in F-buffer):
Channel 1: 1 µM 10% Alexa-488 labeled G-actin.
Channel 2: 1 µM unlabeled G-actin, 4 µM profilin.
Channel 3: F-buffer only. - Filament nucleation: Expose the surface-anchored formins to G-actin (setting Mid Flow 1).
- Filament polymerization: Expose the chamber to profilin-actin using Mid Flow 2.
- Start acquisition: 1 frame/2 s, epifluorescence. With formin mDia1, filaments should polymerize at 50-80 sub/s, depending on the filament length and the flow rate14.
- Filament depolymerization: Start acquisition (1 frame/4 s, epifluorescence). After 1-2 frames, expose the filaments to F-buffer, Mid Flow 3. With formin mDia1, filaments should depolymerize at 5-15 sub/s, depending on the filament length and flow rate14.
- Use the method in section 8 described above, replacing steps 8.1, 8.2, and 8.3 for surface passivation with:
- Actin filaments with unlabeled segments
NOTE: Actin fluorescent labeling creates several artifacts, such as pauses during depolymerization17 and altered tropomyosin binding18. A workaround for these artifacts is to use microfluidics to assemble filaments displaying unlabeled segments.- Prepare and inject the following solutions (200-300 µL in F-buffer):
Channel 1: 1 µM unlabeled G-actin, 1 µM profilin.
Channel 2: 0.3 µM 10% Alexa-488 labeled G-actin. - Sequentially expose the surface to channel 2 (5 min), channel 1 (10 min), and channel 2 (15 min) to generate ADP-actin unlabeled segments with fluorescently labeled segments at each end.
- Prepare and inject the following solutions (200-300 µL in F-buffer):
- Barbed end-anchored filaments with gelsolin
NOTE: With spectrin-actin seeds, filaments polymerize at their free barbed end while the pointed end is stabilized by the spectrin-actin seed. An alternative is to anchor filaments with a barbed end capper such as gelsolin.- Prepare a F-actin solution of 4 µM 10% Alexa-488 labeled G-actin in 20 µL of F-buffer. Let the actin spontaneously nucleate and polymerize at RT for at least 30 min on the bench. Wrap the tube in aluminum foil to protect it from light.
- Meanwhile, prepare the microfluidic chamber and passivate the surface with a mixture of 5% BSA and 1% biotin-BSA (see step 8.2).
- Rinse channel 3 with F-buffer (2 min at High Flow 3). Inject 10 µg/mL neutravidin in F-buffer (4 min at High Flow 3).
- Change tubes to:
Channel 1: 10 nM biotin-gelsolin (Table 1).
Channel 2: F-buffer.
Channel 3: 0.4 µM prepolymerized F-actin. - Inject all solutions together using the High Flow All setting for 3 min.
- Expose the entire chamber to gelsolin (Mid Flow 1, 30 s).
- Attach filaments to the surface (Low Flow 3: Channel 3 at 3 mbar, Channels 1 and 2 at ~2 mbar, for about 2 min).
- [OPTIONAL] If the filament density is too low, repeat step 9.5.6 and 9.5.7.
- Pointed end depolymerization: Start acquisition (1 frame/30 s, epifluorescence). After 1-2 frames, expose filaments to buffer only, Mid Flow 2. Filaments should depolymerize at around 0.2 sub/s.
10. Fascin-induced filament bundle formation and disassembly by ADF/cofilin
NOTE: To form actin filament bundles, make sure to have a sufficiently high filament seed density at the surface of the chamber. When exposed to fascin protein, neighboring filaments that fluctuate laterally will be dynamically cross-linked by fascin proteins. As fascin quickly unbinds from the filament side19, fascin has to be constantly present in the main flowing solution in order to maintain filament bundling.
- Follow steps 8.1-8.3.
- Prepare the following solutions (200-300 µL in F-buffer):
Channel 1, polymerization solution: 1 µM 10% Alexa-488 labeled G-actin, 1 µM profilin.
Channel 2, Bundling solution: 200 nM fascin (Table 1), 0.15 µM 10% Alexa-488 labeled G-actin.
Channel 3, Disassembly solution: 200 nM ADF/cofilin (Table 1), 100 nM fascin, 0.15 µM 10% Alexa-488 labeled G-actin. - Change tubes 1 to 3 (section 7). Inject using the High Flow All preset, for 3-4 min.
- Filament polymerization: Set the pressure setting to Mid Flow 1 for ~10 min. Polymerization can be imaged with TIRF.
- Filament bundling (Figure 4C): Start image acquisition (1 frame/5 s, epifluorescence). After 1-2 frames, set the pressure setting to Mid Flow 2 and observe filament bundling.
- Bundle fragmentation: Start image acquisition (1 frame/5 s, epifluorescence). After 1-2 frames, set the pressure setting to Mid Flow 3 and observe the cofilin-induced disassembly of both single filaments and bundles.
11. Microfluidic device cleaning procedure
NOTE: To avoid any contamination from one experiment to another, it is critical to extensively clean and completely dry all the tubings and flow meters after each experiment.
- Disconnect all tubings from the PDMS chamber and discard the chamber.
- To clean PEEK tubing and flow meters, tape the tubing ends in an empty 15 mL plastic tube and inject the following solutions at maximum pressure until the reservoir is almost empty:
400 µL of F-buffer.
400 µL of 0.5 M NaOH.
400 µL of pure water.
200 µL of isopropanol. - Replace with an empty reservoir and blow air until the tubings are fully dry (~2-4 min, maximum pressure).
12. Image analysis
NOTE: While this manuscript focuses on the method to assemble, manipulate, and visualize single actin filaments in microfluidics, a brief method to analyze acquired movies is provided here. The analysis is performed on 16-bit images, using ImageJ, following section 8.
- Image treatment is minimal:
- Import the polymerization or depolymerization image stack.
- [OPTIONAL] Homogenize image intensity with function Subtract Background (default settings (i.e. 'Rolling ball radius' = 50 pixels)). This is particularly useful if the background fluorescence changes during the course of a movie or if fluorescence illumination is not homogeneous over the field of view.
- Adjust brightness and contrast (background near zero, filaments near maximum).
- Create filament kymograph:
- Select a filament that does not pause, break or detach. Do not select based on behavior otherwise. Draw a line 1-2 pixels above (Straight Line tool). Save the filament number (Add in ROI Manager).
- Apply the function Reslice (Slice count: 5 pixels). Calculate the maximum intensity (function Zprojection).
- Measure the polymerization/depolymerization rate:
- On the kymograph, draw a line along the filament barbed end (Straight Line tool, Figure 4A). Measure the line width and height (function Measure).
- Repeat steps 12.2-12.3 over multiple filaments. Calculate the polymerization/depolymerization rates (Figure 4A):
 , where v is the rate (in sub/s), w the line width (pixels), pix the pixel size (nm), h the line height (frames), and dt the time between frames (in second). Here, 2.7 nm corresponds to the effective contribution of an actin subunit to the filament length.
Wyniki
For all the experiments described above, fluorescently labeled actin filaments should be clearly visible, with good contrast, indicative of low background fluorescence from the surface (Figure 4, see Supplementary File 1 for troubleshooting of common issues). Actin filaments should also not stick to the surface: when the dominant flow rate is low, the actin filaments' lateral fluctuations should be perceptible when observing them live and allow one to clearly determine t...
Dyskusje
Compared to standard single-filament methods where actin filaments are anchored to the surface by multiple points along their length or maintained close to it by a crowding agent such as methylcellulose, microfluidics offers a number of advantages. As interactions with the surface are minimal, the artificial pauses these interactions can induce during both elongation and depolymerization are avoided. The filaments are aligned by the flow, parallel to each other, easing their monitoring and the measurement of their length...
Ujawnienia
The authors declare no conflicts of interest.
Podziękowania
We are grateful to the B. Ladoux and R.-M. Mège lab for the use of their UV-cleaner equipment, and J. Heuvingh and 0. du Roure for the initial training we received on preparing molds on silicon wafers and providing tips on microfluidics. We acknowledge funding from European Research Council Grant StG-679116 (to A.J.) and Agence Nationale de la Recherche Grants Muscactin and Conformin (to G.R.-L.).
Materiały
| Name | Company | Catalog Number | Comments |
| β-Casein | Merck | C6905 | Used at 8 mg/mL |
| Biopsy punch (with plunger) | Ted Pella | 15115-2 | ID 0.75 mm, OD 1.07 mm |
| Biotin-BSA | Merck | A8549 | Used at 1 mg/mL |
| BSA | Merck | A8022 | Used at 50 mg/mL |
| Coverslip Mini-Rack Teflon holder | Invitrogen | C14784 | for 8 coverslips |
| Coverslips 22x40mm Thickness #1.5 | Menzel Gläser | 631-1370 | |
| DABCO | Merck | D27802 | component in f-buffer |
| DTT | Euromedex | EU0006-D | component in f-buffer |
| Ester NHS Alexa Fluor 488 | Invitrogen | A20000 | Fluorophore for actin labeling on Lys328. |
| EZ-Link Sulfo-NHS-Biotin | Thermo Scientific | 21338 | To biotinylate actin on Lys328 |
| Hellmanex III | Hellma | 9-307-011-4-507 | Glass cleaning detergent |
| ImageJ | NIH | N/A | open source software |
| Laboport | KNF | 811kn.18 | vacuum pump (ultimate vacuum: 240 mbar) |
| Magic invisible tape | Scotch | 7100024666 | standard transparent office tape |
| Micrewtube | Simport | T341-6T | 2 mL microfluidic reservoir tubes |
| Microfluidic device Part 1: Flow Unit S | Fluigent | FLU-S-D-PCKB | Flowmeter |
| Microfluidic device Part 2: Fluiwell-4C-2 mL | Fluigent | 14002001PCK | Reservoir holder |
| Microfluidic device Part 3: MFCS-EZ | Fluigent | EZ-11000001 EZ-00345001 | Pressure controller |
| Model 42 - UVO-Cleaner | Jelight Inc. | 42-220 | Ultraviolet cleaner |
| N6-(6-Aminohexyl)-ATP-ATTO-488 | Jena Bioscience | NU-805-488 | ATP-ATTO used to label actin |
| neutravidin | Thermo Scientific | 31000 | |
| PLL-PEG | SuSoS | PLL(20)-g[3.5]- PEG(2) | Use at 1 mg/mL in PBS. |
| Polydimethylsiloxane (PDMS) Sylgard 184 Silicon Elastomer | Dow Corning | 1673921 | Contains PDMS base and curing agent |
| Polyetheretherketone (PEEK) tubing | Merck | Z226661 | “Blue” : I.D. = 0.25 mm |
| Safety blow gun | Coilhose Pneumatics | 700-S | filtered air |
| Silicon tubing | VWR | 228-0701P | connect PEEK to coupler |
| Stainless steel catheter coupler | Prime Bioscience | SC22/15 | Inserted into PDMS inlets and outlet to connect to PEEK tubing |
| Thermoplastic film | Sigma Aldrich | PM996 | Standard "parafilm" |
| Ultrapure ethanol | VWR | 64-17-5 | |
| Ultrasonic cleaning bath | VWR | USC200TH | To accomodate 1 L beakers |
| Vacuum dessicator | SP Bel-Art | F42022-0000 | to degas the PDMS or solutions |
Odniesienia
- Wioland, H., Jégou, A., Romet-Lemonne, G. Celebrating 20 years of live single-actin-filament studies with five golden rules. Proceedings of the National Academy of Sciences of the United States of America. 119 (3), 2109506119 (2022).
- Kuhn, J. R., Pollard, T. D. Real-time measurements of actin filament polymerization by total internal reflection fluorescence microscopy. Biophysical Journal. 88 (2), 1387-1402 (2005).
- Brewer, L. R., Bianco, P. R. Laminar flow cells for single-molecule studies of DNA-protein interactions. Nature Methods. 5 (6), 517-525 (2008).
- Jégou, A., et al. Individual actin filaments in a microfluidic flow reveal the mechanism of ATP hydrolysis and give insight into the properties of profilin. PLoS Biology. 9 (9), 1001161 (2011).
- Gicquel, Y., et al. Microfluidic chips for in situ crystal x-ray diffraction and in situ dynamic light scattering for serial crystallography. Journal of Visualized Experiments: JoVE. (134), e57133 (2018).
- Chandradoss, S. D., et al. Surface passivation for single-molecule protein studies. Journal of Visualized Experiments: JoVE. (86), e50549 (2014).
- Schaedel, L., et al. Microtubules self-repair in response to mechanical stress. Nature Materials. 14 (11), 1156-1163 (2015).
- Zimmermann, D., Morganthaler, A. N., Kovar, D. R., Suarez, C. In vitro biochemical characterization of cytokinesis actin-binding proteins. Methods in Molecular Biology. 1369, 151-179 (2016).
- Funk, J., et al. Profilin and formin constitute a pacemaker system for robust actin filament growth. eLife. 8, 50963 (2019).
- Pandit, N. G., et al. Force and phosphate release from Arp2/3 complex promote dissociation of actin filament branches. Proceedings of the National Academy of Sciences of the United States of America. 117 (24), 13519-13528 (2020).
- Wioland, H., et al. ADF/Cofilin accelerates actin dynamics by severing filaments and promoting their depolymerization at both ends. Current Biology: CB. 27 (13), 1956-1967 (2017).
- Pollard, T. D., Mooseker, M. S. Direct measurement of actin polymerization rate constants by electron microscopy of actin filaments nucleated by isolated microvillus cores. The Journal of Cell Biology. 88 (3), 654-659 (1981).
- Kovar, D. R., Harris, E. S., Mahaffy, R., Higgs, H. N., Pollard, T. D. Control of the assembly of ATP- and ADP-actin by formins and profilin. Cell. 124 (2), 423-435 (2006).
- Jégou, A., Carlier, M. -. F., Romet-Lemonne, G. Formin mDia1 senses and generates mechanical forces on actin filaments. Nature Communications. 4, 1883 (2013).
- Breitsprecher, D., et al. Rocket launcher mechanism of collaborative actin assembly defined by single-molecule imaging. Science. 336 (6085), 1164-1168 (2012).
- Courtemanche, N., Lee, J. Y., Pollard, T. D., Greene, E. C. Tension modulates actin filament polymerization mediated by formin and profilin. Proceedings of the National Academy of Sciences of the United States of America. 110 (24), 9752-9757 (2013).
- Niedermayer, T., et al. Intermittent depolymerization of actin filaments is caused by photo-induced dimerization of actin protomers. Proceedings of the National Academy of Sciences. 109 (27), 10769-10774 (2012).
- Gateva, G., et al. Tropomyosin isoforms specify functionally distinct actin filament populations in vitro. Current Biology: CB. 27 (5), 705-713 (2017).
- Aratyn, Y. S., Schaus, T. E., Taylor, E. W., Borisy, G. G. Intrinsic dynamic behavior of fascin in filopodia. Molecular Biology of the Cell. 18 (10), 3928-3940 (2007).
- Pollard, T. D. Rate constants for the reactions of ATP- and ADP-actin with the ends of actin filaments. The Journal of Cell Biology. 103, 2747-2754 (1986).
- Wioland, H., Jegou, A., Romet-Lemonne, G. Torsional stress generated by ADF/cofilin on cross-linked actin filaments boosts their severing. Proceedings of the National Academy of Sciences of the United States of America. 116 (7), 2595-2602 (2019).
- Colombo, J., et al. A functional family of fluorescent nucleotide analogues to investigate actin dynamics and energetics. Nature Communications. 12 (1), 548 (2021).
- Spudich, J. A., Watt, S. The regulation of rabbit skeletal muscle contraction. I. Biochemical studies of the interaction of the tropomyosin-troponin complex with actin and the proteolytic fragments of myosin. The Journal of Biological Chemistry. 246 (15), 4866-4871 (1971).
- Romet-Lemonne, G., Guichard, B., Jégou, A. Using microfluidics single filament assay to study formin control of actin assembly. Methods in Molecular Biology. 1805, 75-92 (2018).
- Gieselmann, R., Kwiatkowski, D. J., Janmey, P. A., Witke, W. Distinct biochemical characteristics of the two human profilin isoforms. European Journal of Biochemistry. 229 (3), 621-628 (1995).
- Lin, D. C., Lin, S. Actin polymerization induced by a motility-related high-affinity cytochalasin binding complex from human erythrocyte membrane. Proceedings of the National Academy of Sciences of the United States of America. 76 (5), 2345-2349 (1979).
- Casella, J. F., Maack, D. J., Lin, S. Purification and initial characterization of a protein from skeletal muscle that caps the barbed ends of actin filaments. The Journal of Biological Chemistry. 261 (23), 10915-10921 (1986).
- Kremneva, E., et al. Cofilin-2 controls actin filament length in muscle sarcomeres. Developmental Cell. 31 (2), 215-226 (2014).
- Le Clainche, C., Carlier, M. -. F. Actin-based motility assay. Current Protocols in Cell Biology. , 1-20 (2004).
- Vignjevic, D., et al. Formation of filopodia-like bundles in vitro from a dendritic network. The Journal of Cell Biology. 160 (6), 951-962 (2003).
- Duellberg, C., Cade, N. I., Holmes, D., Surrey, T. The size of the EB cap determines instantaneous microtubule stability. eLife. 5, 13470 (2016).
- Duellberg, C., Cade, N. I., Surrey, T. Microtubule aging probed by microfluidics-assisted tubulin washout. Molecular Biology of the Cell. 27 (22), 3563-3573 (2016).
- Suzuki, E. L., et al. Geometrical constraints greatly hinder formin mDia1 activity. Nano Letters. 20 (1), 22-32 (2020).
- Wioland, H., Suzuki, E., Cao, L., Romet-Lemonne, G., Jegou, A. The advantages of microfluidics to study actin biochemistry and biomechanics. Journal of Muscle Research and Cell Motility. 41 (1), 175-188 (2020).
Przedruki i uprawnienia
Zapytaj o uprawnienia na użycie tekstu lub obrazów z tego artykułu JoVE
Zapytaj o uprawnieniaThis article has been published
Video Coming Soon
Copyright © 2025 MyJoVE Corporation. Wszelkie prawa zastrzeżone