A subscription to JoVE is required to view this content. Sign in or start your free trial.
Method Article
Linearization of the Bradford Protein Assay
In This Article
Summary
The accuracy and sensitivity of protein determination by the rapid and convenient Bradford assay is compromised by intrinsic nonlinearity. We show a simple linearization procedure that greatly increases the accuracy, improves the sensitivity of the assay about 10-fold, and significantly reduces interference by detergents.
Abstract
Protocol
Linearization of the Bradford Protein Calibration Graph:
The Coomassie brilliant blue protein assay, commonly known as the Bradford assay 1, is widely used because of its rapid and convenient protocol as well as its relative sensitivity. Unfortunately, there is a large degree of curvature over a broad range of protein concentrations (Fig. 1). Therefore, only a narrow range of relatively high protein concentrations, 2-10 μg/ml BSA, is used for the calibration graph, which then better fits linear regression (Fig. 1, green). However, the nonlinearity requires protein concentration of the unknown samples to fall within the limited range of the calibration graph in order to avoid a large error, and it also reduces the accuracy within the limited range. The nonlinearity presents a serious problem in particular when microgram amounts of protein are not available, and it often requires multiple dilutions of the unknown samples.
As noted in the original Bradford paper, "the source of the nonlinearity is in the reagent itself since there is an overlap in the spectrum of the two different color forms of the dye." 1. In fact, three forms of the Coomassie brilliant blue dye are in acid-base equilibrium at the usual acidic pH of the assay 2. The red, blue, and green forms have absorbance maxima at 470, 590, and 650 nm, respectively (Fig. 2). The blue is the form that binds the protein, forming a complex that intensely absorbs light at 594 nm 3, 4 (Fig. 2). Bradford also noted that "the background value for the reagent is continually decreasing as more dye is bound to protein" 1 (Fig. 3). Therefore, we attempted to calculate the reduction of the 590 nm background as increasing protein quantities are added, by measuring the change of absorbance at 450 nm, where the protein-dye complex does not absorb. We found that the decreasing background partially, but not fully, accounts for the nonlinearity (Fig. 4).
We then hypothesized that the decrease in free dye concentration produces another distortion of the linear response, because as protein-dye binding is in equilibrium 5, complex formation depends not only on the concentration of the free protein, but also on that of the free dye (Fig. 5). Taking into account both issues related to the variable concentration of the free dye, we developed a mathematical equation that describes a linear relationship between protein concentration and the ratio of absorbance measurements, 590 nm over 450 nm (Fig. 6). A detailed description of the theoretical and experimental study can be found in our 1996 publication in Analytical Biochemistry 6. The mathematical equation was experimentally tested and found to yield a linear calibration curve over the entire protein concentrations range (Fig. 7). Furthermore, the equation was validated also by an independent determination of the correct pH-dependent value of the Y-axis intercept 6.
Detailed Protocol for the Improved Bradford Protein Assay, using a Microplate Absorbance Reader:
- Prepare a 0.1 mg/ml stock solution of the standard, bovine serum albumin. Any other standard may be chosen, but note that the same standard must be used in all experiments.
- Dilute the unknown samples in deionized water. Aim to 5-50 μg/ml. Yet, higher or lower protein concentrations are acceptable, since there is no apparent limit for the linear range of the assay. However, the measurement must be within the linear range of the absorbance reader.
- Dilute the Bradford reagent (Bio-Rad) 2.5-fold in deionized water.
- Add 0 and 10-50 μl of BSA stock solution to triplicate wells (creating a 0-5 μg BSA calibration curve). Complement with deionized water to reach 100 μl/well.
- In different wells, add 100 μl of unknown sample in triplicates. Several concentrations of the unknown sample may be used to increase accuracy.
- Add 100 μl of the diluted Bradford reagent to all wells. Total volume is 200 μl/well.
- Wait at least 5 min, but not more than 60 min for color development.
- The Blank must be 200 μl of deionized water (and not the zero protein dye well).
- Measure the absorbance at 590 nm and at 450 nm.
- Prepare a calibration graph by dividing the net absorbance values at 590 nm and at 450 nm. Note that the zero protein (dye only) value should be included as a data point (Fig. 8).
- Calculate the concentration of the unknown sample based on the linear equation of the calibration curve (Fig. 9).
Representative Results:
Unlike the absorbance at a single wavelength of 590 nm, the ratio of absorbance values, 590 nm over 450 nm, is linear with protein concentration (Fig. 10).
The protein concentration of the unknown sample may be simply calculated using the linear equation of the calibration curve (Fig. 10, equation).
However, increased accuracy is obtained by measuring several unknown sample dilutions. To this end, prepare two graphs. The first is a calibration graph for the standard with μg protein on the X axis (Fig. 11, right). The second graph is for the unknown sample, with μl of the original undiluted sample on the X axis (Fig. 11, left). The dye only value should be included in both graphs (Fig. 11). The protein concentration of the unknown sample is derived by dividing the slopes of the unknown sample and the standard (Fig. 11, equation).
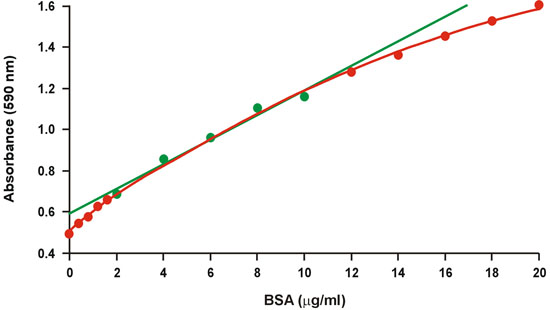
Figure 1. Conventional Bradford calibration graph. The linear range is represented by green symbols.

Figure 2. Spectra of the protein-dye complex and of the dye alone.

Figure 3. Protein-dye equilibrium.
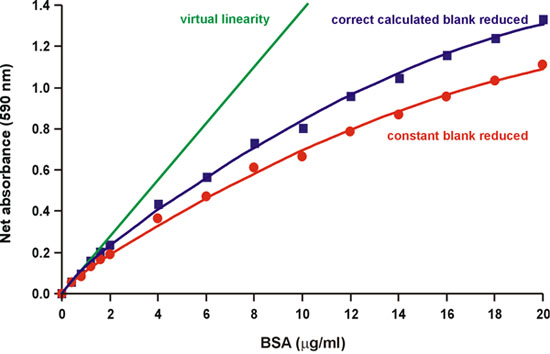
Figure 4. Reduction of the correct calculated background partially decreases nonlinearity.
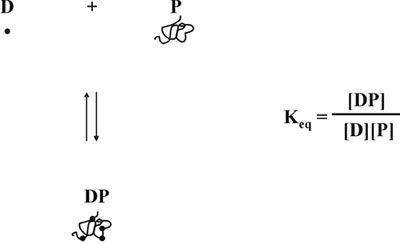
Figure 5. Protein-dye equilibrium.

Figure 6. Mathematical basis for the linearization of the Bradford protein assay.
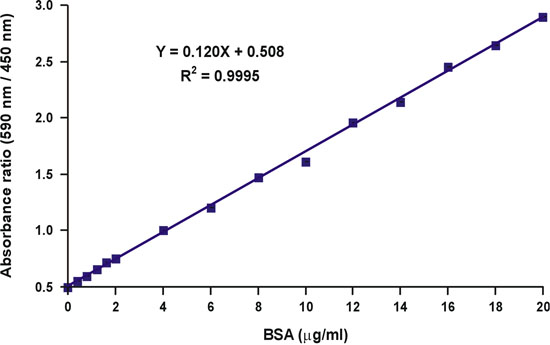
Figure 7. Linearization of the Bradford calibration graph.

Figure 8. Calculation of the absorbance ratio values.

Figure 9. A linear Bradford calibration graph.

Figure 10. Linearization of the Bradford calibration graph.
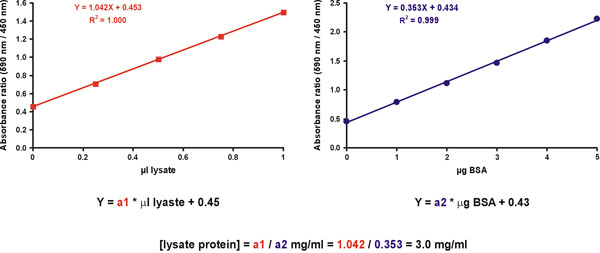
Figure 11. Unknown sample- concentration calculation.
Discussion
The Bradford protein assay is popular due to its ease of performance and relative sensitivity. The linearization over the entire protein concentrations range obtained by the protocol presented here further simplifies the assay, as the unknown samples do not need to fall within the range of the calibration graph.
Importantly, the improved protocol further provides the following advantages over the original Bradford protocol:
- Increased accuracy.
- The sensitivity is incre...
Acknowledgements
This paper is dedicated to the memory of the late Dr. Zvi Selinger, who hosted the original research described here.
Materials
| Material Name | Type | Company | Catalogue Number | Comment |
|---|---|---|---|---|
| Name | Company | Catalog Number | Comments | |
| Bradford reagent | Bio-Rad Laboratories | 500-0006 | ||
| Bovine Serum Albumin | Amersco | 0332 | ||
| Multiplate absorbance reader | BioTek | Synergy2 |
References
- Bradford, M. M. A rapid and sensitive method for the quantitation of microgram quantities of protein utilizing the principle of protein-dye binding. Anal Biochem. 72, 248-254 (1976).
- Chial, H. J., Thompson, H. B., Splittgerber, A. G. A spectral study of the charge forms of Coomassie blue G. Anal Biochem. 209, 258-266 (1993).
- Chial, H. J., Splittgerber, A. G. A comparison of the binding of Coomassie brilliant blue to proteins at low and neutral pH. Anal Biochem. 213, 362-369 (1993).
- Compton, S. J., Jones, C. G. Mechanism of dye response and interference in the Bradford protein assay. Anal Biochem. 151, 369-374 (1985).
- Congdon, R. W., Muth, G. W., Splittgerber, A. G. The binding interaction of Coomassie blue with proteins. Anal Biochem. 213, 407-413 (1993).
- Zor, T., Selinger, Z. Linearization of the Bradford protein assay increases its sensitivity: theoretical and experimental studies. Anal Biochem. 236, 302-308 (1996).
Reprints and Permissions
Request permission to reuse the text or figures of this JoVE article
Request PermissionThis article has been published
Video Coming Soon
Copyright © 2025 MyJoVE Corporation. All rights reserved