A subscription to JoVE is required to view this content. Sign in or start your free trial.
Method Article
Determination of Lipid Raft Partitioning of Fluorescently-tagged Probes in Living Cells by Fluorescence Correlation Spectroscopy (FCS)
In This Article
Summary
A technique to probe the lipid raft partitioning of fluorescent proteins at the plasma membrane of living cells is described. It takes advantage of the disparity in diffusion times of proteins located inside or outside of lipid rafts. Acquisition can be performed dynamically in control conditions or after drug addition.
Abstract
In the past fifteen years the notion that cell membranes are not homogenous and rely on microdomains to exert their functions has become widely accepted. Lipid rafts are membrane microdomains enriched in cholesterol and sphingolipids. They play a role in cellular physiological processes such as signalling, and trafficking1,2 but are also thought to be key players in several diseases including viral or bacterial infections and neurodegenerative diseases3.
Yet their existence is still a matter of controversy4,5. Indeed, lipid raft size has been estimated to be around 20 nm6, far under the resolution limit of conventional microscopy (around 200 nm), thus precluding their direct imaging. Up to now, the main techniques used to assess the partition of proteins of interest inside lipid rafts were Detergent Resistant Membranes (DRMs) isolation and co-patching with antibodies. Though widely used because of their rather easy implementation, these techniques were prone to artefacts and thus criticized7,8. Technical improvements were therefore necessary to overcome these artefacts and to be able to probe lipid rafts partition in living cells.
Here we present a method for the sensitive analysis of lipid rafts partition of fluorescently-tagged proteins or lipids in the plasma membrane of living cells. This method, termed Fluorescence Correlation Spectroscopy (FCS), relies on the disparity in diffusion times of fluorescent probes located inside or outside of lipid rafts. In fact, as evidenced in both artificial membranes and cell cultures, probes would diffuse much faster outside than inside dense lipid rafts9,10. To determine diffusion times, minute fluorescence fluctuations are measured as a function of time in a focal volume (approximately 1 femtoliter), located at the plasma membrane of cells with a confocal microscope (Fig. 1). The auto-correlation curves can then be drawn from these fluctuations and fitted with appropriate mathematical diffusion models11.
FCS can be used to determine the lipid raft partitioning of various probes, as long as they are fluorescently tagged. Fluorescent tagging can be achieved by expression of fluorescent fusion proteins or by binding of fluorescent ligands. Moreover, FCS can be used not only in artificial membranes and cell lines but also in primary cultures, as described recently12. It can also be used to follow the dynamics of lipid raft partitioning after drug addition or membrane lipid composition change12.
Protocol
1. Calibration of the FCS Setup
- Start the confocal microscope, lasers, computers, incubator for temperature and CO2 control.
- Make sure the SPAD (Single Photon Avalanche Diode) is on and the fluorescence filter inside the SPAD is well suited to your sample. Check that the SPAD is synchronized in time. Beware to only start your FCS software once your SPAD settings are ready for acquisition.
- Prepare a fresh solution of cholera toxin-Alexa488 diluted in PBS to reach a concentration of 1 μg/ml (17.5 nM).
- Optimize confocal imaging of the solution using internal detection of the microscope.
- Switch to point scanning mode and choose a point in the solution sample. Make sure the duration of the laser illumination is long enough to perform your FCS acquisitions (> 5 minutes).
- Switch to external detection by the SPAD and to the FCS software. Monitor your fluorescence signal and make sure it is well suited to the SPAD (enough signal but no saturation, 10 000 to 50 000 counts/s is fine). If necessary, modify z position, gain and/or laser power to achieve correct fluorescence signal.
- Acquire 10 sets of 30 seconds measurements. Acquisition time should be optimized for your sample (compromise between the best sampling and photobleaching problems).
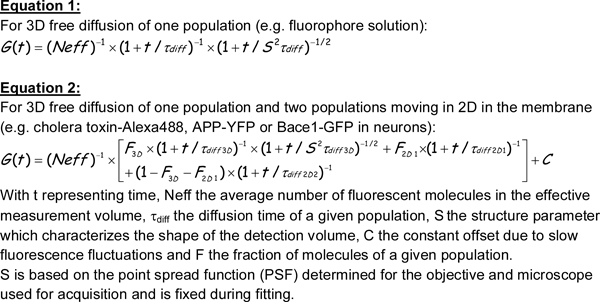
- Analyze your data (see step 4) to ensure that you have an auto-correlation curve corresponding to one fluorescent species diffusing in solution (equation in Fig. 2) and that the diffusion time obtained after fitting is correct (approximately 0.2 ms) (Fig. 3).
2. Staining of Living Cells with Lipid Rafts Marker
- Plate HEK293 cells on 8-well Labteks coated with poly-L-lysine (1mg/ml) the day before imaging to make sure that their adhesion is correct. Use medium without phenol red to ensure there is no perturbation of the fluorescence signal.
- Wash cells twice with HBSS (Hank's Buffered Salt Solution).
- Add cholera toxin-Alexa488 (1 μg/ml)/BSA (0,1 %) in 500 μl HBSS to the cells for 30 minutes at 37 °C. Cholera toxin will bind to ganglioside GM1, known to be preferentially partitioned in lipid rafts.
- Wash cells twice with HBSS (Hank's Buffered Salt Solution).
3. FCS Data Acquisition on Living Cells
- Place the stained cells on the microscope stage. Make sure temperature and CO2 conditions are optimal otherwise this may lead to artefacts in diffusion times.
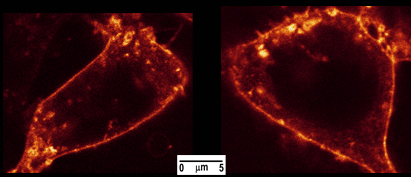
- Optimize confocal imaging of a cell of interest using internal detection of the microscope (Fig. 4).
- Switch to point scanning mode and choose a point in the plasma membrane of the cell of interest. Perform 1-2 live images of the cell to make sure the cell is not moving during acquisition.
- Switch to external detection by the SPAD and to the FCS software. Monitor your fluorescence signal and make sure it is well suited to the SPAD (enough signal but no saturation, 10 000 to 50 000 counts/s is fine). If necessary, modify z position, gain and/or laser power to achieve correct fluorescence signal. If this is not enough, you may consider changing staining conditions.
- Acquire 10 samples of 30 seconds measurements. As most cells are auto-fluorescent, you may see a decrease in fluorescence during the first acquisitions, due to auto-fluorescence fading.
4. FCS Data Analysis
- Set the correlation interval and generate auto-correlation curves with the FCS software. The correlation interval will typically range from the shortest resolvable lag time up to the longest time possible (as the statistics of the measurement becomes more and more inadequate when maximum correlation time approaches total acquisition time, the maximum lag time is limited to 80% of the acquisition time on the Picoquant software).
- For each sample, export files corresponding to fluorescence fluctuations and auto-correlation as a function of time.
- Use a data analysis and fitting software such as Origin Pro to import the files.
- For each sample, make sure there is no photobleaching during acquisition ie the fluorescence stays stable during the 30 seconds. Discard any measure displaying photobleaching as this may cause artificial longer diffusion times.
- Check that the shape of the remaining FCS curves is correct (see Fig 5). Determine the mean FCS curve.
- Fit the curve with the appropriate mathematical model (Fig. 2). This fit will give you the diffusion time(s) and the proportion of molecules diffusing with this (ese) diffusion time(s).
5. Representative Results
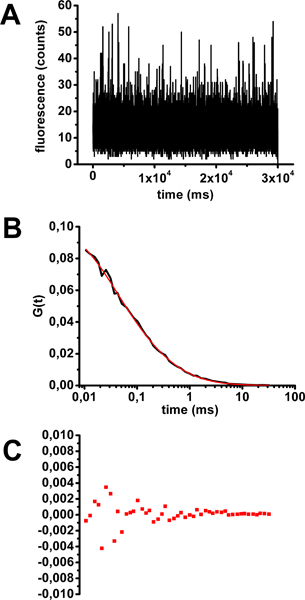
An example of an FCS calibration with a cholera toxin-Alexa488 solution is shown in Figure 3. After checking that individual measures of fluorescence as a function of time did not show any photobleaching (Figure 3A), individual and mean FCS curves were calculated. Mean FCS curves were fitted with equations corresponding to various diffusion models (examples in Figure 2). The parameter classically considered to determine the quality of a fit is the coefficient of determination R2. The closer R2 is to 1, the better the fit. In this case, the most accurate model to fit the mean FCS curve is the one describing a population of fluorescent molecules diffusing freely in three dimensions (equation 1 in Figure 2 and Figure 3B). The diffusion time derived from the fit is 0.32 ms. Residuals from curve-fitting (Figure 3C) and R2 factor (0.99906) give an estimate of the quality of the fit.
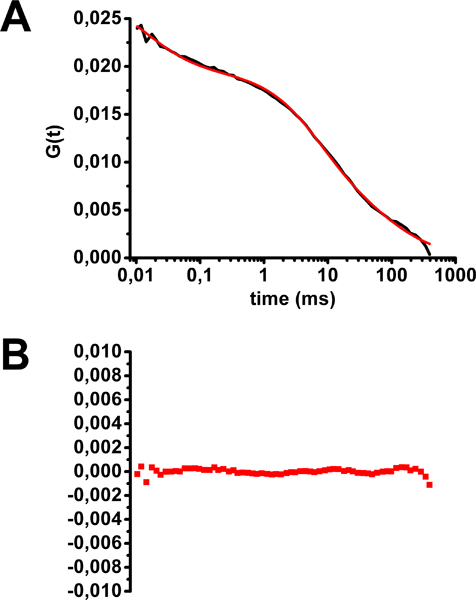
An example of FCS analysis for cholera toxin-Alexa488 stained HEK293 cells is shown in Figure 5. The multiphasic mean FCS curve shape reveals the existence of populations of fluorescent molecules with different diffusion times. The best fit for this curve corresponds to a model with three populations of fluorescent probes: two with an hindered diffusion (diffusion in two dimensions as in the membrane plane) and one freely diffusing in three dimensions (equation 2 in Figure 2 and Figure 5). This latter population corresponds to fluorescent molecules moving outside of the membrane plane, i.e., either binding or unbinding to their membrane targets, reaching the membrane through the secretion or recycling pathway, or leaving the membrane by endocytosis. The two diffusion times at the membrane, corresponding to cholera toxin bound to GM1, were 2 ms (25% of molecules), corresponding to diffusion outside of lipid rafts, and 75 ms (50% of molecules), corresponding to diffusion in lipid rafts. Please note that any photobleaching during acquisition will lead to artificial longer diffusion times thus possibly creating a bias towards localization of GM1 in lipid raft domains.

Figure 1. Schematic representation of the FCS set-up (picture modified from Marquer et al.12)

Figure 2. Example of diffusion models and corresponding equations used to fit autocorrelation curves. The structure parameter S can be written as S = z0/w0 with z0 the effective focal radius along the optical axis at 1/e2 intensity and w0 the effective lateral focal radius at 1/e2 intensity. These values can be extracted from a classical point spread function (PSF) measurement.

Figure 3. Assessment of diffusion time of cholera toxin-Alexa488 in solution for FCS calibration. A) Fluorescence fluctuation as a function of time for a representative example of a 30 seconds acquisition. B) Mean autocorrelation curve obtained from 10 samples of 30 seconds acquisition fitted with equation 1 (see Figure 2).C) Residuals from curve fitting.

Figure 4. HEK-293 cell stained with cholera toxin-Alexa488. Cells were imaged on an SP5 confocal microscope (Leica Microsystems, Wetzlar, Germany) with the internal 488nm laser line. Fluorescence was collected with a x60 plan apochromat oil immersion objective between 500 and 650 nm.

Figure 5. Assessment of diffusion time of cholera toxin-Alexa488 at the plasma membrane of HEK293 cells. A) Mean autocorrelation curve fitted with equation 2 (see Figure 2). B) Residuals from curve fitting. (modified from Marquer et al.12)
Discussion
The FCS method presented here enables a sensitive and rapid analysis of the lipid raft partitioning of fluorescent probes of interest in living cells. FCS combines the accuracy of localization of confocal microscopy with the sensitivity of single photon counting. The main difference between FCS and standard biochemical techniques is that FCS enables the absolute determination of the lipid rafts partition of the target and not the relative partition as is the case for DRMs isolation or co-patching.
Disclosures
No conflicts of interest declared.
Acknowledgements
This work was supported by a grant from Agence Nationale de la Recherche (ChoAD). We are also grateful to the Fondation ICM (Institut du Cerveau et de la Moelle) for their financial support.
Materials
| Name | Company | Catalog Number | Comments |
| Cholera toxin subunit B-Alexa 488 | Invitrogen | C-34775 | MW (pentamer) = 57 kg/mol |
| Confocal microscope | Leica Microsystems | SP5 | |
| Incubator for temperature and CO2 control | Life imaging services | The Cube and the Box | |
| SPAD (Single Photon Avalanche Diode) | MPD (Micro Photon Devices) | PDM serie (100 µm sensitive area) | |
| High pass 488 nm filter | Semrock | 488 nm blocking edge BrightLine long-pass filter Part # FF01-488/LP-25 | |
| FCS detection unit | Picoquant | Picoharp 300 module | |
| Acquisition and auto-correlation software | Picoquant | SymPhoTime | |
| Fitting software | OriginLab | OriginPro8 |
References
- Brown, D. A., London, E. Functions of lipid rafts in biological membranes. Annu. Rev. Cell Dev. Biol. 14, 111-136 (1998).
- Simons, K., Gerl, M. J. Revitalizing membrane rafts: new tools and insights. Nat. Rev. Mol. Cell Biol. 11, 688-699 (2010).
- Simons, K., Ehehalt, R. Cholesterol, lipid rafts, and disease. J. Clin. Invest. 110, 597-603 (2002).
- Munro, S. Lipid rafts: elusive or illusive. Cell. , 115-377 (2003).
- Shaw, A. S. Lipid rafts: now you see them, now you don't. Nat. Immunol. 7, 1139-1142 (2006).
- Pralle, A., Keller, P., Florin, E. L., Simons, K., Horber, J. K. Sphingolipid-cholesterol rafts diffuse as small entities in the plasma membrane of mammalian cells. J. Cell Biol. 148, 997-1008 (2000).
- Brown, D. A., London, E. Structure and function of sphingolipid- and cholesterol-rich membrane rafts. J. Biol Chem. 275, 17221-17224 (2000).
- Sharma, P., Sabharanjak, S., Mayor, S. Endocytosis of lipid rafts: an identity crisis. Semin. Cell Dev. Biol. 13, 205-214 (2002).
- Kahya, N., Scherfeld, D., Bacia, K., Poolman, B., Schwille, P. Probing lipid mobility of raft-exhibiting model membranes by fluorescence correlation spectroscopy. J. Biol. Chem. 278, 28109-28115 (2003).
- Bacia, K., Scherfeld, D., Kahya, N., Schwille, P. Fluorescence correlation spectroscopy relates rafts in model and native membranes. Biophys J. 87, 1034-1043 (2004).
- Kim, S. A., Heinze, K. G., Schwille, P. Fluorescence correlation spectroscopy in living cells. Nat. Methods. 4, 963-973 (2007).
- Marquer, C. Local cholesterol increase triggers amyloid precursor protein-Bace1 clustering in lipid rafts and rapid endocytosis. FASEB J. 25, 1295-1305 (2011).
- Tian, Y., Martinez, M. M., Pappas, D. Fluorescence correlation spectroscopy: a review of biochemical and microfluidic applications. Appl. Spectrosc. 65, 115A-124A (2011).
- Haustein, E., Schwille, P. Fluorescence correlation spectroscopy: novel variations of an established technique. Annu. Rev. Biophys. Biomol. Struct. 36, 151-169 (2007).
- Ilien, B. Pirenzepine promotes the dimerization of muscarinic M1 receptors through a three-step binding process. J. Biol. Chem. 284, 19533-19543 (2009).
- Lieto, A. M., Cush, R. C., Thompson, N. L. Ligand-receptor kinetics measured by total internal reflection with fluorescence correlation spectroscopy. Biophys. J. 85, 3294-3302 (2003).
- Thompson, N. L., Burghardt, T. P., Axelrod, D. Measuring surface dynamics of biomolecules by total internal reflection fluorescence with photobleaching recovery or correlation spectroscopy. Biophys. J. 33, 435-454 (1981).
- Thompson, N. L., Steele, B. L. Total internal reflection with fluorescence correlation spectroscopy. Nat. Protoc. 2, 878-890 (2007).
- Eggeling, C. Direct observation of the nanoscale dynamics of membrane lipids in a living cell. Nature. 457, 1159-1162 (2009).
- Kolin, D. L., Wiseman, P. W. Advances in image correlation spectroscopy: measuring number densities, aggregation states, and dynamics of fluorescently labeled macromolecules in cells. Cell Biochem. Biophys. 49, 141-164 (2007).
- Shvartsman, D. E., Kotler, M., Tall, R. D., Roth, M. G., Henis, Y. I. Differently anchored influenza hemagglutinin mutants display distinct interaction dynamics with mutual rafts. J. Cell Biol. 163, 879-888 (2003).
- White, R. Holin triggering in real time. Proc. Natl. Acad. Sci. U.S.A. 108, 798-803 (2011).
- Petersen, N. O., Hoddelius, P. L., Wiseman, P. W., Seger, O., Magnusson, K. E. Quantitation of membrane receptor distributions by image correlation spectroscopy: concept and application. Biophys. J. 65, 1135-1146 (1993).
- Hebert, B., Costantino, S., Wiseman, P. W. Spatiotemporal image correlation spectroscopy (STICS) theory, verification, and application to protein velocity mapping in living CHO cells. Biophys. J. 88, 3601-3614 (2005).
- Digman, M. A. Measuring fast dynamics in solutions and cells with a laser scanning microscope. Biophys. J. 89, 1317-1327 (2005).
- Digman, M. A. Fluctuation correlation spectroscopy with a laser-scanning microscope: exploiting the hidden time structure. Biophys. J. 88, L33-L36 (2005).
- Nohe, A., Keating, E., Fivaz, M., van der Goot, F. G., Petersen, N. O. Dynamics of GPI-anchored proteins on the surface of living cells. Nanomedicine. 2, 1-7 (2006).
- Semrau, S., Schmidt, T. Particle image correlation spectroscopy (PICS): retrieving nanometer-scale correlations from high-density single-molecule position data. Biophys. J. 92, 613-621 (2007).
- Bates, I. R. Membrane lateral diffusion and capture of CFTR within transient confinement zones. Biophys. J. 91, 1046-1058 (2006).
Reprints and Permissions
Request permission to reuse the text or figures of this JoVE article
Request PermissionExplore More Articles
This article has been published
Video Coming Soon
Copyright © 2025 MyJoVE Corporation. All rights reserved