A subscription to JoVE is required to view this content. Sign in or start your free trial.
Method Article
Ex vivo Mimicry of Normal and Abnormal Human Hematopoiesis
In This Article
Summary
A 3D culture system for hematopoiesis is described using human cord blood and leukemic bone marrow cells. The method is based on the use of a porous synthetic polyurethane scaffold coated with extracellular matrix proteins. This scaffold is adaptable to accommodate a wide range of cells.
Abstract
Hematopoietic stem cells require a unique microenvironment in order to sustain blood cell formation1; the bone marrow (BM) is a complex three-dimensional (3D) tissue wherein hematopoiesis is regulated by spatially organized cellular microenvironments termed niches2-4. The organization of the BM niches is critical for the function or dysfunction of normal or malignant BM5. Therefore a better understanding of the in vivo microenvironment using an ex vivo mimicry would help us elucidate the molecular, cellular and microenvironmental determinants of leukemogenesis6.
Currently, hematopoietic cells are cultured in vitro in two-dimensional (2D) tissue culture flasks/well-plates7 requiring either co-culture with allogenic or xenogenic stromal cells or addition of exogenous cytokines8. These conditions are artificial and differ from the in vivo microenvironment in that they lack the 3D cellular niches and expose the cells to abnormally high cytokine concentrations which can result in differentiation and loss of pluripotency9,10.
Herein, we present a novel 3D bone marrow culture system that simulates the in vivo 3D growth environment and supports multilineage hematopoiesis in the absence of exogenous growth factors. The highly porous scaffold used in this system made of polyurethane (PU), facilitates high-density cell growth across a higher specific surface area than the conventional monolayer culture in 2D11. Our work has indicated that this model supported the growth of human cord blood (CB) mononuclear cells (MNC)12 and primary leukemic cells in the absence of exogenous cytokines. This novel 3D mimicry provides a viable platform for the development of a human experimental model to study hematopoiesis and to explore novel treatments for leukemia.
Protocol
1. Scaffold Manufacture and Bio-functionalization of Scaffolds
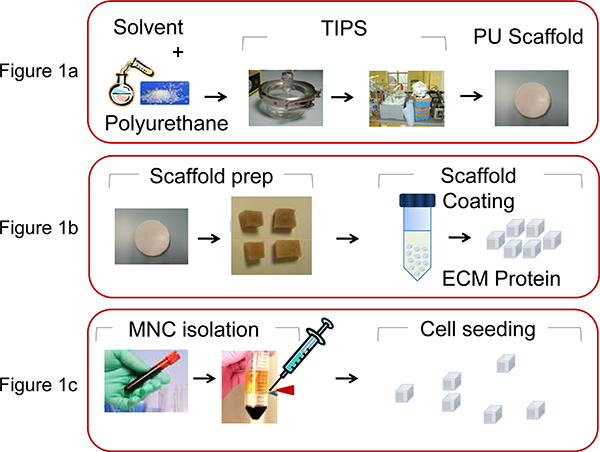
- To fabricate PU scaffolds (pore size 100-250 mm, porosity 90-95%) in the form of Petri dish disks, use the thermally induced phase separation13 process by preparing a polymer solution (5wt% in Dioxan) followed by freezing and subsequent solvent sublimation (Figure 1A).
- Cut the scaffold disk into cubes of 0.5 x 0.5 x 0.5 mm prior to coating with ECM proteins (Figure 1B).
- Pre-wet the scaffolds by immersing them in ethanol (70%) for 1 min and then transfer into phosphate buffered saline (PBS) for 20 min. Then centrifuge for 10 min at 3630 x g and add the protein solution.
- Centrifuge the scaffolds in the protein solution at 1420 x g for 20 min.
- In order to unblock the surface pores, and allow the cells seeded to penetrate deeper into the scaffold, centrifuge the scaffolds one more time at 910 x g for 10 min in PBS.
- Sterilize the scaffolds using a combination of 8 min exposure at 230 v, 50 Hz, 0.14 A, UV lamp, with immersion for 2 h in Ethanol (70%). After that, wash the scaffolds twice in PBS before adding Iscove's Modified Dulbecco Medium (IMDM) supplemented with 30% fetal bovine serum (FBS) and 1% Penicillin and Streptomycin (P/S). Place the scaffolds in a humidified incubator for 3 days at 37 °C and 5% CO2 prior to use. Sterile scaffolds are placed in a 24 well-tissue culture plates (one scaffold per well).
2. Mononuclear Cell Isolation and Scaffold Seeding
- Extract human MNC from cord blood or leukemic bone marrow samples, using Ficoll-Paque density gradient centrifugation (35 min at 1500 rpm) (Figure 1C).
- Resuspend MNC in IMDM containing 30% FBS and 1% P/S.
- Seed 100μl of MNC suspension (2 × 10⁶ cells/scaffold) onto the scaffolds using a micro-pipette.
- Incubate the seeded scaffolds at 37 °C under 5% CO2 for 10 minutes for the cells to settle into the scaffolds.
- Top up each well up with 1.5 ml of IMDM containing 30% FBS and 1% P/S and place well plates in the incubator at 37 °C and 5% CO2 for the duration of the experiment.
- The seeded scaffolds undergo daily change of all media.
3. In situ Cell Proliferation and Morphology: MTS, SEM and Cytospins
- MTS assay: Remove from culture one un-seeded and two seeded scaffolds and place in a clean new 24 well-plate. Add 1 ml of media and 200 μl of the MTS solution and incubate for 3 h at 37 °C and 5% CO2.
- Take 8 x 100 μl samples from the supernatant; place in a 96-well plate and measure absorbance at 490 nm using a microplate reader.
- Scanning electron microscopy (SEM): At different time points of the culture, remove the scaffolds seeded with MNC from the media, and fix with 2.5% PBS-buffered glutaraldehyde solution for 40 min at 4 °C, then wash twice with PBS.
- Dehydrated the scaffolds in a graded series of ethanol (25, 50, 70, 80, 90, 95, and 100%), each for 10 min and dry in an aseptic environment for 4 hours.
- Section specimens and then sputter-coat them with gold in an argon atmosphere for 2 min prior to SEM evaluation, use an acceleration voltage of 20 kV.
- Cytospins: Collect 2.0 x 10⁴ cells/slide by aspirating the cells from the scaffold at different time points in the culture.
- Centrifuge the cells onto a glass slide for 3 min at 1500 rpm.
- Stain the slides with Wright-Giemsa Stain Modified and observe by using an optical microscope. F-view Soft Imaging System can be used to take pictures.
- Wash slides prior to microscope observation.
- Multiphoton analysis: Fix scaffolds at different time points with ethanol vapor (70%) overnight and then dry and store at -20 °C until further analysis. Prior to visualization with the multiphoton microscope section the scaffold into 30 μm-thick slides and wet with PBS.
- Block the seeded scaffolds in PBS with 10% fetal bovine serum for 30 min at room temperature.
- Incubate the scaffolds overnight at 4 °C in darkness with a 1:50 dilution of primary monoclonal antibody: mouse anti human CD71.
- Wash samples three times in PBS and stain with the secondary antibody: anti-mouse Alexa Fluor 488 for 1 h at room temperature in darkness.
- Wash samples three times with PBS and observe with a confocal microscope using a water emission x60 objective lens.
- Fluorophore Alexa Fluor 488 is excited at 488 nm by the pulsatile lasers. Volocity 5.3.2 software can be used for subsequent image analysis.
4. Flow Cytometric Analysis of the Cellular Population
- Before cellular analysis in the flow cytometer (FC), label the cells of interest with the corresponding immunofluorescence antibodies for detection. A number of samples are prepared according to the selected antibodies for detection. For MNC detection the following combination of antibodies are used: CD45-FITC/CD71-PE/CD235a-PE-Cy5.
- Aspirate the cells from the scaffold at different time points and centrifuge. Dissolve a cell pellet of around 1x10⁶ cells in 100 μl FC buffer (PBS + 0.1% sodium azide) and add 10 μL of each antibody fluorescence dye. Incubate the cells for 30 min at 4 °C, wash twice with PBS and finally re-suspend in FC buffer.
- Load the sample into the flow cytometer stained with the isotype control to set the "negativity" of the antibody expression and calibrate the detection channels with the flow cytometer control.
- Read the sample stained with the three different antibodies and finally represent the data in using the WinList software.
5. Representative Results
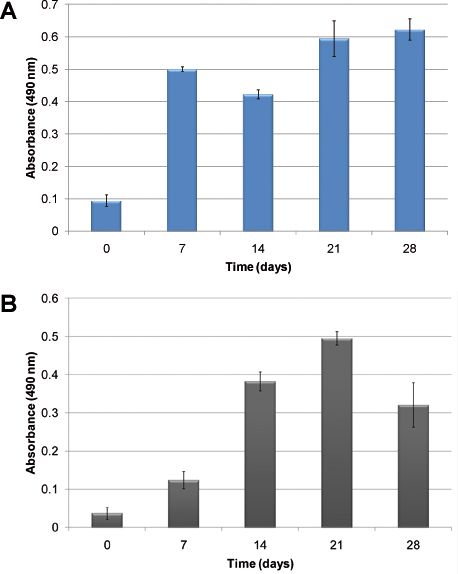
An example of hematopoietic cellular growth kinetics without the addition of exogenous growth factors is shown in Figure 2. Due to the heterogeneous nature of hematopoiesis, two different cells: normal and abnormal hematopoietic cells are illustrated. In Figure 2A, cellular proliferation of human CBMNC is evident after 28 days in culture. Figure 2B shows the growth kinetics in the mimicry using human primary leukemic cells. Cellular proliferation is assessed using the MTS assay which measures cellular metabolic activity in relation to absorbance. In both cases, the cells proliferated and established in the model. Differences in growth kinetics are observed; normal hematopoietic cells establish the culture faster than the leukemic cells.
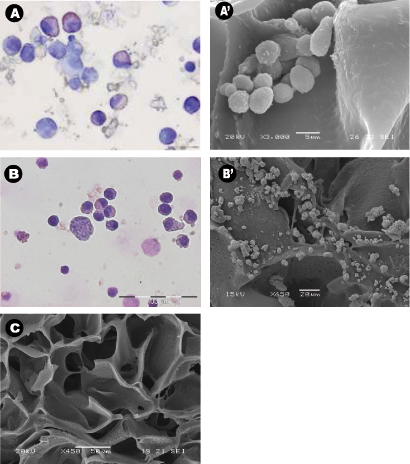
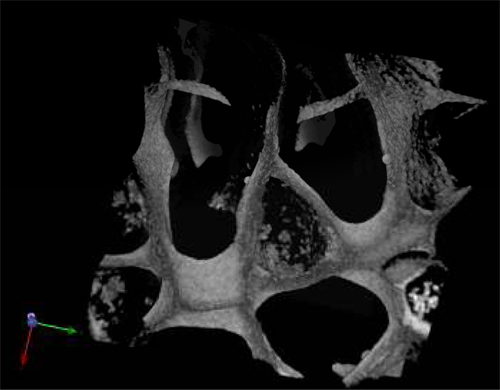
The morphology of the harvested cells even after 28 days of culture in the absence of exogenous growth factors was typical of normal hematopoietic cells (Figure 3A) and leukemic cells (Figure 3B). Central sections of the scaffolds were analyzed by SEM after the scaffolds were removed from the culture and showed the spreading of the seeded cells throughout the scaffold, establishing themselves in clusters and in "niche-like" structures (Figure 3A' &B'). Figure C shows the pore size and distribution in an unseeded scaffold used as a control. Multiphoton microscopy after 28 days was used to highlight the distribution of the cells within the 3D scaffold in situ and it showed the presence of erythroid islands in central sections of the scaffold (Figure 4) by the expression of the marker CD71 which is positive in erythroblasts. This proves the importance of mature and maturing cells during erythropoiesis. Finally, flow cytometry graphs of the cells prior seeding shows the difference in the phenotype of hematopoietic cells, where Figure 5A represents normal hematopoietic cells: human CBMNCs and Figure 5B illustrates abnormal hematopoietic cells: primary leukemic cells. Levels of CD235a + and CD45+ corresponding to erythrocytes and leukocytes respectively are higher in the normal sample than in the leukemic highlighting the hemoblastic nature of the leukemias.

Figure 1. Illustration of the processes involved in PU scaffold manufacture and bio-functionalization. A) PU is dissolved in Dioxan (5wt%) and by the thermally induced phase separation process and subsequent solvent sublimation the scaffold is produced, as described by Safinia et al 13. B) The scaffold disk is then cut into cubes of 0.5 x 0.5 x 0.5 mm and then coated by centrifugation with extra cellular matrix (ECM) proteins. C) MNC are extracted from human umbilical CB or from BM aspiration using density gradient centrifugation and seeded (2x10⁶ cells/scaffold) in the PU scaffolds with a micropipette.

Figure 2. Cellular proliferation measured using the MTS assay: A) using human cord blood MNCs; B) using human primary leukemic cells. The columns show the growth of cells over time when seeded in the PU scaffolds without the addition of exogenous cytokines.

Figure 3: Cell morphology and distribution around the scaffolds using cytospins, scanning electron micrographs. (A-B) Representative Wright-Giemsa stained cytospins of A) cord blood mononuclear cells collected from PU scaffolds after 28 days of culture, and B) bone aspirated leukemic cells collected from PU scaffolds after 14 days of culture. Both experiments were carried out in cytokine free condition. (A'-B') Representative central sections of the PU scaffold SEM micrographs of A') seeded cord blood MNCs and B') leukemic cells after being cultured for 28 days, and C) control scaffold with no cells.

Figure 4. Multiphoton micrograph of a PU scaffold seeded with cord blood MNCs after 28 d in culture and stained with the erythroid marker CD71.

Figure 5. Flow cytometry 3D dot-plots stained for CD45, CD71 and CD235a surface expression markers. The isotype control obtained is also presented for comparison of the relative fluorescence intensity. Panel A shows human cord blood mononuclear cells positive for the above markers; Panel B shows human primary leukemic cells.
Discussion
The ex vivo 3D culture system presented here enables us to establish a 3D biomimicry of hematopoiesis that recapitulates the original BM architecture and cellular phenotype independent of exogenous cytokines. The 3D model provides the structure and the microenvironment that enables normal and abnormal hematopoietic cells to proliferate in conditions similar to those encountered in vivo.
The selection of the polymeric scaffold material represented a critical step in the biomi...
Disclosures
We have nothing to disclose.
Acknowledgements
This work was funded by the Richard Thomas Leukaemia Fund, the Lady Tata Memorial Trust, the Northwick Park Hospital Leukaemia Research Trust Fund and the National Institute of Health Research (NIHR), UK.
Materials
| Name | Company | Catalog Number | Comments |
| Name of the reagent | Company | Catalogue No | |
| Dioxan | Invitrogen | D20,186-3 | |
| PBS | Gibco | 14190-094 | |
| IMDM | Invitrogen | 12440-053 | |
| Ficoll-Paque | GE Healthcare | 17-1440-02 | |
| Penicillin/Streptomycin | Sigma-Aldrich | P4333 | |
| MTS | Promega | G3580 | |
| Glutaraldehyde | Fluka Biochemika | 49624 | |
| Wright-Giemsa | Sigma-Aldrich | WG32 | |
| Fetal bovine serum | Gibco | 10108-165 | |
| CD71 | Santa Cruz Biotechnology | sc-32272 | |
| Alexa Fluor 488 | Invitrogen | A11001 | |
| CD45-FITC | BD Pharmigen | 74895 | |
| CD71-PE | BD Pharmigen | 555537 | |
| CD235a-PE-Cy5 | BD Pharmigen | 555570 | |
| Sodium azide | Sigma-Aldrich | S-8032 |
References
- Orkin, S., Zon, L. Hematopoiesis: an evolving paradigm for stem cell biology. Cell. 132, 631-644 (2008).
- Spradling, A., Drummond-Barbosa, D., Kai, T. Stem cells find their niche. Nature. 414, 98-104 (2001).
- Panoskaltsis, N., Mantalaris, A., Wu, D. Engineering a mimicry of bone marrow tissue ex vivo. J Biosci. Bioeng. 100, 28-35 (2005).
- Lo Celso, C. Live-animal tracking of individual haematopoietic stem/progenitor cells in their niche. Nature. 457, 92-96 (2009).
- Mantalaris, A., Bourne, P., Wu, J. Production of human osteoclasts in a three-dimensional bone marrow culture system. Biochem. Eng. J. 20, 189-196 (2004).
- Placzek, M. Stem cell bioprocessing: fundamentals and principles. J. R. Soc. Interface. 6, 209-232 (2009).
- Dexter, T., Testa, N., Prescott, D. . Methods in Cell Biology. 14, 387-405 (1976).
- Piacibello, W. Differential growth factor requirement of primitive cord blood hematopoietic stem cell for self-renewal and amplification vs proliferation and differentiation. Leukemia. 12, 718-727 (1998).
- Yoshida, T., Takagi, M. Cell processing engineering for ex vivo expansion of hematopoietic cells: a review. Biochemical Engineering Journal. 20, 99-106 (2004).
- Lim, M. Intelligent bioprocessing for haemotopoietic cell cultures using monitoring and design of experiments. Biotechnol. Adv. 25, 353-368 (2007).
- Mortera-Blanco, T., Mantalaris, A., Bismarck, A., Panoskaltsis, N. The development of a three-dimensional scaffold for ex vivo biomimicry of human acute myeloid leukaemia. Biomaterials. 31, 2243-2251 (2010).
- Mortera-Blanco, T., Mantalaris, A., Bismarck, A., Aqel, N., Panoskaltsis, N. Long-term cytokine-free expansion of cord blood mononuclear cells in three-dimensional scaffolds. Biomaterials. 32, 9263-9270 (2011).
- Safinia, L., Datan, N., Hohse, M., Mantalaris, A., Bismarck, A. Towards a methodology for the effective surface modification of porous polymer scaffolds. Biomaterials. 26, 7537-7547 (2005).
Reprints and Permissions
Request permission to reuse the text or figures of this JoVE article
Request PermissionThis article has been published
Video Coming Soon
Copyright © 2025 MyJoVE Corporation. All rights reserved