Method Article
Force Measurement During Contraction to Assess Muscle Function in Zebrafish Larvae
In This Article
Summary
Force measurements can be used to demonstrate changes in muscle function due to development, injury, disease, treatment or chemical toxicity. In this video, we demonstrate a method to measure force during a maximal contraction of zebrafish larval trunk muscle.
Abstract
Zebrafish larvae provide models of muscle development, muscle disease and muscle-related chemical toxicity, but related studies often lack functional measures of muscle health. In this video article, we demonstrate a method to measure force generation during contraction of zebrafish larval trunk muscle. Force measurements are accomplished by placing an anesthetized larva into a chamber filled with a salt solution. The anterior end of the larva is tied to a force transducer and the posterior end of the larva is tied to a length controller. An isometric twitch contraction is elicited by electric field stimulation and the force response is recorded for analysis. Force generation during contraction provides a measure of overall muscle health and specifically provides a measure of muscle function. Although we describe this technique for use with wild-type larvae, this method can be used with genetically modified larvae or with larvae treated with drugs or toxicants, to characterize muscle disease models and evaluate treatments, or to study muscle development, injury, or chemical toxicity.
Introduction
Young zebrafish (Danio rerio) larvae, 3-7 days post-fertilization (dpf), are increasingly recognized as a useful organism for skeletal muscle research. Young larvae are used to model human muscle disease1-9, evaluate drugs and therapeutic strategies10-11, study muscle injury12, understand muscle development13-16, and investigate muscle-related chemical toxicity17-19. Typical studies in these areas examine the degree to which healthy muscle is rendered abnormal by genetic manipulation or exposure to toxicants, and some studies examine the degree to which abnormal muscle responds to treatment. Critical to the success of these studies is the ability to accurately assess muscle health.
While there are a variety of methods available to assess muscle health in zebrafish larvae, few provide direct information about muscle function. Muscle health is usually evaluated by appearance, as assessed by histological staining6,8,11, immunostaining9,15,16,18, light microscopy3,13, electron microscopy3,4,14,16, or birefringence7,9,11, but these techniques provide morphological information only. Trunk and tail displacements and swimming speed4,17 evaluate motor function, but these are not direct measures of muscle function since they also reflect neural input, energy metabolism, and other processes.
In contrast, measuring force generation during contraction provides a direct assessment of muscle function and represents a measure of overall muscle health. Added benefits of this approach include straightforward data analysis and quantitative results. In this video article, we provide a detailed procedure for measuring force generation by larval muscles, in the hope that more researchers will use this method to complement existing measures of muscle health in their research.
The overall goal of this method is to measure force generation during contraction of zebrafish larval trunk muscle. To accomplish this goal, a zebrafish larva is anesthetized and placed into a chamber filled with a salt solution. The anterior end of the larva is tied to a force transducer and the posterior end of the larva is tied to a length controller. Muscle activation is accomplished by electric field stimulation, and the stimulation current and the length of the larva are adjusted to produce maximum twitch force. An isometric twitch contraction is elicited and the force response is recorded for analysis.
To be clear, this technique does not measure forces generated by larval muscles during swimming. Because both ends of the larva are tied to equipment and because the larva remains anesthetized, it cannot initiate movement during testing. Furthermore, field stimulation activates all the muscle fibers at the same time to induce a bilateral contraction, which is not what naturally occurs20. Therefore, rather than measuring actual forces generated during swimming, this technique determines the force generating capability of the larval muscles.
We have used this technique to demonstrate muscle weakness in a zebrafish model of nemaline myopathy21, as well as to evaluate the effect of antioxidant treatment on muscle function in a zebrafish model of multi-minicore disease22. Others have used a similar technique23 to examine the effects of an environmental pollutant on muscle function19.
Protocol
Note: all procedures involving zebrafish should be performed in accordance with relevant guidelines, regulations, and regulatory agencies. All animal use procedures shown in this article were approved by the University of Michigan Committee on the Use and Care of Animals (UCUCA).
1. Make Suture Loops
- Use forceps to separate non-sterile suture (USP 10/0 monofilament nylon, 3 ply) into three strands.
- Begin to tie a double overhand knot in one of the strands. Stop before tightening the knot completely to make a small (~1 mm diameter) loop instead of a knot.
- Use scissors to cut excess suture from the loop tails. An example of a finished loop is shown in Figure 1.
- Place the loop on the sticky side of a Post-it Note for later use. The suture loops will be used to hold the larvae in place during force testing.
- Repeat steps 1.1-1.4 as necessary. Make two suture loops for each larva that will be tested.
2. Make Testing Solution
- Make Tyrodes solution by adding 7.977 g sodium chloride, 0.373 g potassium chloride, 0.265 g calcium chloride dihydrate, 0.102 g magnesium chloride hexahydrate, 0.048 g sodium phosphate monobasic, 1.000 g sodium bicarbonate, and 0.037 g ethylenediaminetetraacetic acid disodium salt dihydrate to 1,000 ml of purified water.
- Stir the solution until the salts are completely dissolved. This solution can be stored for a month at 4 °C.
- Add 2.1 ml of 4 mg/ml tricaine, prepared according to The Zebrafish Book24, to 47.9 ml Tyrodes solution and mix. Protect this solution from light by storing it in a dark glass bottle or in a glass bottle covered with aluminum foil. This solution should be stored at room temperature and made fresh each day.
3. Tie Aanesthetized Larva into Experimental Chamber
- Place the testing apparatus (Figure 2) on the stage of a stereo microscope.
- Connect the force transducer and length controller cables to the testing apparatus. Turn on the force transducer. Turn on the length controller so that it remains rigid. (Note: the length controller provides the ability to stretch or shorten a muscle preparation during a contraction. However, this feature of the length controller is not used in the method described herein. Therefore, the length controller can be thought of as a rigid attachment point mounted to an XYZ positioning system).
- With a disposable transfer pipette, fill the experimental chamber with testing solution.
- Use forceps to pick up a suture loop by one of the tails and hang it on the force transducer tube. Hang a second suture loop on the tube attached to the length controller. (Note: gripping a suture loop on the curved part can kink the suture and cause it to break during subsequent steps).
- With a disposable transfer pipette, transfer a zebrafish larva to a small Petri dish filled with testing solution. Wait for the anesthetic in the testing solution (tricaine) to take effect (~1 min). With a forceps, gently nudge the tail and verify that the larva is anesthetized by a lack of touch-evoked swimming.
- Use a glass pipette to transfer the larva to the experimental chamber.
- By gently nudging the larva with closed forceps, guide the anterior portion of the larva through the suture loop on the force transducer tube. Guide the anterior portion of the larva through the suture loop on the tube. Grasp both suture loop tails with forceps and pull them simultaneously to tighten the suture loop posterior to the yolk sac or swimbladder (Figure 3A).
- With a forceps, hold one suture loop tail and pull, causing the larva to swivel 90° around the tube until the lateral side of the larva faces up (Figure 3B). If the loop was tightened enough, there will be some resistance to the pull; the larva should not swivel easily. If the loop was tightened too much, the larva will not swivel around the tube.
- Using the XYZ positioning device attached to the length controller, move the length controller tube along the X-axis (axis definitions in Figure 2A) and under the trunk and tail of the larva. Leave space between the ends of the length controller tube and the force transducer tube.
- Guide the suture loop over the tail of the larva and tighten the suture loop as previously described (Figure 3C). You may need to swivel the posterior part of the larva so that the lateral side faces up. Trim the suture loop tails (Figure 3D).
4. Position Larva in Experimental Chamber
- Move the larva to an appropriate distance from the chamber bottom to ensure the larva will be within "working distance" of an inverted microscope objective during subsequent steps. To accomplish this, use the XYZ positioning devices to slowly lower the tubes (with attached larva) along the Z-axis until the tubes just touch the bottom of the chamber. Then, raise the tubes until the larva is an appropriate distance from the chamber bottom (~100 μm).
- Using the XYZ positioning device attached to the length controller, adjust the length controller tube along the Y-axis to align the long axis of the larva with the long axis of the force transducer tube.
5. Record Force During a Maximal Twitch Contraction
- Move the testing apparatus to the stage of an inverted microscope.
- Adjust the chamber temperature to a desired value. To begin, connect the water bath circulator, thermometer, and temperature controller to the testing apparatus. Turn on the necessary components and adjust the setting on the temperature controller until the thermometer reports the desired value. Data included in this article were collected at 25 °C, but measurements may also be made at RT or at 28.5 °C.
- Connect cables from the stimulator to the testing apparatus. Turn on the power to the stimulator but do not stimulate the larva until step 5.6.
- Make sure the larva is parallel to the chamber bottom. Through a 40X objective, view the portion of the larva between the ends of the tubes. If parallel to the bottom, both ends of the larva will be in focus. If needed, adjust the force transducer tube along the Z-axis until both ends are in focus.
- Verify that the larva length is shorter than optimal. Turn on the video sarcomere length system and rotate the video camera such that the striations are parallel to the sides of the video frame. This system monitors striation spacing by analyzing variations in pixel intensity along each horizontal row of pixels within a user-defined region of interest (ROI). The results for all rows within the ROI are averaged and reported with a frequency equivalent to the video frame-rate (≥80 sec-1). The striation spacing is used as an indicator of sarcomere length.
- Adjust the microscope to focus on peripheral fibers and note the indicated sarcomere length. If necessary, use the XYZ positioning device attached to the length controller to adjust length of the larva (X-axis) until the sarcomere length is less than optimal (e.g. 1.90 μm).
- Adjust the stimulation current to optimize twitch force. To begin, set the output current on the stimulator to a low magnitude (e.g. 100 mA). The stimulator can be triggered manually or by a computer running a custom LabVIEW program. Elicit a twitch of the larval muscles with a current pulse of 0.2 msec in duration.
- Use an oscilloscope to record the force output and measure the peak twitch force using the oscilloscope's cursors. Increase the current by 50 mA increments and measure the peak twitch force at each current level. Wait 30 sec between twitches to prevent fatigue. As stimulation current increases, peak twitch force typically increases to a maximum and then gradually decreases. The current at which the larva generates the greatest force is the optimal stimulation current. Set the current amplitude to the optimal stimulation current.
- Using the XYZ positioning device, adjust the length of the larva (and thus, sarcomere length) in order to elicit maximum twitch force. Wild-type zebrafish larvae (3-7 dpf) generate maximum twitch force at sarcomere lengths of 2.10 μm or 2.15 μm. However, the sarcomere length can be set to 2.08 μm to avoid excess strain on the larva.
- Elicit a twitch of the larval muscles. Use the oscilloscope to record the force response and save the record for subsequent analysis.
6. Measure Musculature Dimensions with Larva at Optimal Length
- Move the testing apparatus back to the stereo microscope.
- Using the eyepiece scale, measure the height of the musculature as viewed from the side. Then, taking care not to change the length of the larva, swivel the larva by 90° using the suture loop tails in order to view the larva from the bottom. Measure the width of the musculature as viewed from the bottom. Take the measurements at an anatomical landmark (e.g. urogenital opening) (Figure 4).
- Cut the suture loops with a microblade to release the larva from the testing equipment.
Results
In healthy wild-type zebrafish larvae, the muscle fibers should be parallel to one another without large gaps between them and have evident striations (Figure 5A). Wild-type zebrafish larvae that do not exhibit these features, or with evident damage such as detached fibers (Figure 5B), should be discarded.
A representative plot of peak twitch force versus stimulation current for a single zebrafish larva is shown in Figure 6. For wild-type zebrafish larvae between 3-7 dpf, the optimal stimulation current is typically between 400-600 mA, with 3 dpf larvae generally requiring greater stimulation current than 6-7 dpf larvae.
The raw force data (collected during step 5.8) has to be processed and analyzed with data analysis software. First, the baseline of the force record is set to zero. Second, the voltage output of the force transducer is converted to force (mN) (see manufacturer's instructions to generate a calibration curve for the force transducer). A representative force response collected during a maximal twitch contraction of a single larva is shown in Figure 7. Data analysis software can be used to measure peak force and other features of the force response.
A representative set of peak force data from maximal twitch contractions is shown in Figure 8A. Typical peak twitch force values for wild-type 3-7 dpf larvae range from 0.9 to 1.7 mN, with older larvae generating more force than younger larvae. Differences in peak twitch force can be due to normal processes like growth and development (Figure 8) or abnormal processes such as gene mutation-related pathology21,22.
Normalization by muscle cross-sectional area (CSA) can be used to determine the degree to which differences in peak twitch force are simply due to differences in size of the musculature21,22. Muscle CSA can be estimated using the formula: CSA = π(A/2)(B/2), where A is the height of the musculature as viewed from the side, B is the width of the musculature as viewed from the bottom, and an elliptical cross-section is assumed. Typical CSA values for wild-type 3-7 dpf larvae range from 0.027 to 0.034 mm2, with 3-4 dpf larvae generally showing smaller CSA values than 5-7 dpf larvae. A representative set of normalized peak force data from maximal twitch contractions is shown in Figure 8B. Typical normalized peak twitch force values for wild-type 3-7 dpf larvae range from 34 to 51 mN/mm2, with 4-7 dpf larvae generally showing greater values than 3 dpf larvae.
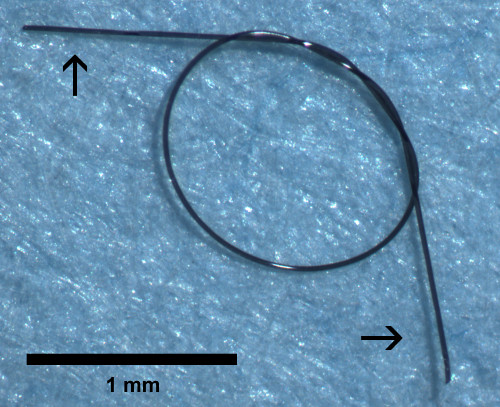
Figure 1. Suture loop. Arrows point to the suture loop tails.
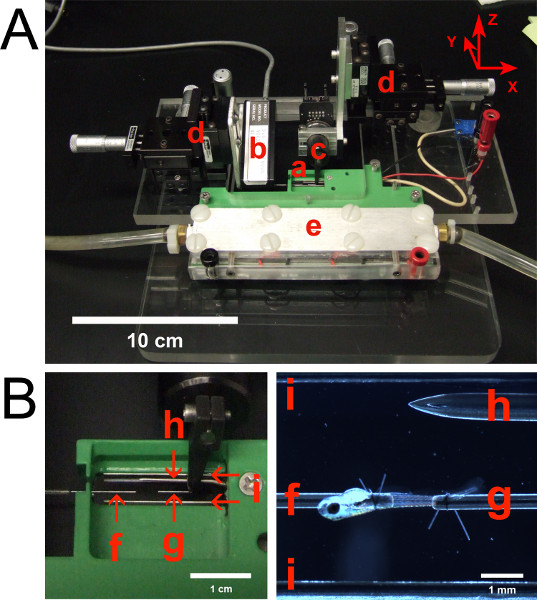
Figure 2. (A) Testing apparatus with labeled components. (B) Close-up views of the experimental chamber. (a) Experimental chamber with transparent bottom. (b) Force transducer. (c) Length controller. (d) XYZ positioning devices. The X, Y, and Z axes are defined in the upper right corner. (e) Temperature control system utilizing thermoelectric modules. Tubing accommodates water flow for cooling of thermoelectric modules. (f) Stainless steel tube attached to force transducer. (g) Stainless steel tube attached to length controller. (h) Thermometer microprobe. (i) Platinum parallel plate electrodes, spanning the length of the chamber. Platinum plates are 2.5 mm high and 0.255 mm thick.
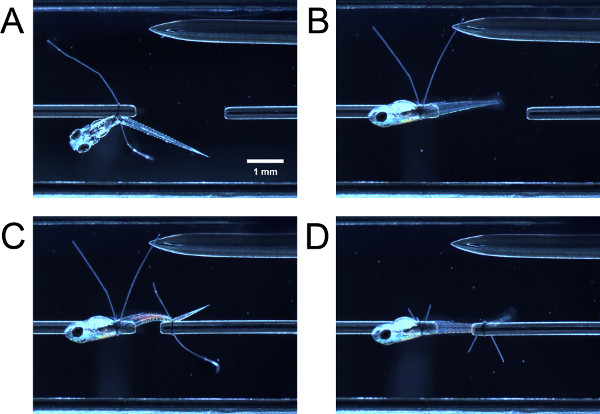
Figure 3. Tying larva into experimental chamber. (A) Larva tied on at anterior end but not yet swiveled 90°. (B) Larva after swiveled 90°. (C) Larva tied on at posterior end but not yet swiveled. (D) Larva after swiveled and suture loop tails are trimmed.

Figure 4. Measurements for cross-sectional area estimation. Musculature as viewed from the (A) side and (B) bottom. Placement of the red bars indicate the location of the urogenital opening. The length of the red bars indicate the height and width of the musculature as viewed from the side and bottom respectively.

Figure 5. Lateral view of zebrafish larvae trunk musculature. (A) Healthy tissue. (B) Tissue with evident damage. Contractures resulting from fiber detachments are marked with asterisks.
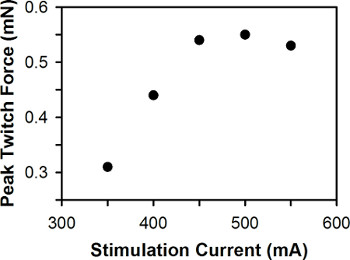
Figure 6. Representative plot of peak twitch force versus stimulation current. The optimal stimulation current is 500 mA.
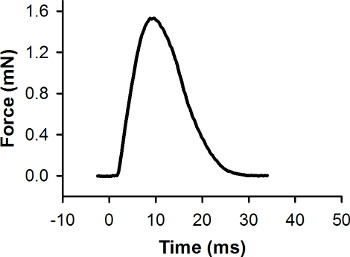
Figure 7. Representative force record for a single twitch contraction. This contraction was elicited with a stimulus pulse at 0 msec. The peak force is 1.56 mN.
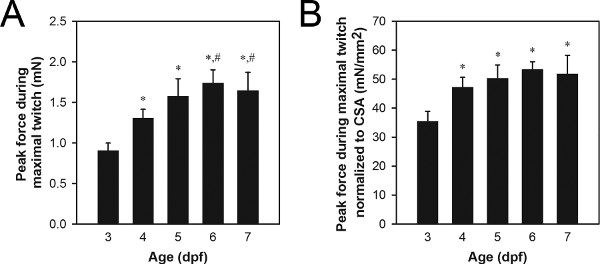
Figure 8. Representative force data from 3-7 dpf larvae. (A) Peak force data from maximal twitch contractions. (B) Peak force data from maximal twitch contractions normalized to CSA. Older larvae (6-7 dpf) were fed Hatchfry Encapsulon Grade 0 with Spirulina (Argent Laboratories) starting on 5 dpf. Means + standard deviations are reported with N=5 in each group. Groups significantly different from 3 dpf larvae (*) and 4 dpf larvae (#) are indicated (ANOVA, P<0.05). The significant increase in normalized force between 3 and 4 dpf (B) indicates an increase in the intrinsic force generating capability during this time period, whereas the increase in force between 4 and 6-7 dpf (A) is attributed to growth based on no change from 4 to 7 dpf in normalized force.
Discussion
This method measures force generation during a twitch to assess muscle function in trunk muscles of zebrafish larvae. Although tetanic contractions can be elicited in zebrafish larvae (e.g. by 200 stimulation pulses/sec for a duration of 0.2 sec), the maximum tetanic force is only 10-15% greater than the maximum twitch force. Therefore, the force generated during a twitch is a reasonable measure of force generating capability. Twitches are preferred over tetanic contractions because twitches are less likely to cause ripping or slipping at the suture ties.
In order to generate meaningful data with this technique, maximum twitch force should be achieved for each larva and the variability between experimental groups should be minimized. With these goals in mind, we offer the following suggestions. First, take care when tying the larva to the force transducer and the length controller tubes. If the suture loops are tightened too much, the suture will cut through the muscle tissue. If the suture loops are not tightened enough, the force generated by the larva will not be fully transmitted to the force transducer. Both situations, but especially the latter, underestimate maximum twitch force. Second, since testing multiple experimental groups can take several hours (20-30 min/larva), alternate between groups because larvae will continue to develop during the testing period.
While some of the mentioned equipment is essential for measurement of maximum twitch force (e.g. force transducer, current stimulator), other items are not absolutely necessary. The video sarcomere length system is desirable but not required. As an alternative, a series of twitches can be used to find optimal length, during which the length of the larva is adjusted until maximum twitch force is achieved. A temperature control system is also not absolutely necessary. Temperature control is critical when measuring twitch kinetics, which are highly sensitive to temperature, whereas maximum twitch force is not particularly sensitive to small changes in temperature and could be measured at room temperature. Note that regardless of the temperature in the chamber during force testing, the larvae should be maintained at the optimal growth temperature of 28.5 °C24 prior to force testing for accurate staging.
The larvae are tested in a Tyrodes solution containing tricaine. We use 0.02% (w/v) tricaine, the concentration recommended for anesthesia24, to eliminate spontaneous contractions evoked by the nervous system and thus prevent fatigue during force testing. Tricaine also facilitates the tie-on step and reduces overall testing time. However, we observe that including tricaine in the testing solution consistently reduces the maximum twitch force by approximately 30%. A similar effect has also been observed in tadpole tail muscle, where tricaine reduced force generation after neuromuscular transmission was blocked, suggesting that tricaine has a direct effect on muscle25. Tricaine may reduce muscle cell excitability by reducing sodium conductance across the cell membrane, as it does in nerve cells26. Other options for blocking activation by motoneurons are d-tubocurarine and α-bungarotoxin but, unlike tricaine, these compounds are not skin-permeable and must be injected directly into the head, spinal cord, or heart27. Individual investigators will need to assess whether or not tricaine is desirable for their specific application. If tricaine is included in the testing solution, the concentration should be consistent between experiments and researchers should verify that the effect of the tricaine does not vary between experimental groups.
We describe this method for larvae as young as 3 dpf and as old as 7 dpf. Although muscle fibers appear to be functional as early as 17 hr post-fertilization, when spontaneous tail movements begin27, the short length of the tail before 3 dpf hinders tying the larva to the testing equipment. We typically do not test larva after 7 dpf since many disease models do not survive much longer than this time. If testing larvae beyond 5 dpf, the larvae should be fed. We have observed that unfed larvae have smaller muscles and generate less maximum twitch force than fed larvae, likely due to the diminishing yolk sac. Thus it may be desirable to test larvae between 3-5 dpf, to avoid the additional variable of external feeding.
In summary, we describe a quantitative and reliable method for measuring force generation during a maximal twitch contraction of zebrafish larval trunk muscle. This method can be used to assess the overall health of zebrafish larval muscle and specifically provides information about muscle function. In addition to providing information about the magnitude of force generation, this technique can be used to study the kinetics of force generation or be adapted to study muscle fatigue22. Although we describe this technique for use with wild-type larvae, this method can be used for genetically modified larvae or for larvae treated with drugs or toxicants, to characterize muscle disease models and evaluate treatments, or to study muscle development, muscle injury, or muscle-related chemical toxicity.
Disclosures
Open access fees have been paid for by Aurora Scientific.
Acknowledgements
The authors thank Angela Busta for assistance with zebrafish husbandry. This work was supported by the National Institutes of Health (AG-020591 to S.V.B. and 1K08AR054835 to J.J.D.).
Materials
| Name | Company | Catalog Number | Comments |
| REAGENTS | |||
| Tricaine powder | Sigma-Aldrich | A5040 | |
| Sodium chloride | Sigma-Aldrich | S7653 | |
| Potassium chloride | Sigma-Aldrich | P9541 | |
| Calcium chloride dihydrate | Sigma-Aldrich | 223506 | |
| Magnesium chloride hexahydrate | Sigma-Aldrich | M2670 | |
| Sodium phosphate monobasic | Sigma-Aldrich | S0751 | |
| Sodium bicarbonate | Sigma-Aldrich | S6297 | |
| Ethylenediaminetetraacetic acid disodium salt dihydrate | Sigma-Aldrich | E5134 | |
| EQUIPMENT | |||
| Nonsterile-suture | Ashaway Line Twine | S30002 | USP 10/0 monofilament nylon (3 ply) |
| Forceps | Fine Science Tools | 11251-20 | Dumont #5 |
| Spring scissors | Fine Science Tools | 15000-08 | Vannas |
| Stereo microscope | Leica Microsystems | MZ8 | Illuminated with Fostec EKE ACE I light source |
| Force transducer |  Aurora Scientific Aurora Scientific | 400A | |
| Length controller |  Aurora Scientific Aurora Scientific | 318B | |
| XYZ positioning devices | Parker Hannifin | 3936M | |
| Thermometer | Physitemp | BAT-12 | |
| Disposable transfer pipette | Fisher Scientific | 13-711-9AM | Cut end to widen opening and facilitate larva transfer |
| Petri dish | Fisher Scientific | 08-757-11YZ | |
| Glass pipette | Fisher Scientific | 13-678-8B | Cut end (and fire-polish) to widen opening and facilitate larva transfer |
| Inverted microscope | Carl Zeiss Microscopy | Axiovert 100 | |
| Water bath circulator | Neslab Instruments | RTE-111 | |
| Temperature controller | Alpha Omega Instruments | Series 800 | |
| Stimulator |  Aurora Scientific Aurora Scientific | 701C | High-power, follow stimulator |
| Video sarcomere length system |  Aurora Scientific Aurora Scientific | 900B-5A | |
| LabVIEW software | National Instruments | ||
| Oscilloscope | Nicolet Technologies | ACCURA 100 | |
| Microblade | Fine Science Tools | 10050-00 | |
| Microblade holder | Fine Science Tools | 10053-13 | |
| Data analysis software (Signo) | Alameda Applied Sciences | ||
References
- Bassett, D. I., Bryson-Richardson, R. J., Daggett, D. F., Gautier, P., Keenan, D. G., Currie, P. D. Dystrophin is required for the formation of stable muscle attachments in the zebrafish embryo. Development. 130 (23), 5851-5860 (2003).
- Nixon, S. J., Wegner, J., et al. Zebrafish as a model for caveolin-associated muscle disease; caveolin-3 is required for myofibril organization and muscle cell patterning. Hum. Mol. Genet. 14 (13), 1727-1743 (2005).
- Hall, T. E., Bryson-Richardson, R. J., et al. The zebrafish candyfloss mutant implicates extracellular matrix adhesion failure in laminin α2-deficient congenital muscular dystrophy. PNAS. 104 (17), 7092-7097 (2007).
- Hirata, H., Watanabe, T., et al. Zebrafish relatively relaxed mutants have a ryanodine receptor defect, show slow swimming and provide a model of multi-minicore disease. Development. 134, 2771-2781 (2007).
- Dowling, J. J., Vreede, A. P., et al. Loss of myotubularin function results in t-tubule disorganization in zebrafish and human myotubular myopathy. PLoS Genet. 5 (2), e1000372 (2009).
- Berger, J., Berger, S., Hall, T. E., Lieschke, G. J., Currie, P. D. Dystrophin-deficient zebrafish feature aspects of the Duchenne muscular dystrophy pathology. Neuromuscul. Disord. 20 (12), 826-832 (2010).
- Kawahara, G., Guyon, J. R., Nakamura, Y., Kunkel, L. M. Zebrafish models for human FKRP muscular dystrophies. Hum. Mol. Genet. 19 (4), 623-633 (2010).
- Wallace, L. M., Garwick, S. E., et al. DUX4, a candidate gene for facioscapulohumeral muscular dystrophy, causes p53-dependent myopathy in vivo. Ann. Neurol. 69, 540-552 (2011).
- Sztal, T. E., Sonntag, C., Hall, T. E., Currie, P. D. Epistatic dissection of laminin-receptor interactions in dystrophic zebrafish muscle. Hum. Mol. Genet. , (1093).
- Kawahara, G., Karpf, J. A., Myers, J. A., Alexander, M. S., Guyon, J. R., Kunkel, L. M. Drug screening in a zebrafish model of Duchenne muscular dystrophy. PNAS. 108 (13), 5331-5336 (2011).
- Berger, J., Berger, S., Jacoby, A. S., Wilton, S. D., Currie, P. D. Evaluation of exon-skipping strategies for Duchenne muscular dystrophy utilizing dystrophin-deficient zebrafish. J. Cell Mol. Med. 15 (12), 2643-2651 (2011).
- Seger, C., Hargrave, M., Wang, X., Chai, R. J., Elworthy, S., Ingham, P. W. Analysis of Pax7 expressing myogenic cells in zebrafish muscle development, injury, and models of disease. Dev. Dyn. 240, 2440-2451 (2011).
- Postel, R., Vakeel, P., Topczewski, J., Knöll, R., Bakkers, J. Zebrafish integrin-linked kinase is required in skeletal muscles for strengthening the integrin-ECM adhesion complex. Dev. Biol. 318 (1), 92-101 (2008).
- Zoeller, J. J., McQuillan, A., Whitelock, J., Ho, S. Y., Iozzo, R. V. A central function for perlecan in skeletal muscle and cardiovascular development. J. Cell Biol. 181 (2), 381-394 (2008).
- Kim, H. R., Ingham, P. W. The extracellular matrix protein TGFBI promotes myofibril bundling and muscle fibre growth in the zebrafish embryo. Dev. Dyn. 238, 56-65 (2009).
- Beqqali, A., Monshouwer-Kloots, J., et al. CHAP is a newly identified Z-disc protein essential for heart and skeletal muscle function. J. Cell Sci. 123 (7), 1141-1150 (2010).
- Huang, H., Huang, C., et al. Toxicity, uptake kinetics and behavior assessment in zebrafish embryos following exposure to perfluorooctanesulphonicacid (PFOS). Aquat. Toxicol. 98 (2), 139-147 (2010).
- Sylvain, N. J., Brewster, D. L., Ali, D. W. Zebrafish embryos exposed to alcohol undergo abnormal development of motor neurons and muscle fibers. Neurotoxicol. Teratol. 32 (4), 472-480 (2010).
- Chandrasekar, G., Arner, A., Kitambi, S. S., Dahlman-Wright, K., Andersson-Lendahl, M. Developmental toxicity of the environmental pollutant 4-nonylphenol in zebrafish. Neurotoxicol. Teratol. 33 (6), 752-764 (2011).
- Buss, R. R., Drapeau, P. Activation of embryonic red and white muscle fibers during fictive swimming in the developing zebrafish. J. Neurophysiol. 87 (3), 1244-1251 (2002).
- Telfer, W. R., Nelson, D. D., Waugh, T., Brooks, S. V., Dowling, J. J. neb: a zebrafish model of nemaline myopathy due to nebulin mutation. Dis Model Mech. 5, 389-396 (2012).
- Dowling, J. J., Arbogast, S., et al. Oxidative stress and successful antioxidant treatment in models of RYR1-related myopathy. Brain. 135 (4), 1115-1127 (2012).
- Dou, Y., Andersson-Lendahl, M., Arner, A. Structure and function of skeletal muscle in zebrafish early larvae. J. Gen. Physiol. 131, 445-453 (2008).
- Westerfield, M. . The zebrafish book: a guide for the laboratory use of zebrafish (Danio rerio). , (2000).
- Herr, V. D., Sonnenburg, D. C., Courogen, P. M., Fiamengo, S. A., Downes, H. Muscle weakness during tricaine anesthesia. Comp Biochem Physiol Part C. 110 (3), 289-296 (1995).
- Frazier, D. T., Narahashi, T. Tricaine (MS-222): effects of ionic conductances of squid axon membranes. Eur. J. Pharmacol. 33 (2), 313-317 (1975).
- Saint-Amant, L., Drapeau, P. Time course of the development of motor behaviors in the zebrafish embryo. J. Neurobiol. 37 (4), 622-632 (1998).
Reprints and Permissions
Request permission to reuse the text or figures of this JoVE article
Request PermissionThis article has been published
Video Coming Soon
Copyright © 2025 MyJoVE Corporation. All rights reserved