
Method Article
qKAT: Quantitative Semi-automated Typing of Killer-cell Immunoglobulin-like Receptor Genes
In This Article
Summary
Quantitative killer cell immunoglobulin-like receptor (KIR) semi-automated typing (qKAT) is a simple, high-throughput, and cost-effective method to copy number type KIR genes for their application in population and disease association studies.
Abstract
Killer cell immunoglobulin-like receptors (KIRs) are a set of inhibitory and activating immune receptors, on natural killer (NK) and T cells, encoded by a polymorphic cluster of genes on chromosome 19. Their best-characterized ligands are the human leukocyte antigen (HLA) molecules that are encoded within the major histocompatibility complex (MHC) locus on chromosome 6. There is substantial evidence that they play a significant role in immunity, reproduction, and transplantation, making it crucial to have techniques that can accurately genotype them. However, high-sequence homology, as well as allelic and copy number variation, make it difficult to design methods that can accurately and efficiently genotype all KIR genes. Traditional methods are usually limited in the resolution of data obtained, throughput, cost-effectiveness, and the time taken for setting up and running the experiments. We describe a method called quantitative KIR semi-automated typing (qKAT), which is a high-throughput multiplex real-time polymerase chain reaction method that can determine the gene copy numbers for all genes in the KIR locus. qKAT is a simple high-throughput method that can provide high-resolution KIR copy number data, which can be further used to infer the variations in the structurally polymorphic haplotypes that encompass them. This copy number and haplotype data can be beneficial for studies on large-scale disease associations, population genetics, as well as investigations on expression and functional interactions between KIR and HLA.
Introduction
In humans, the killer immunoglobulin-like receptor(KIR) locus is mapped on the long arm of chromosome 19 within the leukocyte receptor complex (LRC). This locus is around 150 kb in length and includes 15 KIR genes arranged head-to-tail. The KIR loci that are currently known are KIR2DL1, KIR2DL2/KIR2DL3, KIR2DL4, KIR2DL5A, KIR2DL5B, KIR2DS1-5, KIR3DL1/KIR3DS1, KIR3DL2-3, and two pseudogenes, KIR2DP1 and KIR3DP1. The KIR genes encode for two-dimensional (2D) and three-dimensional (3D) immunoglobulin-like domain receptors with short (S; activating) or long (L; inhibitory) cytoplasmic tails, which are expressed by natural killer (NK) cells and subsets of T cells. Copy number variation exhibited within the KIR locus forms diverse haplotypes with variable gene content1. Non-allelic homologous recombination (NAHR), facilitated by a close head-to-tail gene arrangement and high-sequence homology, is the mechanism proposed to be responsible for the haplotypic variability. Over 100 different haplotypes have been reported in populations worldwide1,2,3,4. All these haplotypes could be divided into two major groups: A and B haplotypes. The A haplotype contains 7 KIR genes: KIR3DL3, KIR2DL1, KIR2DL3, KIR2DL4, KIR3DL1, and KIR3DL2, which are inhibitory KIR genes, and the activating KIR gene KIR2DS4. However, up to 70% of European-origin individuals who are homozygous for KIR haplotype A exclusively carry a non-functional "deletion" form of KIR2DS45,6. All other KIR gene combinations form group B haplotypes, including at least one of the specific KIR genes KIR2DS1, KIR2DS2, KIR2DS3, KIR2DS5, KIR3DS1, KIR2DL2, and KIR2DL5, and typically include two or more activating KIR genes.
HLA Class I molecules have been identified as the ligands for certain inhibitory receptors (KIR2DL1, KIR2DL2, KIR2DL3, and KIR3DL1), activating receptors (KIR2DS1, KIR2DS2, KIR2DS4, KIR2DS5, and KIR3DS1), and for KIR2DL4, which is a unique KIR that contains a long cytoplasmic tails like other inhibitory KIR receptors but also has a positively charged residue near the extracellular domain which is a common feature of other activating KIR receptors. The combination of variants within the KIR genes and the HLA genes influences receptor ligand interaction that shapes potential NK cell responsiveness at the individual level7,8. Evidence from genetic association studies has indicated that KIR plays a role in viral resistance (e.g., human immunodeficiency virus [HIV]9 and hepatitis C virus [HCV]10), the success of transplantation11, the risk of pregnancy disorders and reproductive success12,13, the protection against relapse after allogeneic hematopoietic stem cell transplantation (HSCT)14,15,16, and the risk of cancers17.
The combination of high-sequence homology and allelic and haplotypic diversity presents challenges in the task of accurately genotyping KIR genes. Conventional methods to type KIR genes include sequence-specific primer (SSP) polymerase chain reaction (PCR)18,19,20, sequence-specific oligonucleotide probe (SSOP) PCR21, and matrix assisted laser desorption ionization-time of flight mass spectrometry (MALDI-TOF MS)22. The drawbacks of these techniques are that they only provide partial insight into the genotype of an individual whilst also being laborious to perform. Recently next-generation sequencing (NGS) has been applied to type the KIR locus specifically. While this method is very powerful, it can be expensive to run, and it is time-consuming to conduct in-depth analysis and data checks.
qKAT is a high-throughput quantitative PCR method. While conventional methods are laborious and time-consuming, this method makes it possible to run nearly 1,000 genomic DNA (gDNA) samples in five days and gives the KIR genotype, as well as the gene copy number. qKAT consists of ten multiplex reactions, each of which targets two KIR loci and one reference gene of a fixed copy number in the genome (STAT6) used for the relative quantification of the KIR gene copy number23. This assay has been successfully used in studies involving large population panels and disease cohorts on infectious diseases such as HCV, autoimmune conditions like type 1 diabetes, and pregnancy disorders such as preeclampsia, as well as providing a genetic underpinning to studies aimed at understanding the NK cell function1,4,24,25,26.
Protocol
1. Preparation and Plating out of DNA
- Accurately quantify the gDNA concentration using a spectrophotometric or fluorometric instrument.
- Dilute DNA to 4 ng/µL on a 96-well deep-well plate. Include at least one control gDNA sample with a known copy number and one non-template control.
- Centrifuge the 96-well plates at 450 x g for 2 min.
- Using a liquid handling instrument, dispense each sample in quadruplicate onto 384-well qPCR plates so that every well has 10 ng of DNA (2.5 µL/well). Prepare at least ten 384-well plates, one for each qKAT reaction.
- If gDNA is being dispensed from more than one 96-well plate, perform a full-volume wash with 2% bleach and ultrapure water to clean the needles of the liquid handling system between each 96-well plate of gDNA samples.
- Air-dry the DNA by incubating the 384-well plates in a clean area at room temperature for at least 24 h.
2. Preparation of the Primers and Probes
NOTE: qKAT consists of ten multiplex reactions. Each reaction includes three primer pairs and three fluorescence-labeled probes that specifically amplify two KIR genes and one reference gene. The probes that were published in Jiang et al.27 were modified so that the oligonucleotides are now labeled with ATTO dyes since they offer improved photostability and long signal lifetimes. Pre-aliquoted primer combinations are commercially available (see Table of Materials).
- Prepare primer combinations for each reaction as per the dilutions given in Table 1.
- Prepare probe combinations for each reaction as per Table 1. Test each individual probe prior to making the combination.
3. Preparation of the Master Mix
NOTE The volumes mentioned below are for performing one qKAT reaction on a set of 10x 384-well plates.
- Ensure that the gDNA samples plated on the 384-well plates are completely dry. Conduct all steps on ice and keep the reagents covered from exposure to light as much as possible since the fluorescence-labeled probes are photo- and thermo-sensitive.
- Defrost the qPCR buffer, primer, and probe aliquots at 4 °C.
- On ice, prepare a master mix for 10x 384-well plates by adding 18.86 mL of ultrapure water, 20 mL of qPCR buffer, 1,000 µL of preprepared primer combination, and 180 µL of preprepared probe combination (Table 2).
- Distribute the master mix evenly across a 96-deep well plate using a multi-channel pipette, pipetting 415 µL into each well. Keep this plate in an ice box covered from light.
- Using a liquid handling instrument, dispense 9.5 µL of the master mix into each well of the 384-well plate with dried gDNA. Seal the plate with a foil and immediately place it at 4 °C. Repeat this process for the remaining plates, ensuring that the needles of the liquid handling system are washed with water between each plate.
- Centrifuge the 384-well plates at 450 x g for 3 min and incubate them at 4 °C overnight or between 6 - 12 h to resuspend the DNA and to dissipate any air bubbles.
4. qPCR Assay
- Following the overnight incubation, centrifuge at 450 x g for 3 min to dissipate any remaining air bubbles.
- For purposes of automation, connect the qPCR machine (e.g., LightCycler 480) to a microplate handler (see Table of Materials). Program the microplate handler to place the plates into the qPCR machine from a cooled storage dock that is protected from light.
NOTE The assays should, in theory, work on other qPCR machines with compatible optic settings. - Use the following cycling conditions: 95 °C for 5 min followed by 40 cycles of 95 °C for 15 s and 66 °C for 50 s, with data collection at 66 °C.
- Once the run is complete, have the robot collect the plate from the qPCR machine and place it in the discard dock.
5. Post-run Analysis
- After amplification, calculate the quantification cycle (Cq) values using either the second derivative maximum method or the Fit Points method with the software of the qPCR machine (see Table of Materials), following the steps below.
- Open the qPCR software and, in the Navigator tab, open the saved reaction experiment file for one plate.
- For the analysis using the second derivative maximum method, select the Analysis tab, and create a new analysis using Abs Quant/Second Derivative Max method.
- In the Create new analysis window, select analysis type: Abs Quant/Second Derivative Max method, subset: All Samples, program: Amplification, name: Rx-DFO (where x is the reaction number).
- Select Filter Comb and choose VIC/HEX/Yellow555 (533-580). This ensures that the data collected for STAT6 is selected.
- Select Colour Compensation for VIC/HEX/Yellow555(533-580). Click Calculate. Repeat this for Fam (465-510) and Cy5/Cy5.5(618-660). Click Save file.
- For the analysis using the Fit Points method, select Abs Quant/Fit Points in the Analysis tab.
- In the Create new analysis window, select analysis type: Abs Quant/Fit Points method, subset: All Samples, program: Amplification, name: RxF-DFO (where x is the reaction number).
- Select the correct filters and color compensations for STAT6 and each of the KIR genes (Fam/Cy5). In the Noiseband tab, set the noise band to exclude the background noise.
- In the Analysis tab, set the fit points to 3 and select Show fit points. Click Calculate. Click Save file.
6. Export of the Results
- In the qPCR software, open the Navigator tab. Select Results Batch Export.
- Open the folder in which the experiment files are saved and transfer the files into the right-hand side section of the window. Click Next. Select the name and the location of the export file.
- Select Analysis type Abs Quant/Second Derivative Max method or Abs Quant/Fit Points. Click Next. Check that the name of the file, the export folder, and the analysis type are correct and click Next to start the export process.
- Wait until the Export Status is Ok. The screen will automatically move to the next step. Check that all selected files have been exported successfully so that the number of files failed = 0. Click Done.
- Use scripts split_file.pl and roche2sds.pl to split the exported plates into individual reactions for each plate.
NOTE The scripts are provided on request/GitHub.
7. Copy Number Calculations
- Open the copy number analysis software (e.g., CopyCaller). Select Import real-time PCR results file and load text files created by roche2sds.pl.
- Select Analyze and conduct the analysis by either selecting calibrator sample with known copy number or by selecting most frequent copy number. See Table 5 for the most frequent copy number of KIR genes typically observed in European-origin populations.
8. Data-quality Checks
- Use R script KIR_CNVdata_analysis_for_Excel_ver020215.R to combine copy number data from all the plates into a spreadsheet.
NOTE The scripts are provided on request/GitHub. - Recheck the raw data on the copy number analysis software for samples that do not conform to the known linkage disequilibrium (LD) for KIR genes (Table 6).
Results
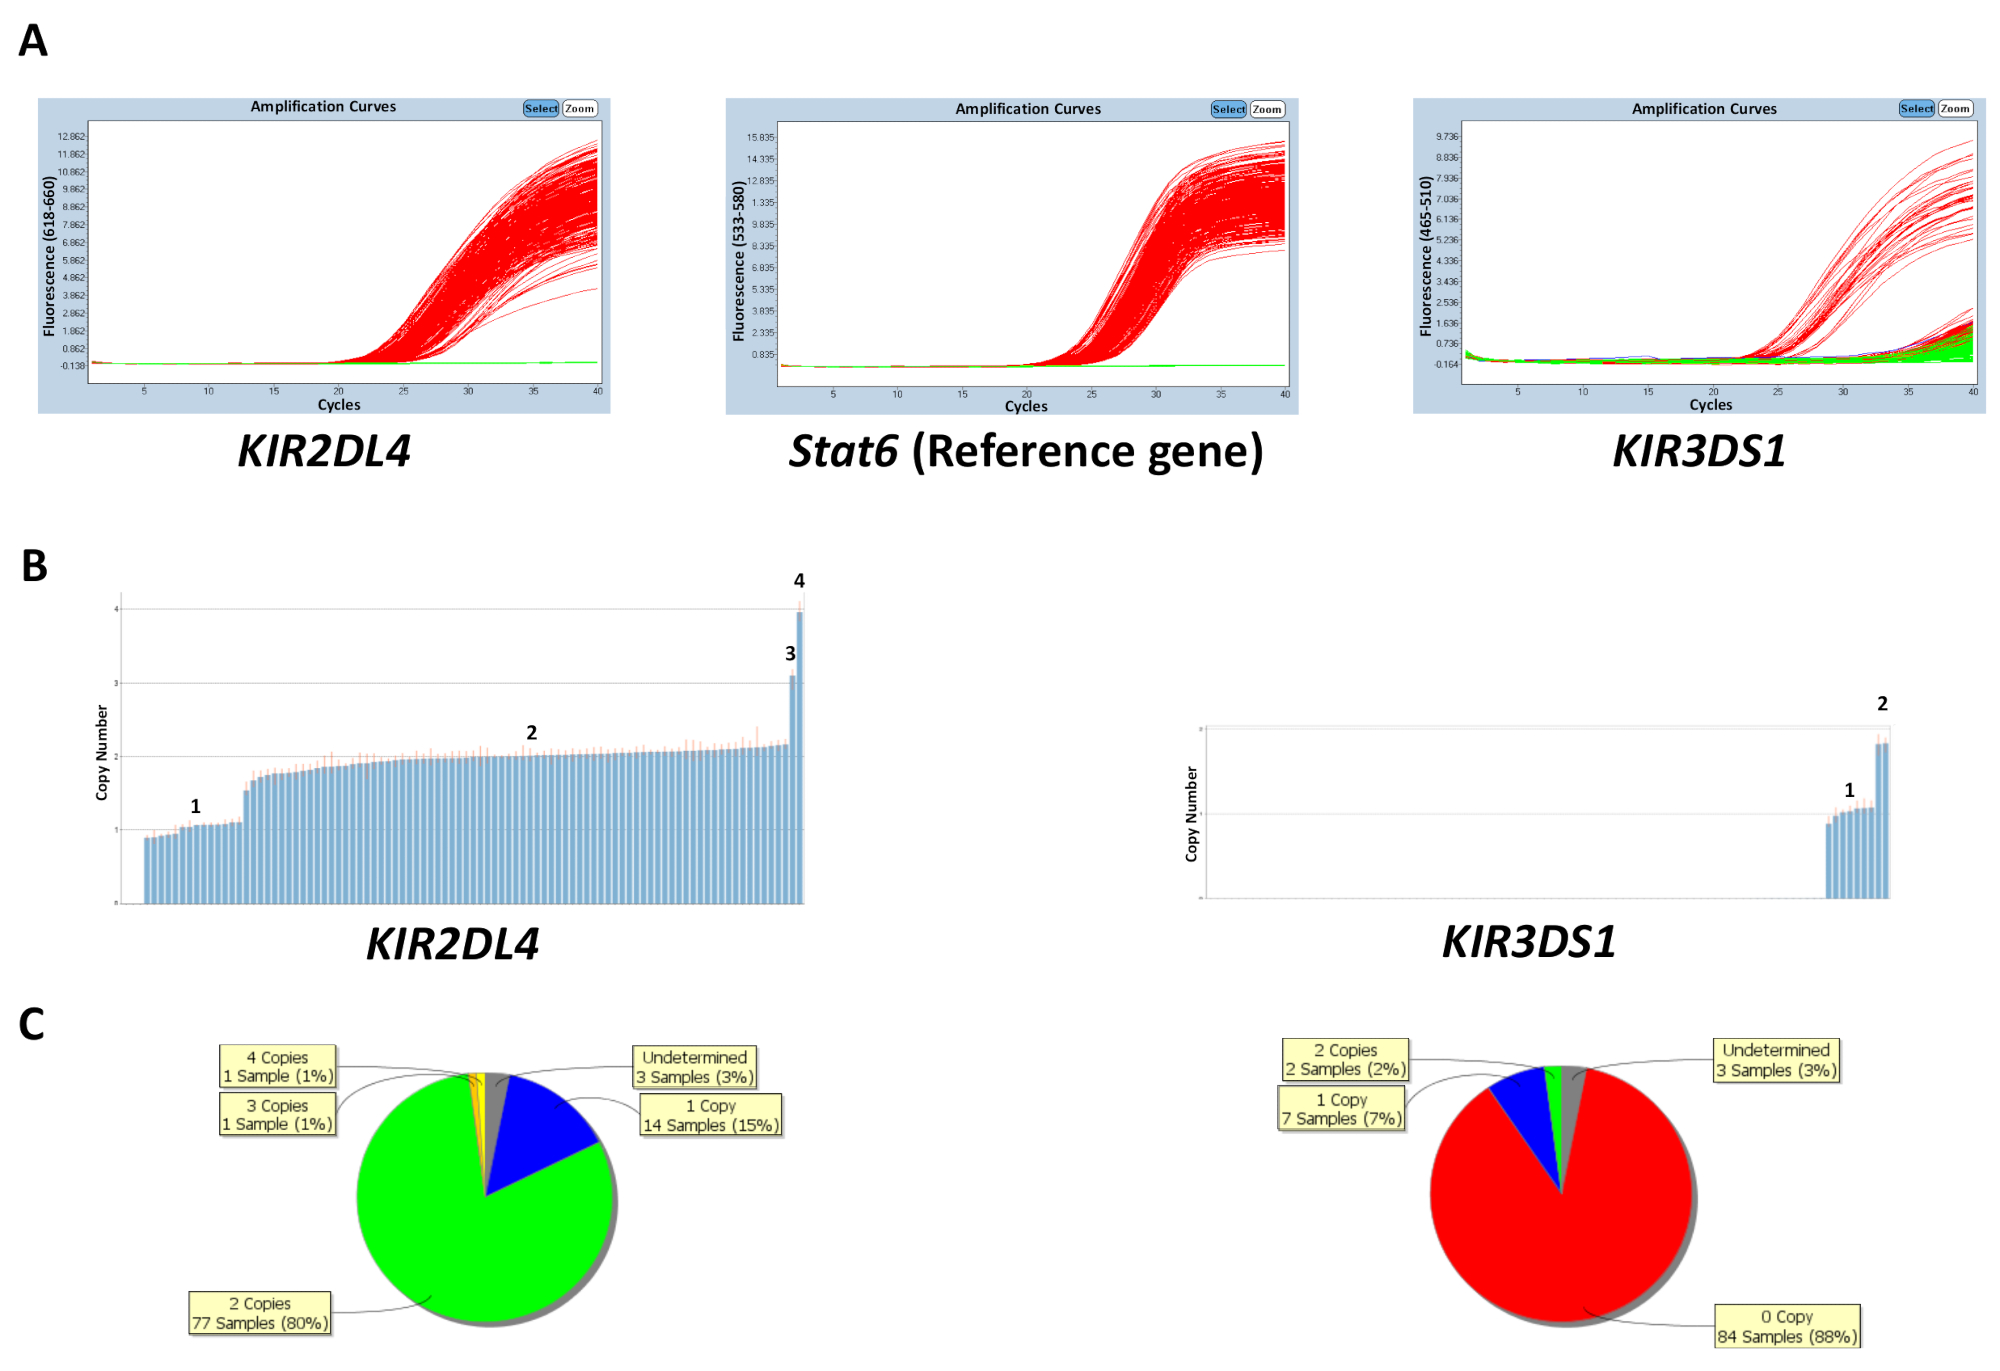
Copy number analysis can be carried out by exporting the files to the copy number analysis software, which provides the predicted and estimated copy number based on the ΔΔCq method.
The copy number can be predicted either based on the known copy number of control DNA samples on the plate or by inputting the most frequent gene copy number (Table 5). Figure 1 shows the results of a plate for a reaction that targets KIR2DL4 and KIR3DS1, as well as the reference gene STAT6. The most frequent copy number for KIR2DL4, a framework gene in the KIR locus, is two copies, whereas the most frequent copy number for KIR3DS1, an activating gene, is one copy. The results in the figure show the PCR amplification plots observed on the qPCR software and the copy number data generated from the qPCR data. As shown, the assay is able to distinguish between 0, 1, 2, 3, and 4 KIR gene copy numbers. The copy number analysis software also enables a viewing of the distribution of the copy number across the plate as a pie chart or a bar graph. The efficacy of the copy number prediction is lower for samples with a higher copy number.
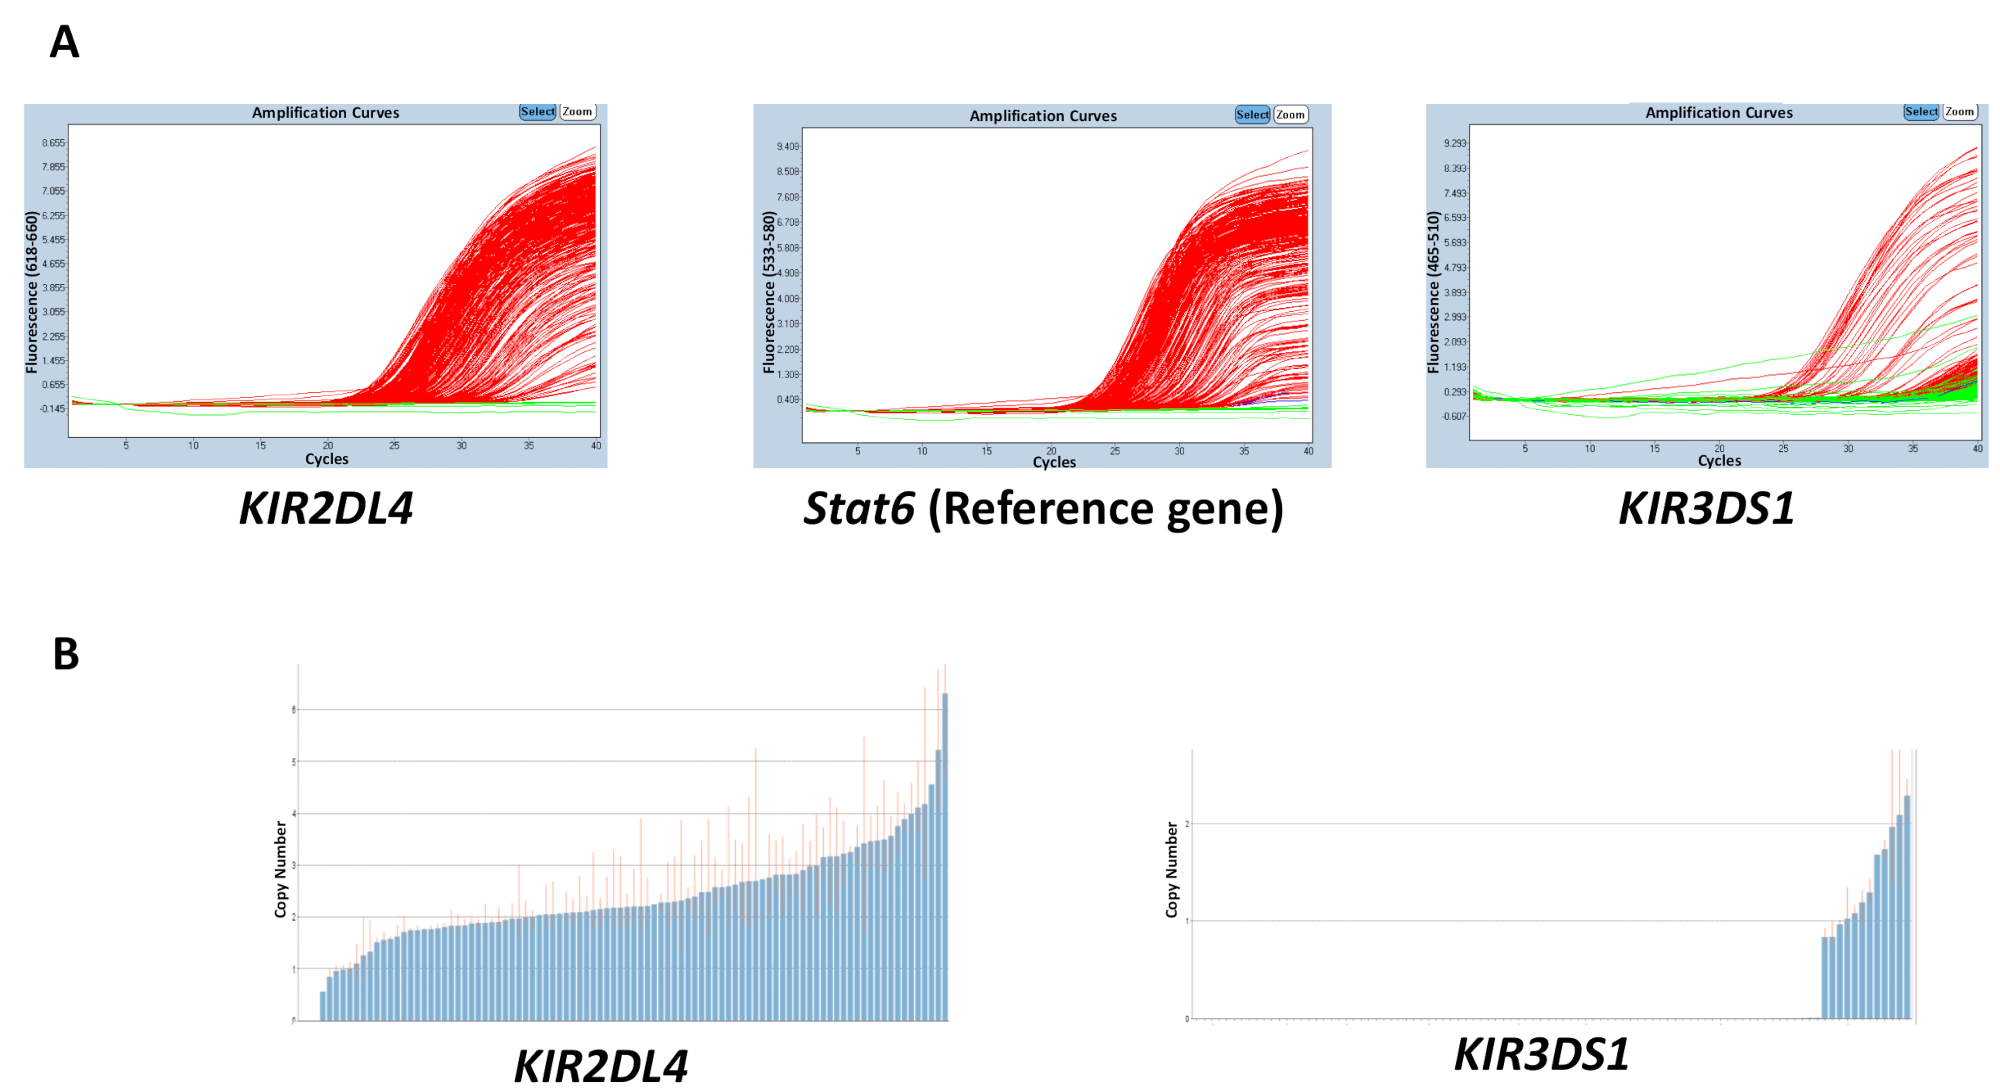
The quality of all the materials used in the reactions, gDNA, buffer, primers, and probes, can affect the accuracy of the results obtained. However, discordance in results is most likely to be caused due to variation in the concentration of DNA across a plate. The purity of the extracted gDNA, which can be measured using the 260/280 and 260/230 ratios, can also have an effect on the quality. A 260/280 ratio of 1.8 - 2 and a 260/230 ratio of 2 - 2.2 are desirable. An uneven range of DNA concentrations across a plate can lead to a high variability in the threshold cycle (Ct) between samples and discordance in the range of the estimated copy number. The results in Figure 2 show the effect the disparity between the Ct values across a plate can have on the accuracy in the prediction of the copy number. The red line indicates the range of the estimated copy number for a sample and, ideally, should be as close to an integer as possible.
The copy number data, once analyzed, can be exported as a spreadsheet file in a 96-well format. We used an R script (available on request) to combine the copy number data of all 10 plates that are run as a set into one spreadsheet. Published data about KIRs from mostly European-origin populations enables the prediction of LD rules that exist between various genes in the KIR complex1. These predictions are used to conduct downstream checks on the copy number results obtained (Table 6). Samples that do not conform to the predicted LD between the genes might contain unusual polymorphism or haplotypic structural variations. A flowchart describing the protocol is shown in Figure 3.
A tool called KIR Haplotype Identifier (http://www.bioinformatics.cimr.cam.ac.uk/haplotypes/) was developed to facilitate the imputation of haplotypes from the data set. The imputation works on the basis of a list of reference haplotypes observed in a European-origin population1. However, the tool also allows for a custom set of reference haplotypes to be used instead. Three separate files are generated; the first file lists all haplotype combinations for a sample, the second file provides a trimmed list of the haplotypes combinations that have the highest combined frequencies, and the third file lists the samples that cannot be assigned haplotypes. Non-assignment of haplotypes could be used as an indicator of novel haplotypes.

Figure 1: Representative results of a plate for reaction number 5. (A) This panel shows amplification plots. (B) This panel shows copy number plots. (C) This panel shows the copy number distribution. Please click here to view a larger version of this figure.

Figure 2: Representative results of a plate with a variable DNA concentration for reaction number 5. (A) This panel shows amplification plots. (B) This panel shows copy number plots. Please click here to view a larger version of this figure.

Figure 3: Flowchart of the qKAT protocol. Please click here to view a larger version of this figure.
| Assay | Genes | Forward Primers | Concentration (nM) | Reverse Primers | Concentration (nM) | Probes | Concentration (nM) |
| No 1 | 3DP1 | A4F | 250 | A5R | 250 | P4a | 150 |
| 2DL2 | 2DL2F4 | 400 | C3R2 | 600 | P5b | 150 | |
| STAT6 | STAT6F | 200 | STAT6R | 200 | PSTAT6 | 150 | |
| No 2 | 2DS2 | A4F | 400 | A6R | 400 | P4a | 200 |
| 2DL3 | D1F | 400 | D1R | 400 | P9 | 150 | |
| STAT6 | STAT6F | 200 | STAT6R | 200 | PSTAT6 | 150 | |
| No 3 | 3DL3 | A8F | 500 | A8R | 500 | P4a | 150 |
| 2DS4Del | 2DS4Del | 250 | 2DS4R2 | 250 | P5b | 150 | |
| STAT6 | STAT6F | 200 | STAT6R | 200 | PSTAT6 | 150 | |
| No 4 | 3DL1e4 | B1F | 250 | B1R | 125 | P4b | 150 |
| 3DL1e9 | D4F | 250 | D4R2 | 500 | P9 | 150 | |
| STAT6 | STAT6F | 200 | STAT6R | 200 | PSTAT6 | 150 | |
| No 5 | 3DS1 | B2F | 250 | B1R | 250 | P4b | 150 |
| 2DL4 | C1F | 200 | C1R | 200 | P5b-2DL4 | 150 | |
| STAT6 | STAT6F | 200 | STAT6R | 200 | PSTAT6 | 150 | |
| No 6 | 2DL1 | B3F | 500 | B3R | 125 | P4b | 150 |
| 2DP1 | D3F | 250 | D3R | 500 | P9 | 150 | |
| STAT6 | STAT6F | 200 | STAT6R | 200 | PSTAT6 | 150 | |
| No 7 | 2DS1 | B4F | 500 | B4R | 250 | P4b | 150 |
| 2DL5 | D2F | 500 | D2R | 500 | P9 | 150 | |
| STAT6 | STAT6F | 200 | STAT6R | 200 | PSTAT6 | 150 | |
| No 8 | 2DS3 | B5F | 250 | B5R | 250 | P4b | 150 |
| 3DL2e9 | D4F | 250 | D5R | 125 | P9 | 150 | |
| STAT6 | STAT6F | 200 | STAT6R | 200 | PSTAT6 | 150 | |
| No 9 | 3DL2e4 | A1F | 200 | A1R | 200 | P4a | 150 |
| 2DS4FL | 2DS4FL | 250 | 2DS4R2 | 500 | P5b | 150 | |
| STAT6 | STAT6F | 200 | STAT6R | 200 | PSTAT6 | 150 | |
| No 10 | 2DS5 | B6F2 | 200 | B6R3 | 200 | P4b | 150 |
| 2DS4 | C5F | 250 | C5R | 250 | P5b | 150 | |
| STAT6 | STAT6F | 200 | STAT6R | 200 | PSTAT6 | 150 |
Table 1: Combination and concentration of primers and probes used in each qKAT reaction27.
| Reaction | Primer Aliquots (µL) | Probe Aliquots (µL) | |||||||||
| R1 | 3DP1 | A4F | A5R | 2DL2F4 | C3R2 | WATER | STAT6F | STAT6R | P4A | P5B | PSTAT6 |
| 2DL2 | 100 | 100 | 160 | 240 | 200 | 80 | 80 | 60 | 60 | 60 | |
| R2 | 2DS2 | A2F | A6R | D1F | D1R | WATER | STAT6F | STAT6R | P4A | P9 | PSTAT6 |
| 2DL3 | 160 | 160 | 160 | 160 | 160 | 80 | 80 | 80 | 60 | 60 | |
| Note: need 20 µL less water in the MasterMix | |||||||||||
| R3 | 3DL3 | A8F A8FB | A8R | 2DS4DELF | 2DS4R2 | WATER | STAT6F | STAT6R | P4A | P5B | PSTAT6 |
| 2DS4DEL | 100 100 | 200 | 100 | 100 | 200 | 80 | 80 | 60 | 60 | 60 | |
| R4 | 3DL1E4 | B1F | B1R | D4F | D4R2 | WATER | STAT6F | STAT6R | P4B | P9 | PSTAT6 |
| 3DL1E9 | 100 | 50 | 100 | 200 | 350 | 80 | 80 | 60 | 60 | 60 | |
| R5 | 3DS1 | B2F | B1R | C1F | C1R | WATER | STAT6F | STAT6R | P4B | P5B-2L4 | PSTAT6 |
| 2DL4 | 100 | 100 | 80 | 80 | 440 | 80 | 80 | 60 | 60 | 60 | |
| R6 | 2DL1 | B3F | B3R | D3F | D3R | WATER | STAT6F | STAT6R | P4B | P9 | PSTAT6 |
| 2DP1 | 200 | 50 | 100 | 200 | 250 | 80 | 80 | 60 | 60 | 60 | |
| R7 | 2DS1 | B4F | B4R | D2F | D2R | WATER | STAT6F | STAT6R | P4B | P9 | PSTAT6 |
| 2DL5 | 200 | 100 | 200 | 200 | 100 | 80 | 80 | 60 | 60 | 60 | |
| R8 | 2DS3 | B5F | B5R | D4F | D5R | WATER | STAT6F | STAT6R | P4B | P9 | PSTAT6 |
| 3DL2E9 | 100 | 100 | 100 | 50 | 450 | 80 | 80 | 60 | 60 | 60 | |
| R9 | 3DL2E4 | A1F | A1R | 2DS4WTF | 2DS4R2 | WATER | STAT6F | STAT6R | P4A | P5B | PSTAT6 |
| 2DS4WT | 80 | 80 | 100 | 200 | 340 | 80 | 80 | 60 | 60 | 60 | |
| R10 | 2DS5 | B6F2 | B6R3 | C5F | C5R | WATER | STAT6F | STAT6R | P4B | P5B | PSTAT6 |
| 2DS4TOTAL | 80 | 80 | 100 | 100 | 440 | 80 | 80 | 60 | 60 | 60 | |
Table 2: Volumes (µL) of 100 µM primer/probe stock solutions to make primer and probe combination aliquots.
| Name | Direction | 5´ modification | 3´ modification | Sequence (5'→3') | Length | Tm | GC% | Exon | Position |
| P4a | Sense | FAM | BHQ-1 | TCATCCTGC AATGTTGGT CAGATGTCA | 27 | 60 | 44.4 | 4 | 425-451 |
| P4b | Antisense | FAM | BHQ-1 | AACAGAACC GTAGCATCT GTAGGTCCC T | 28 | 62 | 50 | 4 | 576-603 |
| P5b | Sense | ATTO647N | BHQ-2 | AACATTCCA GGCCGACT TTCCTCTG | 25 | 60 | 52 | 5 | 828-852 |
| P5b-2DL4 | Sense | ATTO647N | BHQ-2 | AACATTCCA GGCCGACT TCCCTCTG | 25 | 61 | 56 | 5 | 828-852 |
| P9 | Sense | ATTO647N | BHQ-2 | CCCTTCTCA GAGGCCCA AGACACC | 24 | 60 | 62.5 | 9 | 1246-1269 |
| PSTAT6 | ATTO550 | BHQ-2 | CTGATTCCT CCATGAGCA TGCAGCTT | 26 | 62 | 50 |
Table 3: List of probes used in qKAT1,27. The fluorescent dyes used at the 5' end of the oligo probes P5b, P5b-2DL4, P9, and PSTAT6 were modified to ATTO dyes.
| Gene | Primers | Direction | Sequence (5´-3´) | Length | Tm | GC% | Exon | Position | Amplicon (bp) | Alleles might be missed | ||
| 3DL2e4 | A1F | Forward | GCCCCTGCTGAA ATCAGG | 18 | 52 | 61.1 | 4 | 399-416 | 179 | 3DL2*008, *021, *027, *038. | ||
| A1R | Reverse | CTGCAAGGACAG GCATCAA | 19 | 53 | 52.6 | 559-577 | 3DL2*048 | |||||
| 3DP1 | A4F | Forward | GTCCCCTGGTGA AATCAGA | 19 | 49 | 52.6 | 4 | 398-416 | 112 | None | ||
| A5R | Reverse | GTGAGGCGCAAA GTGTCA | 18 | 52 | 55.6 | 492-509 | None | |||||
| 2DS2 | A2F | Forward | GTCGCCTGGTGA AATCAGA | 19 | 49 | 52.6 | 4 | 398-416 | 111 | None | ||
| A6R | Reverse | TGAGGTGCAAAG TGTCCTTAT | 21 | 51 | 42.9 | 488-508 | None | |||||
| 3DL3 | A8Fa | Forward | GTGAAATCGGGA GAGACG | 18 | 50 | 55.6 | 4 | 406-423 | 139 | None | ||
| A8Fb | Forward | GGTGAAATCAGG AGAGACG | 19 | 50 | 52.6 | 405-423 | 3DL3*054, 3DL3*00905. | |||||
| A8R | Reverse | AGTTGACCTGGG AACCCG | 18 | 51 | 61.1 | 526-543 | None | |||||
| 3DL1e4 | B1F | Forward | CATCGGTCCCAT GATGCT | 18 | 51 | 55.6 | 4 | 549-566 | 85 | 3DL1*00505, 3DL1*006, 3DL1*054, 3DL1*086, 3DL1*089 | ||
| B1R | Reverse | GGGAGCTGACAA CTGATAGG | 20 | 52 | 55 | 614-633 | 3DL1*00502 | |||||
| 3DS1 | B2F | Forward | CATCGGTTCCAT GATGCG | 18 | 51 | 55.6 | 4 | 549-566 | 85 | 3DS1*047; may pick up 3DL1*054. | ||
| B1R | Reverse | GGGAGCTGACAA CTGATAGG | 20 | 52 | 55 | 614-633 | None | |||||
| 2DL1 | B3F | Forward | TTCTCCATCAGT CGCATGAC | 20 | 52 | 50 | 4 | 544-563 | 96 | 2DL1*020, 2DL1*028 | ||
| B3R | Reverse | GTCACTGGGAGC TGACAC | 18 | 50 | 61.1 | 622-639 | 2DL1*023, 2DL1*029, 2DL1*030 | |||||
| 2DS1 | B4F | Forward | TCTCCATCAGTC GCATGAA | 19 | 51 | 47.4 | 4 | 545-563 | 96 | 2DS1*001 | ||
| B4R | Reverse | GGTCACTGGGAG CTGAC | 17 | 49 | 64.7 | 624-640 | None | |||||
| 2DS3 | B5F | Forward | CTCCATCGGTCG CATGAG | 18 | 53 | 61.1 | 4 | 546-563 | 96 | None | ||
| B5R | Reverse | GGGTCACTGGGA GCTGAA | 18 | 51 | 61.1 | 624-641 | None | |||||
| 2DS5 | B6F2 | Forward | AGAGAGGGGACG TTTAACC | 19 | 50 | 52.6 | 4 | 475-493 | 173 | None | ||
| B6R3 | Reverse | TCCAGAGGGTCA CTGGGC | 18 | 53 | 66.7 | 630-647 | 2DS5*003 | |||||
| 2DL4 | C1F | Forward | GCAGTGCCCAGC ATCAAT | 18 | 52 | 55.6 | 5 | 808-825 | 83 | None | ||
| C1R | Reverse | CCGAAGCATCTG TAGGTCT | 19 | 52 | 52.6 | 872-890 | 2DL4*018, 2DL4*019 | |||||
| 2DL2 | 2DL2F4 | Forward | GAGGTGGAGGCC CATGAAT | 19 | 52 | 57.9 | 5 | 778-796 | 151 | 2DL2*009; 782G changed to A. | ||
| C3R2 | Reverse | TCGAGTTTGACC ACTCGTAT | 20 | 51 | 45 | 909-928 | None | |||||
| 2DS4 | C5F | Forward | TCCCTGCAGTGC GCAGC | 17 | 57 | 70.6 | 5 | 803-819 | 120 | None | ||
| C5R | Reverse | TTGACCACTCGT AGGGAGC | 19 | 52 | 57.9 | 904-922 | 2DS4*013 | |||||
| 2DS4Del | 2DS4Del | Forward | CCTTGTCCTGCA GCTCCAT | 19 | 54 | 57.9 | 5 | 750-768 | 203 | None | ||
| 2DS4R2 | Reverse | TGACGGAAACAA GCAGTGGA | 20 | 53 | 50 | 933-952 | None | |||||
| 2DS4FL | 2DS4FL | Forward | CCGGAGCTCCTA TGACATG | 19 | 53 | 57.9 | 5 | 744-762 | 209 | None | ||
| 2DS4R2 | Reverse | TGACGGAAACAA GCAGTGGA | 20 | 53 | 50 | 933-952 | None | |||||
| 2DL3 | D1F | Forward | AGACCCTCAGGA GGTGA | 17 | 48 | 58.8 | 9 | 1180-1196 | 156 | None | ||
| D1R | Reverse | CAGGAGACAACT TTGGATCA | 20 | 50 | 45 | 1316-1335 | 2DL3*010, 2DL3*017, 2DL3*01801 and 2DL3*01802 | |||||
| 2DL5 | D2F | Forward | CACTGCGTTTTC ACACAGAC | 20 | 52 | 50 | 9 | 1214-1233 | 120 | 2DL5B*011 and 2DL5B*020 | ||
| D2R | Reverse | GGCAGGAGACAA TGATCTT | 19 | 49 | 47.4 | 1315-1333 | None | |||||
| 2DP1 | D3F | Forward | CCTCAGGAGGTG ACATACGT | 20 | 53 | 55 | 9 | 1184-1203 | 121 | None | ||
| D3R | Reverse | TTGGAAGTTCCG TGTACACT | 20 | 50 | 45 | 1285-1304 | None | |||||
| 3DL1e9 | D4F | Forward | CACAGTTGGATC ACTGCGT | 19 | 52 | 52.6 | 9 | 1203-1221 | 93 | 3DL1*061, 3DL1*068 | ||
| D4R2 | Reverse | CCGTGTACAAGA TGGTATCTGTA | 23 | 53 | 43.5 | 1273-1295 | 3DL1*05901, 3DL1*05902, 3DL1*060, 3DL1*061, 3DL1*064, 3DL1*065, 3DL1*094N, 3DL1*098 | |||||
| 3DL2e9 | D4F | Forward | CACAGTTGGATC ACTGCGT | 19 | 52 | 52.6 | 9 | 1203-1221 | 156 | None | ||
| D5R | Reverse | GACCTGACTGTG GTGCTCG | 19 | 54 | 63.2 | 1340-1358 | None | |||||
| STAT6 | STAT6F | Forward | CCAGATGCCTAC CATGGTGC | 20 | 54 | 60 | 129 | |||||
| STAT6R | Reverse | CCATCTGCACAG ACCACTCC | 20 | 54 | 60 | |||||||
Table 4: Sequences of the primers used in qKAT1,27.
| KIR gene | 3DL3 | 2DS2 | 2DL2 | 2DL3 | 2DP1 | 2DL1 | 3DP1 | 2DL4 | 3DL1 EX9 | 3DL1 EX9 | 3DS1 | 2DL5 | 2DS3 | 2DS5 | 2DS1 | 2DS4 Total | 2DS4 FL | 2DS4 DEL | 3DL2 ex4 | 3DL2 EX9 | |
| Most frequent copy number | 2 | 1 | 1 | 2 | 2 | 2 | 2 | 2 | 2 | 2 | 1 | 1 | 1 | 1 | 1 | 2 | 1 | 1 | 2 | 2 | |
Table 5: Most frequent copy number for KIR genes commonly observed in European-origin samples.
| Linkage disequilibrium rules for qKAT based on European populations | Copy number check | |||||||
| 1 | KIR3DL3, KIR3DP1,KIR2DL4 and KIR3DL2 are framework genes present on both haplotypes. | KIR3DL3, KIR3DP1,KIR2DL4 and KIR3DL2 = 2 | ||||||
| 2 | KIR2DS2 and KIR2DL2 are in LD with each other | 2DS2=2DL2 | ||||||
| 3 | KIR2DL2 and KIR2DL3 are alleles of the same gene | 2DL2+2DL3=2 | ||||||
| 4 | KIR2DP1 and KIR2DL1 are in LD with each other | 2DP1=2DL1 | ||||||
| 5 | Exon 4 of KIR3DL1 and KIR3DL2 is equal to exon 9 of KIR3DL1 and KIR3DL2 respectively. | 3DL1ex4=3DL1ex9 AND 3DL2ex4=3DL2ex9 | ||||||
| 6 | KIR3DL1 and KIR3DS1 are alleles | 3DL1+3DS1=2 | ||||||
| 7 | KIR2DS3 and KIR2DS5 are in LD with KIR2DL5 | 2DS3+2DS5=2DL5 | ||||||
| 8 | KIR3DS1 and KIR2DS1 are in LD | 3DS1=2DS1 | ||||||
| 9 | Presence of KIR2DS1 and KIR2DS4Total is mutually exclusive on a haplotype | 2DS1+2DS4TOTAL=2 | ||||||
| 10 | KIR2DS4FL and KIR2DS4del are variants of KIR2DS4TOTAL | 2DS4FL+2DS4DEL=2DS4TOTAL | ||||||
Table 6: Linkage disequilibrium between KIR genes commonly observed in European-origin populations can be used to check copy number data1,27.
Discussion
We described a novel semi-automated high-throughput method, called qKAT, which facilitates copy number typing of KIR genes. The method is an improvement over conventional methods like SSP-PCR, which are low-throughput and can only indicate the presence or absence of these highly polymorphic genes.
The accuracy of the copy number data obtained is dependent on multiple factors, including the quality and concentration-uniformity of the gDNA samples and the quality of the reagents. The quality and accuracy of the gDNA samples across a plate are extremely important since variations in concentration across the plate can result in errors in the calculation of the copy number. Since the assays were validated using European-origin sample sets, data from cohorts from other parts of the world require more thorough checks. This is to ensure that instances of allele dropout or non-specific primer/probe binding are not misinterpreted as copy number variation.
While the assays were designed and optimized to run as high-throughput, they can be modified to run fewer samples. The confidence metric in the copy number analysis software is affected when analyzing fewer samples, but this can be improved if control genomic DNA samples with a known KIR gene copy number are included on the plate and additional sample replicates are included.
For laboratories without liquid/plate-handling robots, master mix can be dispensed using multi-channel pipettes and plates can be manually loaded into the qPCR instrument.
The main aim behind the development of qKAT was to create a simple, high-throughput, high-resolution, and cost-effective method to genotype KIRs for disease association studies. This was successfully achieved since qKAT has been employed in investigating the role of KIR in several large disease association studies, including a range of infectious diseases, autoimmune conditions, and pregnancy disorders4,24,25,26.
Disclosures
The authors have nothing to disclose.
Acknowledgements
The project received funding from the Medical Research Council (MRC), the European Research Council (ERC) under the European Union's Horizon 2020 research and innovation programme (grant agreement No. 695551) and the National Institute of Health (NIH) Cambridge Biomedical Research Centre and NIH Research Blood and Transplant Research Unit (NIHR BTRU) in Organ Donation and Transplantation at the University of Cambridge and in partnership with NHS Blood and Transplant (NHSBT). The views expressed are those of the authors and not necessarily those of the NHS, the NIHR, the Department of Health, or the NHSBT.
Materials
| Name | Company | Catalog Number | Comments |
| REAGENTS | |||
| Oligonucleotides | Sigma | Custom order | SEQUENCES: Listed in Table 4 |
| Probes labelled with ATTO dyes | Sigma | Custom order | SEQUENCES: Listed in Table 3 |
| SensiFAST Probe No-ROX Kit | Bioline | BIO-86020 | − |
| MilliQ water | − | − | − |
| Name | Company | Catalog Number | Comments |
| EQUIPMENT | |||
| Centrifuge with a swinging bucket rotor | Eppendorf(or equivalent) | Eppendorf 5810R or equivalent system | |
| NanoDrop | Thermo Scientific | ND-2000 | |
| OR | |||
| QuBit Fluorometer | Life Technologies | Q33216 | |
| Matrix Hydra | Thermo Scientific | 109611 | |
| LightCycler 480 II Instrument 384-well | Roche | 05015243001 | |
| Twister II Microplate Handler with MéCour Thermal Plate Stacker (MéCour) | Caliper Life Sciences | 204135 | |
| Vortex mixer | Biosan | BS-010201-AAA | |
| Single-channel pipettes (volume range: 0.5–10 µL, 2–20 µL, 20–200 µL, 200–1,000 µL; 1-10 mL) | Gilson(or equivalent) | F144801, F123600, F123615, F123602, F161201 | |
| RNase- and DNase-free pipette tips filtered (10 µL, 20 µL, 200 µL, 1,000 µL, 10 mL) | Starlab (or equivalent) | S1111-3810, S1120-1810, S1120-8810, S1111-6810, I1054-0001 | |
| StarTub PS Reagent Reservoir, 55 mL | STARLAB | E2310-1010 | |
| 50 mL Centrifuge Tube | STARLAB | E1450-0200 | |
| 96-well deep well plate | Fisher Scientific | 12194162 | |
| LC480 384 Multi-well plates | Roche | 04729749001 | |
| LightCycler 480 Sealing Foil | Roche | 04729757001 | |
| Name | Company | Catalog Number | Comments |
| SOFTWARE | |||
| Roche LightCycler 480 Software v1.5 | |||
| Applied Biosystems CopyCaller Software v2.1 | https://www.thermofisher.com/uk/en/home/technical-resources/software-downloads/copycaller-software.html | ||
| KIR haplotype identifier | http://www.bioinformatics.cimr.cam.ac.uk/haplotypes/ |
References
- Jiang, W., et al. Copy number variation leads to considerable diversity for B but not A haplotypes of the human KIR genes encoding NK cell receptors. Genome Research. 22, 1845-1854 (2012).
- Nemat-Gorgani, N., et al. Different Selected Mechanisms Attenuated the Inhibitory Interaction of KIR2DL1 with C2 + HLA-C in Two Indigenous Human Populations in Southern Africa. The Journal of Immunology. 200, 2640-2655 (2018).
- Norman, P. J., et al. Co-evolution of human leukocyte antigen (HLA) class I ligands with killer-cell immunoglobulin-like receptors (KIR) in a genetically diverse population of sub-Saharan Africans. PLoS Genetics. 9, e1003938 (2013).
- Nakimuli, A., et al. Killer cell immunoglobulin-like receptor (KIR) genes and their HLA-C ligands in a Ugandan population. Immunogenetics. 65, 765-775 (2013).
- Bontadini, A., et al. Distribution of killer cell immunoglobin-like receptors genes in the Italian Caucasian population. Journal of Translational Medicine. 4, 1-9 (2006).
- Graef, T., et al. KIR2DS4 is a product of gene conversion with KIR3DL2 that introduced specificity for HLA-A*11 while diminishing avidity for HLA-C. The Journal of Experimental Medicine. 206, 2557-2572 (2009).
- Béziat, V., Hilton, H. G., Norman, P. J., Traherne, J. A. Deciphering the killer-cell immunoglobulin-like receptor system at super-resolution for natural killer and T-cell biology. Immunology. 150, 248-264 (2017).
- Blokhuis, J. H., et al. KIR2DS5 allotypes that recognize the C2 epitope of HLA-C are common among Africans and absent from Europeans. Immunity, Inflammation and Disease. 5, 461-468 (2017).
- Martin, M. P., et al. Epistatic interaction between KIR3DS1 and HLA-B delays the progression to AIDS. Nature Genetics. 31, 429-434 (2002).
- Khakoo, S. I., et al. HLA and NK cell inhibitory receptor genes in resolving hepatitis C virus infection. Science. 305, 872-874 (2004).
- van Bergen, J., et al. KIR-ligand mismatches are associated with reduced long-term graft survival in HLA-compatible kidney transplantation. American Journal of Transplantation. 11, 1959-1964 (2011).
- Hiby, S. E., et al. Association of maternal killer - cell immunoglobulin-like receptors and parental HLA - C genotypes with recurrent miscarriage. Human Reproduction. 23, 972-976 (2008).
- Nakimuli, A., et al. A KIR B centromeric region present in Africans but not Europeans protects pregnant women from pre-eclampsia. Proceedings of the National Academy of Sciences. 112, 845-850 (2015).
- van Bergen, J., et al. HLA reduces killer cell Ig-like receptor expression level and frequency in a humanized mouse model. The Journal of Immunology. 190, 2880-2885 (2013).
- Bachanova, V., et al. Donor KIR B Genotype Improves Progression-Free Survival of Non-Hodgkin Lymphoma Patients Receiving Unrelated Donor Transplantation. Biology of Blood and Marrow Transplantation. 22, 1602-1607 (2016).
- Cooley, S., et al. Donor selection for natural killer cell receptor genes leads to superior survival after unrelated transplantation for acute myelogenous leukemia. Blood. 116, 2411-2419 (2010).
- Barani, S., Khademi, B., Ashouri, E., Ghaderi, A. KIR2DS1, 2DS5, 3DS1 and KIR2DL5 are associated with the risk of head and neck squamous cell carcinoma in Iranians. Human Immunology. 79, 218-223 (2018).
- Vilches, C., Castaño, J., Gómez-Lozano, N., Estefanía, E. Facilitation of KIR genotyping by a PCR-SSP method that amplifies short DNA fragments. Tissue Antigens. 70, 415-422 (2007).
- Ashouri, E., Ghaderi, A., Reed, E. F., Rajalingam, R. A novel duplex SSP-PCR typing method for KIR gene profiling. Tissue Antigens. 74, 62-67 (2009).
- Martin, M. P., Carrington, M. KIR locus polymorphisms: genotyping and disease association analysis. Methods in Molecular Biology. , 49-64 (2008).
- Crum, K. A., Logue, S. E., Curran, M. D., Middleton, D. Development of a PCR-SSOP approach capable of defining the natural killer cell inhibitory receptor (KIR) gene sequence repertoires. Tissue Antigens. 56, 313-326 (2000).
- Houtchens, K. A., et al. High-throughput killer cell immunoglobulin-like receptor genotyping by MALDI-TOF mass spectrometry with discovery of novel alleles. Immunogenetics. 59, 525-537 (2007).
- Livak, K. J., Schmittgen, T. D. Analysis of relative gene expression data using real-time quantitative PCR and the 2-ΔΔCT method. Methods. 25, 402-408 (2001).
- Traherne, J. A., et al. KIR haplotypes are associated with late-onset type 1 diabetes in European-American families. Genes and Immunity. 17, 8-12 (2016).
- Hydes, T. J., et al. The interaction of genetic determinants in the outcome of HCV infection: Evidence for discrete immunological pathways. Tissue Antigens. 86, 267-275 (2015).
- Dunphy, S. E., et al. 2DL1, 2DL2 and 2DL3 all contribute to KIR phenotype variability on human NK cells. Genes and Immunity. 16, 301-310 (2015).
- Jiang, W., et al. qKAT: A high-throughput qPCR method for KIR gene copy number and haplotype determination. Genome Medicine. 8, 1-11 (2016).
Reprints and Permissions
Request permission to reuse the text or figures of this JoVE article
Request PermissionThis article has been published
Video Coming Soon
Copyright © 2025 MyJoVE Corporation. All rights reserved