Method Article
4D Microscopy: Unraveling Caenorhabditis elegans Embryonic Development Using Nomarski Microscopy
In This Article
Summary
Here, we present a protocol for preparing and mounting Caenorhabditis elegans embryos, recording development under a 4D microscope and tracing cell lineage.
Abstract
4D microscopy is an invaluable tool for unraveling the embryonic developmental process in different animals. Over the last decades, Caenorhabditis elegans has emerged as one of the best models for studying development. From an optical point of view, its size and transparent body make this nematode an ideal specimen for DIC (Differential Interference Contrast or Nomarski) microscopy. This article illustrates a protocol for growing C. elegans nematodes, preparing and mounting their embryos, performing 4D microscopy and cell lineage tracing. The method is based on multifocal time-lapse records of Nomarski images and analysis with specific software. This technique reveals embryonic developmental dynamics at the cellular level. Any embryonic defect in mutants, such as problems in spindle orientation, cell migration, apoptosis or cell fate specification, can be efficiently detected and scored. Virtually every single cell of the embryo can be followed up to the moment the embryo begins to move. Tracing the complete cell lineage of a C. elegans embryo by 4D DIC microscopy is laborious, but the use of specific software greatly facilitates this task. In addition, this technique is easy to implement in the lab. 4D microscopy is a versatile tool and opens the possibility of performing an unparalleled analysis of embryonic development.
Introduction
4D microscopy is a multifocal time-lapse recording system that allows researchers to register and quantify the cell dynamics of a biological sample both spatially and over time. Cell cultures, yeasts or living tissues can be subjected to 4D analysis but this technique is especially suited for analyzing the development of living embryos. The resolution of this analysis reaches the level of every single cell of the embryo. Each cell division can be detected, and cell movements can be traced over time. Cell fates are assessed according to the position and shape that cells acquire. The use of Nomarski optics enhances the contrast of unstained transparent samples using orthogonally polarized light beams that interfere at the focal plane. The resulting images appear three-dimensional, illuminated on one side.
Other methods based on the use of confocal microscopy and GFP transgenic animals for automatic detection of nuclei and generation of cell lineages have been developed1,2. The advantage of those systems is obvious: the software greatly overrides the need for manually marking each nucleus over a period of time (although some manual supervision is required during the late stages). However, cellular processes involving changes in cell shape or membrane dynamics, such as those occurring during cell differentiation, migration, apoptosis or corpse engulfment, remain hidden as a black background in the fluorescent-labeled nuclei images.
In contrast, 4D Nomarski microscopy (also called DIC microscopy, Differential Interference Contrast microscopy) shows both nuclei and cell shape changes that occur during the development of wild type or mutant animals. This allows cell lineage tracing using standard microscopes, employing only transmitted light. There is no general need to use transgenic animals except to show specific expression patterns, in which case fluorescent scans can be intercalated. Therefore, this could be the optimal approach for many labs working on dynamic cell processes such as embryogenesis or apoptosis that can be highlighted under DIC microscopy3,4,5,6,7.
Several flexible and user-friendly programs are available for capturing microscopic images and reconstructing cell lineages, 3D models, cell migration paths, etc. in the recorded sample. In a standard experiment, images are acquired in a series of focal planes, at a constant distance, the number of which depends on the sample thickness. Temporal resolution of the analysis can be optimized by increasing scan frequency. There is virtually no limit for the duration of the recording other than computer storage capacity. For example, for a C. elegans embryo development analysis, we routinely acquire images on 30 focal planes (1 micron-step each), every 30 seconds for 12 hours.
These systems have been applied to the analysis of several animal embryos such as Caenorhabditis elegans8,9,10, Drosophila melanogaster11, other nematode embryos12,13, tardigrades14,15 and even early mouse embryos16. The only requirement is having a transparent embryo able to develop on the slide preparation under the microscope.
In summary, DIC based 4D microscopy is especially useful for 1) analyzing embryonic development of small, transparent animals: tracing cell lineage, cell migration paths, generating 3D models, etc; 2) defining gene expression patterns; 3) studying cell culture dynamics, from yeast to human cells; 4) analyzing tissue dynamics or embryo fragments; 5) quantifying cell death kinetics and corpse engulfment; and 6) performing comparative phylogeny analysis based on embryonic developmental characteristics. If there is interest in any of these topics (or similar ones), 4D microscopy can be used.
Protocol
1. Grow C. elegans on Petri dishes
- Prepare NGM plates and seed them with E. coli OP50 as the food source (Figure 1). Grow and maintain C. elegans as described17. Store seeded plates at 4 °C for up to one month.
- Adjust the plates to the desired temperature before adding the worms.
- To transfer the worms, remove a chunk of agar from an old plate and place it on a fresh plate.
- Alternatively, capture single animals with a sterile worm picker (a 1-inch piece of 32-gauge platinum wire with a flattened tip, mounted onto the tip of a Pasteur pipette) and place them on the new plate.
- Grow the worms at the desired temperature.
- Grow C. elegans worms at 20 °C, the standard temperature. However, to analyze the development of thermo-sensitive mutants, perform an overnight incubation, usually at 25 °C. Adjust the duration and temperature of this incubation as needed, depending on the specific mutant.
2. Prepare the 4D microscopy recording before mounting the embryos (Figure 2)
- Set up the microscope and temperature controls before preparing the embryo. C. elegans embryos divide very quickly. Be prepared to begin recording immediately after mounting the embryos.
- Adjust the recording temperature to either 15 °C, 20 °C or 25 °C.
- Routinely record the embryos at 25 °C. Record thermo-sensitive mutants at the restrictive temperature to show their phenotypes. Record a WT control (if done in a different preparation) at the same temperature as the mutants.
NOTE: WT embryos develop faster at 25 °C and slower at 15 °C without additional differences in cell lineage. Place microscopes in a temperature-controlled room. Additional control by cooling or heating the slide is highly desirable. This can be achieved by circulating water at a specific temperature through a metal ring around the microscope objective and condenser. The objective and the preparation are in direct contact through the immersion oil and the temperature transfer is efficient. This system allows for precise control of the recording temperature and for performing temperature shifts during embryo development.
- Routinely record the embryos at 25 °C. Record thermo-sensitive mutants at the restrictive temperature to show their phenotypes. Record a WT control (if done in a different preparation) at the same temperature as the mutants.
- Define the record parameters in the microscopy software.
- For a standard C. elegans recording (without fluorescent scans), select:
z-stacks of 30 focal planes, at a distance of 1 micron each.
30 second intervals between the beginning of each z-stack.
1500 z-stacks (12.5 hours of record).
NOTE: Both commercial as well as open source microscope control programs can be used to define this workflow for capturing images. Now the microscope is ready to record.
- For a standard C. elegans recording (without fluorescent scans), select:
3. Prepare and mount the embryos
- Prepare a thin, homogeneous agar pad as the first step in obtaining a nice image (Figure 3).
- Prepare 50 ml of a 4.5% agar solution in deionized water. Heat to boiling in the microwave and pour 0.5 – 1 ml into 3 ml glass tubes.
- Carefully seal the tubes with wax film to avoid desiccation. Sealed agar tubes can be stored at room temperature for up to two months.
- On the lab bench, have a heat block at 80 °C with:
a test tube of pure petroleum jelly (melted), with a fine paint brush inside.
a test tube with distilled water containing a Pasteur pipette.
NOTE: This ensures that all the required materials will be hot, and the agar will not solidify in the process of making the pad. - Remove the wax film from the top of one of the agar tubes, and carefully heat it over an alcohol burner to melt the agar. Exercise caution as hot agar expelled from the glass tube could cause burns.
- Once the agar is melted, place the tube in the heat block to keep the agar in liquid form.
- Alternatively, place the agar tubes into the heat block 1h before the experiment to melt them without using a burner. The melted agar should be discarded after one day.
- Place a microscope slide (Slide A) between two others on a piece of plastic.
- Take another slide (Slide B) and hold it with your fingers in one hand.
- With the other hand, place a small drop of melted agar in the center of Slide A using the warm Pasteur pipette.
- Immediately press slide B onto the agar drop to create a very thin pad between Slides A and B. Keep these slides sandwiched together until step 3.2.3.
- Mount the embryos.
- Collect 5-10 gravid hermaphrodites with the picker and place them in a watchmaker glass filled with water.
- Use a scalpel to cut open the hermaphrodite nematodes and extract early eggs (1-4 cells) from the uterus, under the stereomicroscope.
- Take the slide from step 3.1.10 and gently slip Slide B off to expose the agar pad on Slide A.
- Place an early egg in the center of the agar pad by pipetting with a capillary tube.
- Alternatively, pipette a drop containing a set of embryos onto the agar pad and then search for early-stage embryos. Do this step under the stereomicroscope.
- If necessary, move the egg by nudging it with an eyelash glued to the end of a toothpick.
- Remove excess water with the capillary pipette.
NOTE: A capillary pipette can easily be prepared by heating a Pasteur pipette over an alcohol burner and pulling it from both ends. - Carefully cover the preparation with a coverslip. To avoid air bubbles, place one edge of the coverslip on the slide and gently slide a scalpel along the adjacent edge to slowly and obliquely drape the coverslip onto the preparation.
- Use a pipette to fill 3/4 of the space surrounding the agar pad with water. Leave 1/4 of the space with air.
- Seal the coverslip with petroleum jelly to avoid desiccation during long recording periods.
- Use the fine brush to extend a thin layer of melted petroleum jelly around the edge of the coverslip.
NOTE: Now the preparation is ready for recording.
4. Adjust the DIC and start the 4D microscopy recording
- Place the slide on the microscope stage. Focus the embryo using the low magnification objective (5x or 10x).
- Change to the 100x immersion objective.
- Adjust the optical components of the microscope to get a Nomarski image.
- Focus the condenser.
- Completely open the aperture of the condenser and close the field diaphragm (this will provide a higher numerical aperture and therefore, greater resolution).
- Check that both polarizers on the microscope are oriented to cause the maximum light extinction.
- Turn the Wollaston prism to get a nice three-dimensional image of the embryo, illuminated on one side. Turn the prism in the other direction to get the effect of having the embryo illuminated on the other side.
NOTE: These steps can be performed on a test sample before the recording so that only fine tuning is required on the specimen being analyzed.
- Launch the image capture in the microscope.
5. Analyze the 4D-movie (Figure 4).
NOTE: Once the recording is complete, use cell lineage tracing software to reconstruct and analyze cell lineage.
Cell lineage tracing software is a powerful tool for performing detailed analyses of embryonic development or dynamics in cell cultures or tissue fragments. The program extracts and quantifies several data sets on the sample’s cellular dynamics that include generation of the complete cell lineage of each and every recorded cell, including cell divisions, cell cycle length, migration or apoptosis as well as its kinetics. In addition, cell differentiation can be scored by the cell’s morphological changes or by expression of specific markers. Basically, the software screen displays two windows: on the left window, the 4D movie can be played forward and backward or up and down to either the top or bottom levels so that each cell can be followed in time and space throughout the recording. On the right widow, the cell lineage is generated. Clicking on a cell nucleus in the 4D movie generates a point in the lineage window that stores the information of the cell name, fate and spatial coordinates. The cell lineage of a specific cell is generated by playing the 4D movie forward and clicking periodically on the nucleus to mark the mitosis of that specific cell over time. Repetition of this process for each of the recorded cells generates the complete cell lineage of the embryo or sample. The stored information for spatial coordinates of each cell is later used to reconstruct 3D embryo models and cell migration paths.
- Open the lineage tracing software and create a new project by going to the upper bar menu and selecting:
File | New project. - Select the cell lineage template depending on the recording temperature: DB08 for recording at 25 °C, DB10 for recording at 20 °C and DB12 for recording at 15 °C.
- Set the recording parameters in the emerging window: scan count (usually 1500), time between scans (30 seconds), level count (30) and distance between levels (1 micron).
- Select the image file and format.
- Select the image directory where the images were saved.
- Choose whether images should be saved as single images (one image per level and time) or as multi-image z-stacks.
- Determine the file naming and image format. Routinely, single images are saved under the following names:
X0000L00C1 (for scan 0, level 0, channel 1)
X0000L01C1 (for scan 0, level 1, channel 1)
X0000L02C1 (for scan 0, level 2, channel 1)
...
X0001L00C1 (for scan 1, level 0, channel 1)
X0001L01C1 (for scan 1, level 1, channel 1)
...
X0300L04C1 (for scan 300, level 4, channel 1)
...
NOTE: Saving the images in a compressed format saves space on your hard disk.
- Define the light channels: 1 for DIC optics, 2 for GFP, 3 for RFP, etc. Add those that were used in the 4D-recording. Click on “channel processing enabled” to detect them.
- Start tracing the cell lineage of the embryo. The screen now contains two major windows: the video window and the cell lineage window.
- On the lineage window, select a lineage branch and use the mouse to click the cell nucleus corresponding to this cell on the video window.
- Follow the cell spatially and over time by playing the 4D-movie forward, backward, or up or down a level, using the cursor keys.
- Periodically click on the cell nucleus. This generates a point in the lineage branch and registers the spatial coordinates of the cell at this time. As a result, cell lineage progresses, and 3D reconstructions of the embryo are possible.
- Mark mitosis by clicking the return key. Then select one of the daughter cells and follow it as before.
- Repeat the process (steps 5.6.1 to 5.6.4) for the rest of the embryonic cells to trace the complete cell lineage, or to follow specific cells of interest such as those undergoing apoptosis.
- Compare the mutant lineage with the stereotyped WT C. elegans cell lineage.
Results
To characterize embryonic development of a C. elegans mutant for the gene gsr-1, that encodes the enzyme glutathione reductase, required to regenerate reduced glutathione (GSH) and involved in maintaining redox homeostasis in the nematode, we performed 4D microscopy of a gsr-1 (tm3574) deletion mutant that is a loss of function allele causing an early embryonic arrest phenotype18. Both WT and balanced gsr-1 (tm3574) mutant C. elegans nematodes were grown on NGM plates seeded with E. coli OP50 as the food source17. gsr-1 (tm3574) worms were grown as heterozygous at 20 °C for two generations and then segregating homozygous worms (which are able to grow up to adulthood thanks to the maternal load) were shifted to 25 °C for an overnight incubation prior to embryo analysis. Worm plates were incubated within cardboard boxes to avoid condensation (Figure 1). Gravid nematodes were cut open to extract young embryos.
To compare embryonic development of the mutant versus the stereotyped WT under identical conditions, a WT (as control) and a gsr-1 (tm3574) embryo were placed on the same preparation next to each other. 4D microscopy workflow was run on a standard motorized upright microscope outfitted with DIC optics. The selected recording parameters on the microscope control program were: z-stacks of 30 focal planes at 1 micron distance each, 30 second intervals between the beginning of each z-stack and 1500 z-stacks (12.5 hours of recording). The recording temperature was adjusted to 25 °C (both in the room and on the microscope stage) (Figure 2).
Once the recording was completed, the images file was opened, and cell lineage was reconstructed using lineage tracing software by clicking on cell nuclei shown in the video window (Figure 4). The traced gsr-1 (tm3574) mutant embryonic cell lineage was compared with the C. elegans WT lineage depicted in the background. A major result was the detection of a progressive delay of the cell cycle during embryonic development. As a consequence, mutant embryos arrested at intermediate stages whereas WT embryos progressed and finally hatched as larvae.
Preparation and direct observation of embryos under the microscope or immunostaining with antibodies against late embryonic markers could reveal the presence of a high percentage of young embryos in the mutant compared to the WT. Embryo arrest could then be inferred as the most plausible explanation. However, direct proof and exact quantification of the cell cycle delay can only be elegantly and easily shown and quantified through a 4D microscopy experiment. Other important features of embryonic development such as cell differentiation or apoptosis (Figure 5) can also be visualized in a dynamic way using 4D microscopy which offers a detailed analysis of multiple aspects of development in a single experiment.
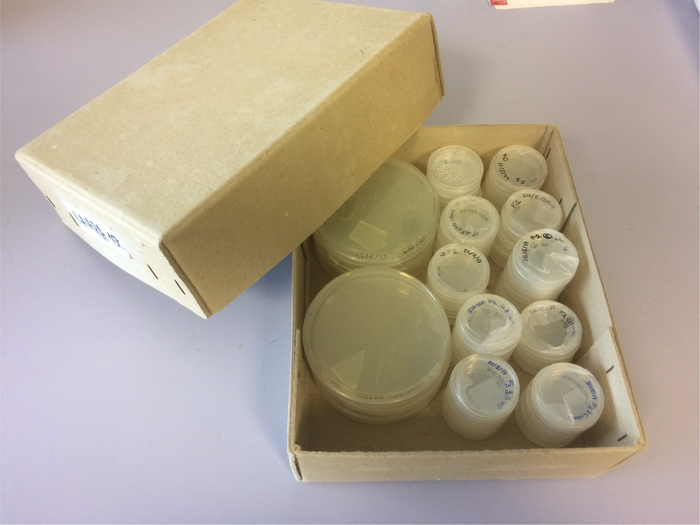
Figure 1: C. elegans nematodes growing under laboratory conditions. Nematodes are grown on E. coli-seeded NGM plates, stored in cardboard boxes and incubated either at 15 °C, 20 °C or 25 °C. Please click here to view a larger version of this figure.
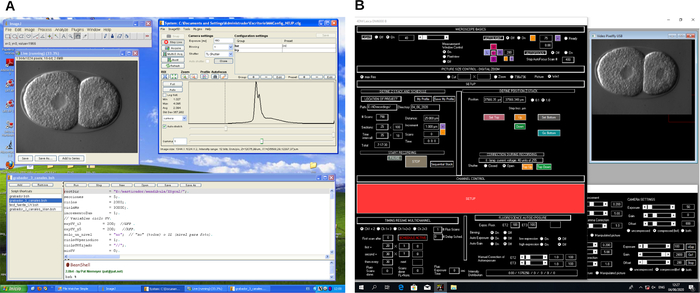
Figure 2: Screenshot of 4D microscopy recording software. Example of two different microscope control software programs (A and B). These programs create workflows to control the microscope and image capturing during 4D microscopy recording. Please click here to view a larger version of this figure.
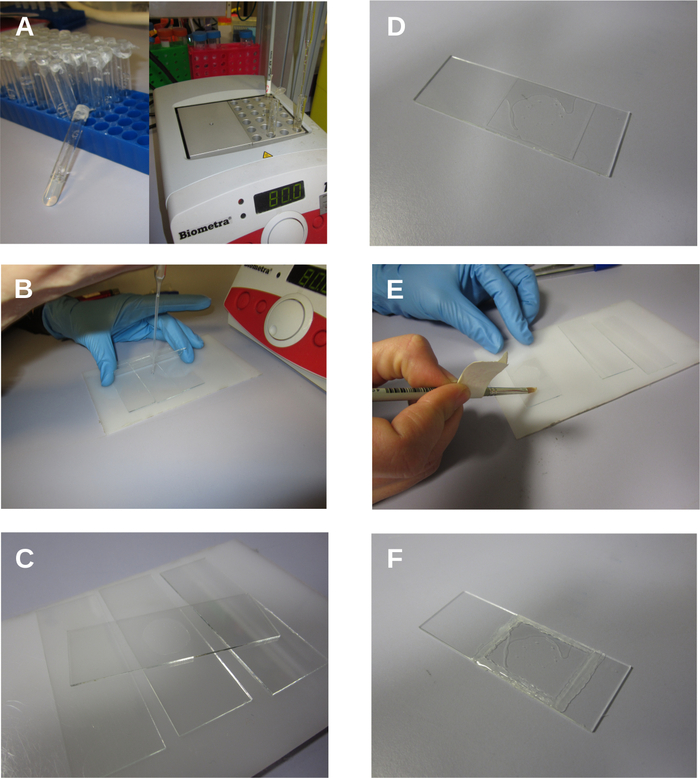
Figure 3: Serial photographs of agar pad preparation and mounting of the C. elegans embryo showing. A. Prepared agar tubes. B-C. Preparation of the agar pad. D. Slide partially filled with water. E. Sealing the slide with petroleum jelly. F. Final preparation. Please click here to view a larger version of this figure.
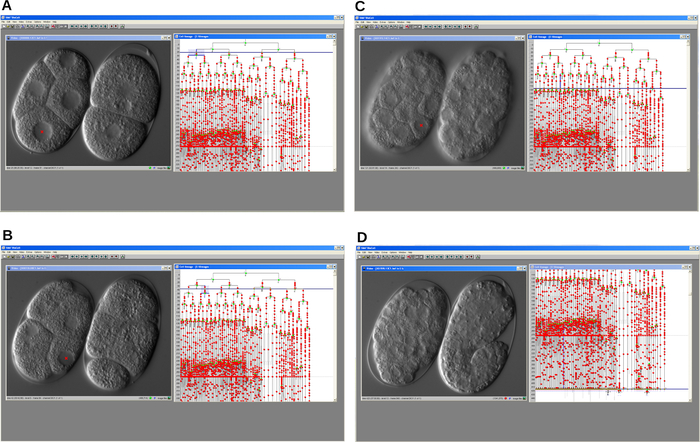
Figure 4: Serial screen shots of cell lineage tracer software. The program allows reconstruction of the embryonic cell lineage of a cell cycle delay mutant (left) and a WT (right) C. elegans embryo. A. An early step of the development. B-C. Development of both embryos progresses over time. D. WT embryo develops properly and starts elongation whereas the mutant arrests. In all cases the program displays the video window and the lineage window. Please click here to view a larger version of this figure.
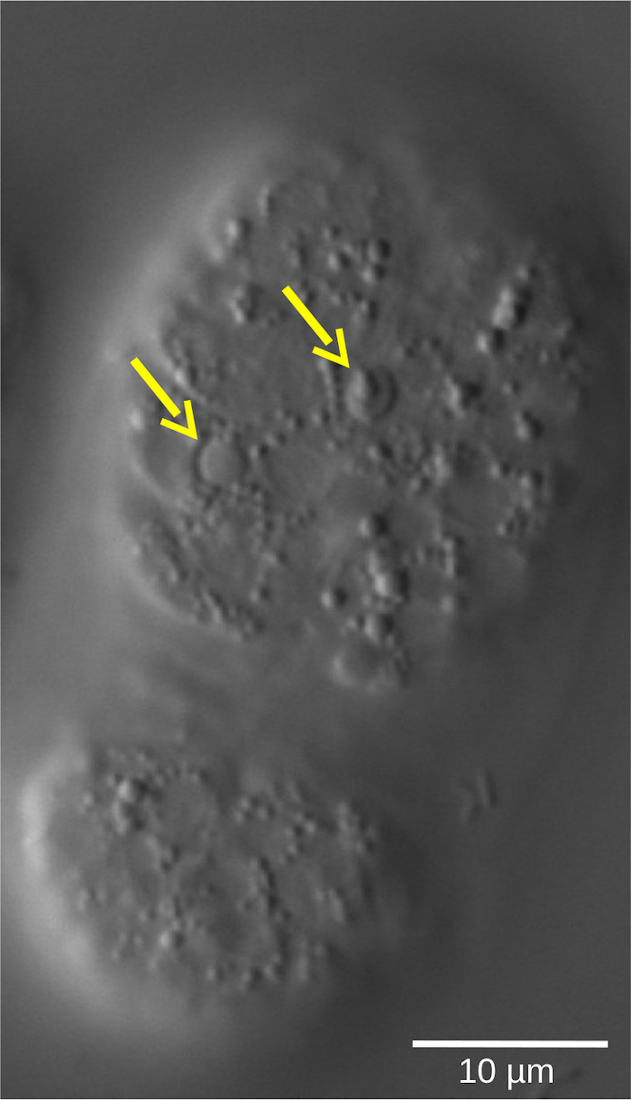
Figure 5: Lentil refractile shape of apoptotic cells in a C. elegans WT embryo. Cell fate, defined by morphological characteristics, can be assessed by 4D microscopy. The image shows a C. elegans embryo in the bean stage. Living cells show smooth-shaped nuclei surrounded by a granular cytoplasm. In contrast, apoptotic cells (yellow arrows) condense and adopt a lentil-like, refractile shape. Please click here to view a larger version of this figure.
Discussion
One of the major challenges in modern biology is understanding the development of multicellular organisms. C. elegans has emerged as one of the best suited models for studying the fine coordination between cell proliferation and cell differentiation in the developing embryo. From an optical point of view, its transparent body and its small size make this nematode an ideal specimen for DIC microscopy. Other organisms with similar characteristics have also been subjected to 4D microscopy analysis11,12,13,14,15,16.
For those developmental studies, gene inactivation by either forward or reverse genetics provides a clue to its involvement in embryogenesis. Once a gene has been proven to play a role in development, the next step is to define its exact role in the establishment of the correct body plan. Immunostaining is the selected approach for most models. This technique elucidates problems in cell differentiation or expression of specific markers. However, a major limitation of this approach is that it only provides a static view of the expression of a single or more markers at a fixed point in development. A dynamic view of these markers throughout development can only be obtained by staining different embryos at different time points. In addition, cell lineage reconstruction is not possible in such fixed samples.
4D microscopy is a complementary approach for studying embryonic development. This technique reveals development dynamics at a cell level resolution. Any defect in the embryo such as problems in spindle orientation, cell migration, apoptosis, cell fate specification, etc. will show up in a 4D movie that can be visualized forward and backward, quantified and scored by the researcher. Using this technique, virtually each and every cell in the embryo can be followed up to the moment that the embryo begins to move. Embryos subjected to 4D microscopy with only visible light and Nomarski optics do not incur photodamage. Fluorescent scans can also be intercalated within the recording to detect when and where a gene is expressed. Embryos that suffer significant photodamage are identified by the cell cycle extension that causes strong UV irradiation compared to a standard WT lineage embryo. In that case, photodamage can be reduced by lowering the UV lamp intensity and increasing camera sensitivity or exposure time. Morphological characteristics and molecular markers can help clarify the embryonic development of any mutant.
Setting up a 4D microscopy system is easy to implement in the lab and, after some practice, enables an unmatched analysis of cell dynamics and lineage tracing of cell cultures and living transparent specimens at a resolution level of each and every cell in the microscope field. Cell lineage tracing on DIC images is still processed by hand. It is time consuming and, although the software detects lineage errors such as different lineage branches marking the same cell, mistakes are possible. While automatic detection of GFP-labeled cells is well developed2, complementary lineage tracing software based on unmarked cells and visible light images is still in the early stage and not really useful for a full embryo analysis. Without any doubt, application of image recognition systems to the field of visible light microscopy will bring about a great advance in this field.
Disclosures
The authors have nothing to disclose.
Acknowledgements
The authors wish to acknowledge support from Rioja Salud Foundation (Fondos FEDER) and the Spanish Ministerio de Ciencia, Innovación y Universidades (MCIU) (Grant PGC2018-094276-B-I00). Cristina Romero Aranda is funded by a fellowship from the AECC (Asociación Española Contra el Cáncer).
Materials
| Name | Company | Catalog Number | Comments |
| Caenorhabditis elegans (N2) | GCG (Caenorhabditis Genetics Center) | N2 | WT C. elegans strain. Can be requested at GCG (Caenorhabditis Genetics Center): https://cgc.umn.edu/ |
| Caenorhabditis elegans (VZ454) | GCG (Caenorhabditis Genetics Center) | VZ454 | gsr-1(tm3574) C. elegans mutant strain. Can be requested at GCG (Caenorhabditis Genetics Center): https://cgc.umn.edu/ |
| Cell Lineage Tracing software | SIMI | Simi BioCell | This is the software to reconstruct the embryo cell lineage. For a detailed explanation check at: http://www.simi.com/en/products/cell-research/simi-biocell.html |
| Microscope camera | Hamamatsu | Orca-R2 | Miscroscope camera for both transmitted and UV light |
| Microscope control software | Caenotec | Time to Live | This software controls the microscope to perform the 4D image capture. Can be requested at: Caenotec Prof. Ralf Schnabel Kleine Dorfstr. 9 38312 Börßum, Germany, Ph: ++49 151 11653356 r.schnabel(at)tu-bs.de |
| Microscope control software | Micro-manager | Micro-manager | This software controls the microscope to perform the 4D image capture. Can be downloaded at: https://micro-manager.org/ |
| Motorized microscope | Leica | Leica DM6000 | Motorized upright microscope to perform 4D microscopy |
| Standard equipment in a Molecular Biology lab. | |||
| Stereomicroscope | Leica | MZ16FA | Steromicroscope to manipulate nematodes and prepare embryos. |
References
- Hardin, J. Imaging embryonic morphogenesis in C. elegans. Methods in Cell Biology. 106, 377-412 (2011).
- Mace, D. L., Weisdepp, P., Gevirtzman, L., Boyle, T., Waterston, R. H. A high-fidelity cell lineage tracing method for obtaining systematic spatiotemporal gene expression patterns in Caenorhabditis elegans. G3: Genes, Genomes, Genetics (Bethesda). 3 (5), 851-863 (2013).
- Nieto, C., et al. ccz-1 mediates the digestion of apoptotic corpses in C. elegans. Journal of Cell Science. 123 (12), 2001-2007 (2010).
- Cabello, J., et al. PDR-1/hParkin negatively regulates the phagocytosis of apoptotic cell corpses in Caenorhabditis elegans. Cell Death & Disease. 5, 1120 (2014).
- Pinto, S. M., Almendinger, J., Cabello, J., Hengartner, M. O. Loss of Acetylcholine Signaling Reduces Cell Clearance Deficiencies in Caenorhabditis elegans. PLOS One. 11 (2), 0149274 (2016).
- Sáenz-Narciso, B., Gómez-Orte, E., Zheleva, A., Gastaca, I., Cabello, J. Control of developmental networks by Rac/Rho small GTPases: How cytoskeletal changes during embryogenesis are orchestrated. Bioessays. 38 (12), 1246-1254 (2016).
- Zheleva, A. Reduction of mRNA export unmasks different tissue sensitivities to low mRNA levels during Caenorhabditis elegans development. PLOS Genetics. 15 (9), 1008338 (2019).
- Schnabel, R., Hutter, H., Moerman, D., Schnabel, H. Assessing normal embryogenesis in Caenorhabditis elegans using a 4D microscope: variability of development and regional specification. Developmental Biology. 184 (2), 234-265 (1997).
- Verbrugghe, K. J. C., Chan, R. C. Imaging C. elegans Embryos using an Epifluorescent Microscope and Open Source Software. Journal of Visualized Experiments. (49), e2625 (2011).
- Boyd, L., Hajjar, C., O'Connell, K. Time-lapse Microscopy of Early Embryogenesis in Caenorhabditis elegans. Journal of Visualized Experiments. (54), e2852 (2011).
- Urbach, R., Schnabel, R., Technau, G. M. The pattern of neuroblast formation, mitotic domains and proneural gene expression during early brain development in Drosophila. Development. 130 (16), 3589-3606 (2003).
- Dolinski, C., Borgonie, G., Schnabel, R., Baldwin, J. G. Buccal capsule development as a consideration for phylogenetic analysis of Rhabditida (Nemata). Development Genes and Evolution. 208 (9), 495-503 (1998).
- Houthoofd, W., Jacobsen, K., Mertens, C., Vangestel, S., Coomans, A., Borgonie, G. Embryonic cell lineage of the marine nematode Pellioditis marina. Developmental Biology. 258 (1), 57-69 (2003).
- Hejnol, A., Schnabel, R. The eutardigrade Thulinia stephaniae has an indeterminate development and the potential to regulate early blastomere ablations. Development. 132 (6), 1349-1361 (2005).
- Hejnol, A., Schnabel, R. What a couple of dimensions can do for you: Comparative developmental studies using 4D microscopy-examples from tardigrade development. Integrative and Comparative Biology. 46 (2), 151-161 (2006).
- Bischoff, M., Parfitt, D. E., Zernicka-Goetz, M. Formation of the embryonic-abembryonic axis of the mouse blastocyst: relationships between orientation of early cleavage divisions and pattern of symmetric/asymmetric divisions. Development. 135 (5), 953-962 (2008).
- Mora-Lorca, J. A. Glutathione reductase gsr-1 is an essential gene required for Caenorhabditis elegans early embryonic development. Free Radical Biology and Medicine. 96, 446-461 (2016).
Reprints and Permissions
Request permission to reuse the text or figures of this JoVE article
Request PermissionThis article has been published
Video Coming Soon
Copyright © 2025 MyJoVE Corporation. All rights reserved