A subscription to JoVE is required to view this content. Sign in or start your free trial.
Method Article
Collection, Expansion, and Differentiation of Primary Human Nasal Epithelial Cell Models for Quantification of Cilia Beat Frequency
In This Article
Summary
This protocol describes nasal epithelial cell collection, expansion, and differentiation to organotypic airway epithelial cell models and quantification of cilia beat frequency via live-cell imaging and custom-built scripts.
Abstract
Measurements of cilia function (beat frequency, pattern) have been established as diagnostic tools for respiratory diseases such as primary ciliary dyskinesia. However, the wider application of these techniques is limited by the extreme susceptibility of ciliary function to changes in environmental factors e.g., temperature, humidity, and pH. In the airway of patients with Cystic Fibrosis (CF), mucus accumulation impedes cilia beating. Cilia function has been investigated in primary airway cell models as an indicator of CF Transmembrane conductance Regulator (CFTR) channel activity. However, considerable patient-to-patient variability in cilia beating frequency has been found in response to CFTR-modulating drugs, even for patients with the same CFTR mutations. Furthermore, the impact of dysfunctional CFTR-regulated chloride secretion on ciliary function is poorly understood. There is currently no comprehensive protocol demonstrating sample preparation of in vitro airway models, image acquisition, and analysis of Cilia Beat Frequency (CBF). Standardized culture conditions and image acquisition performed in an environmentally controlled condition would enable consistent, reproducible quantification of CBF between individuals and in response to CFTR-modulating drugs. This protocol describes the quantification of CBF in three different airway epithelial cell model systems: 1) native epithelial sheets, 2) air-liquid interface models imaged on permeable support inserts, and 3) extracellular matrix-embedded three-dimensional organoids. The latter two replicate in vivo lung physiology, with beating cilia and production of mucus. The ciliary function is captured using a high-speed video camera in an environment-controlled chamber. Custom-built scripts are used for the analysis of CBF. Translation of CBF measurements to the clinic is envisioned to be an important clinical tool for predicting response to CFTR-modulating drugs on a per-patient basis.
Introduction
Measurements of Cilia Beat Frequency (CBF) and pattern have been established as diagnostic tools for respiratory diseases such as Primary Ciliary Dyskinesia (PCD)1. In Cystic Fibrosis (CF), dysfunction of the CF Transmembrane conductance Regulator (CFTR) chloride channel causes dehydration of the airway surface liquid and impaired mucociliary clearance2. Ciliary function has been investigated in vitro in primary airway cell models as an indicator of CFTR channel activity3. However, considerable patient-to-patient variability exists in CBF in response to CFTR-modulating drugs, even for patients with the same CFTR mutations3. Furthermore, the impact of dysfunctional CFTR-regulated chloride secretion on ciliary function is poorly understood. There is currently no comprehensive protocol demonstrating sample preparation of in vitro airway models, image acquisition, and analysis of CBF.
Nasal epithelial sheets isolated from nasal mucosal brushings are directly used for measurements of ciliary function for PCD diagnosis4. Yet, while there is no control over the size or quality of the nasal epithelial sheets obtained, CBF varies depending on whether it is measured on single cells or cell sheets and on epithelial sheet ciliated edges that are disrupted or undisrupted5. As such, secondary dyskinesias caused by damage to cells during the collection of nasal mucosal brushings may influence CBF. Primary cell culture of nasal epithelial cells and their differentiation at Air-Liquid Interface (ALI) or in three-dimensional basement membrane matrix into ciliated airway epithelial organoids give rise to cilia that are free from secondary dyskinesias4,6,7,8. Airway epithelial cells differentiated at ALI (henceforth termed ALI models) have been deemed an important secondary diagnostic aid that replicate the ciliary beat patterns and frequency of ex vivo nasal mucosal brushings6 and enable analysis of ciliary ultrastructure, beat pattern, and beat frequency while retaining patient-specific defects9. Yet, discrepancies exist in the methodologies used to create these pseudostratified, mucociliary differentiated cell models. Different culture expansion or differentiation protocols could induce distinct epithelial phenotypes (ciliated or secretory)10 and result in significant differences in CBF11. CBF has been quantified in nasal epithelial brushings4,6,12,13,14,15,16, airway epithelial organoids14,17,18 and ALI models3,4,6,13,19,20,21. Yet, amongst these protocols, there are large variabilities, and often many parameters are not controlled for. For example, in some studies, CBF is imaged in situ while the cells of the ALI model remain on the permeable support insert3,19,20,21, yet others scrape the cells from the permeable support insert and image them suspended in media4,6,13.
Furthermore, the wider application of techniques that measure ciliary function is limited by the extreme susceptibility of ciliary function to changes in environmental factors. Environmental factors such as temperature22, humidity23,24, and pH25,26 influence ciliary function and must be regulated to quantify CBF accurately. The various physiological parameters used across different laboratories and how they influence CBF has been reviewed previously27.
Various imaging technologies and approaches to CBF measurements are reported in the literature. For PCD diagnostics, video microscopy is used to measure ciliary function28,29. Recently, a video analysis algorithm based on differential dynamic microscopy was used to quantify both CBF and cilia coordination in airway epithelial cell ALI models3,30. This method enables the characterization of ciliary beating in airway epithelial cells in a fast and fully automated manner, without the need to segment or select regions. Various methods for imaging and quantification of CBF may add to the differences reported in CBF in the literature (Supplementary File 1).
A protocol from culture to quantification to streamline existing methods, standardization of culture conditions, and image acquisition, performed in strict environmentally controlled conditions, would enable consistent, reproducible quantification of CBF within and between individuals.
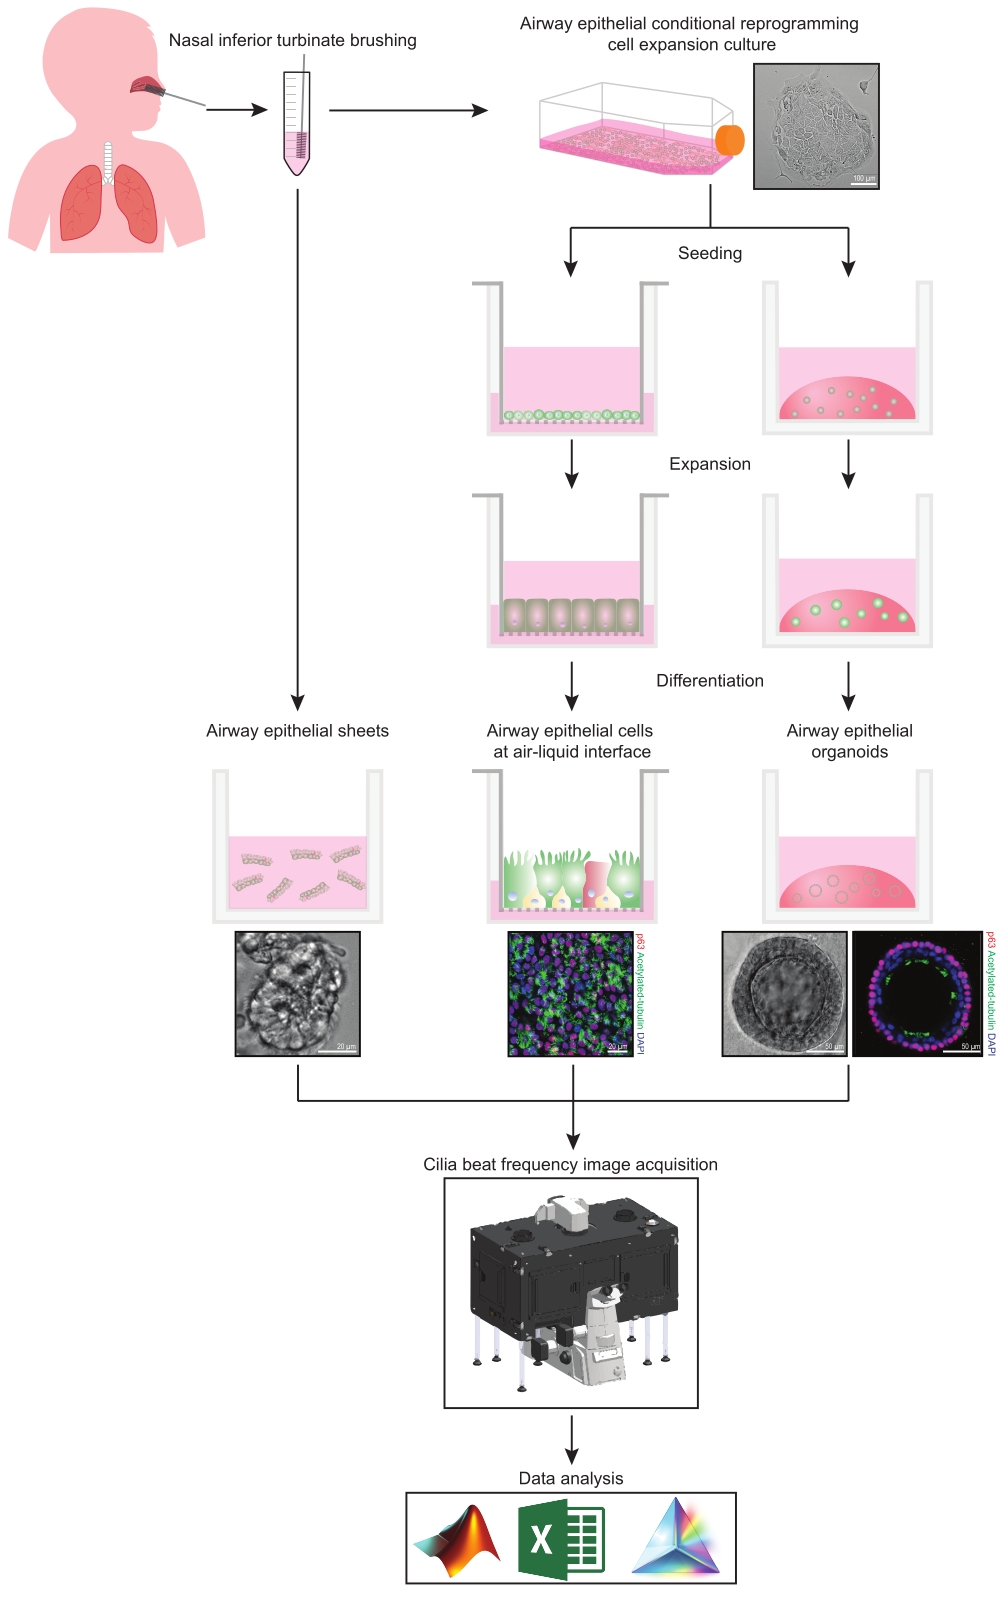
This protocol provides a complete description of the collection of epithelial cells, expansion and differentiation culture conditions, and quantification of CBF in three different airway epithelial cell model systems of nasal origin: 1) native epithelial sheets, 2) ALI models imaged on permeable support inserts and 3) Extracellular Matrix (ECM)-embedded three-dimensional organoids (Figure 1). Nasal epithelial cells obtained from nasal inferior turbinate brushings are used as representatives of the airway epithelium since they are an effective surrogate for bronchial epithelial cells31 while overcoming the invasive procedure associated with collecting bronchial brushings. The Conditional Reprogramming Cell (CRC) method is used to expand primary airway epithelial cells for the creation of ALI models and three-dimensional organoids. Conditional reprogramming of airway epithelial cells to a stem cell-like state is induced by co-culture with growth-arrested fibroblast feeder cell system and Rho-associated kinase (ROCK) inhibitor32. Importantly, the CRC method increases population doubling in airway epithelial cells while retaining their tissue-specific differentiation potential33,34. In all airway epithelial cell models, the ciliary function is captured in a temperature-controlled chamber using a high-speed video camera with standardized image acquisition settings. Custom-built scripts are employed for the quantification of CBF.

Figure 1: Schematic of workflow. Following brushing the participants' nasal inferior turbinate, airway epithelial cells are utilized in one of two ways. Either airway epithelial sheets are isolated, and cilia beat frequency is imaged immediately, or airway epithelial cells are expanded via the conditional reprogramming cell method. CRC-expanded airway epithelial cells are differentiated to establish airway epithelial cells at an air-liquid interface or airway epithelial organoid cultures. Imaging of ciliary beat frequency is acquired using a live-cell imaging microscope with a heating and humidity environmental chamber and a fast frame rate (>100Hz) scientific camera. Data analysis is performed using custom-built scripts. Please click here to view a larger version of this figure.
Protocol
Study approval was received from the Sydney Children's Hospital Network Ethics Review Board (HREC/16/SCHN/120). Written consent was obtained from all participants (or participants' guardian) prior to the collection of biospecimens.
1. Preparations for establishing airway epithelial cell models
- Prepare nasal cell collection media by combining 80% Dulbecco's Modified Eagle Medium and 20% Fetal Bovine Serum. Supplement with 1 µL/mL of Penicillin/Streptomycin. Store at 4 °C for up to 3 months.
- Coat the flasks or permeable support inserts with Collagen solution on a per-need basis following steps 1.2.1-1.2.4. Do not store collagen-coated vessels long-term.
- Make a 1:100 dilution of Type I Collagen solution (3 mg/mL stock) with phosphate-buffered saline (PBS) to an end concentration of 0.03 mg/mL. Mix well.
- Coat the cell culture flasks (section 4) with 160 µL/cm2 (i.e., 4 mL per T25 flask) and permeable support inserts (section 5) with 455 µL/cm2 (i.e., 150 µL per 6.5 mm insert) of the prepared Collagen solution.
- Incubate at 37 °C for 2-24 h.
- Remove the Collagen solution by pipette or vacuum aspirator prior to seeding cells. Do not wash the vessel prior to seeding cells.
- Prepare Conditional Reprogramming Cell (CRC) media by combining components32 listed in Table 1. Filter sterilize using a bottle-top vacuum filter system. Store at 4 °C for up to 2 months.
- On the day of use, add human epidermal growth factor, ROCK inhibitor and antibiotics as indicated in Table 1.
| Component | Volume |
| DMEM, high glucose | 156.7 mL |
| DMEM/F-12, HEPES | 313.3 mL |
| Hydrocortisone | 55.6 µL |
| Insulin | 1.25 mL |
| Cholera toxin | 21 µL |
| Adenine | 1.2 mL |
| HI-FBS | 25 mL |
| Penicillin-Streptomycin | 5 mL |
| Human epidermal growth factor | 1 µL/mL |
| ROCK inhibitor | 1 µL/mL |
| Fungizone | 2 µl/ml |
| Tobramycin | 2 µL/mL |
| Ceftazidime hydrate | 4 µL/mL |
| Gentamicin solution | 1 µL/mL |
Table 1: Components for 500 mL of conditional reprogramming cell media
2. Collection of nasal inferior turbinate brushings
NOTE: This section of the protocol requires a collection tube (50 mL) with nasal cell collection media, cytology brushes, tissues, and appropriate Personal Protective Equipment. Avoid brushing during an upper respiratory tract infection. There is a small risk of bleeding, which is increased if inflammation is present. If the purpose of the brushing is to obtain airway epithelial sheets for ex vivo CBF measurements brushing should occur a minimum of 6 weeks post any upper respiratory infection; ideally, more than 10 weeks post infection35.
- Prepare the nasal cell collection media (section 1) and keep the tube on ice.
- Describe the procedure to the participant as uncomfortable. Explain that a full sensation is felt in the nostril during the brushing, similar to jumping into the ocean/pool and water rushing into the nasal passage. Advise participants that the procedure will induce the production of tears as a reflex.
- Assess which positioning is appropriate for the participant. Lay the participant in supine position if an examination couch is available since supine positioning prevents movement of the participant's head away from the brush during the procedure. Alternatively, seat the participant next to a wall, which they can press their head back against.
- Inspect the nasal passage. Note septal deviation, polyps, and any other anatomical abnormalities that may affect the passage of the brush in the nasal passage and increase bleeding risk.
- Clean the nose of excess mucus by asking participants to blow their nose into a tissue.
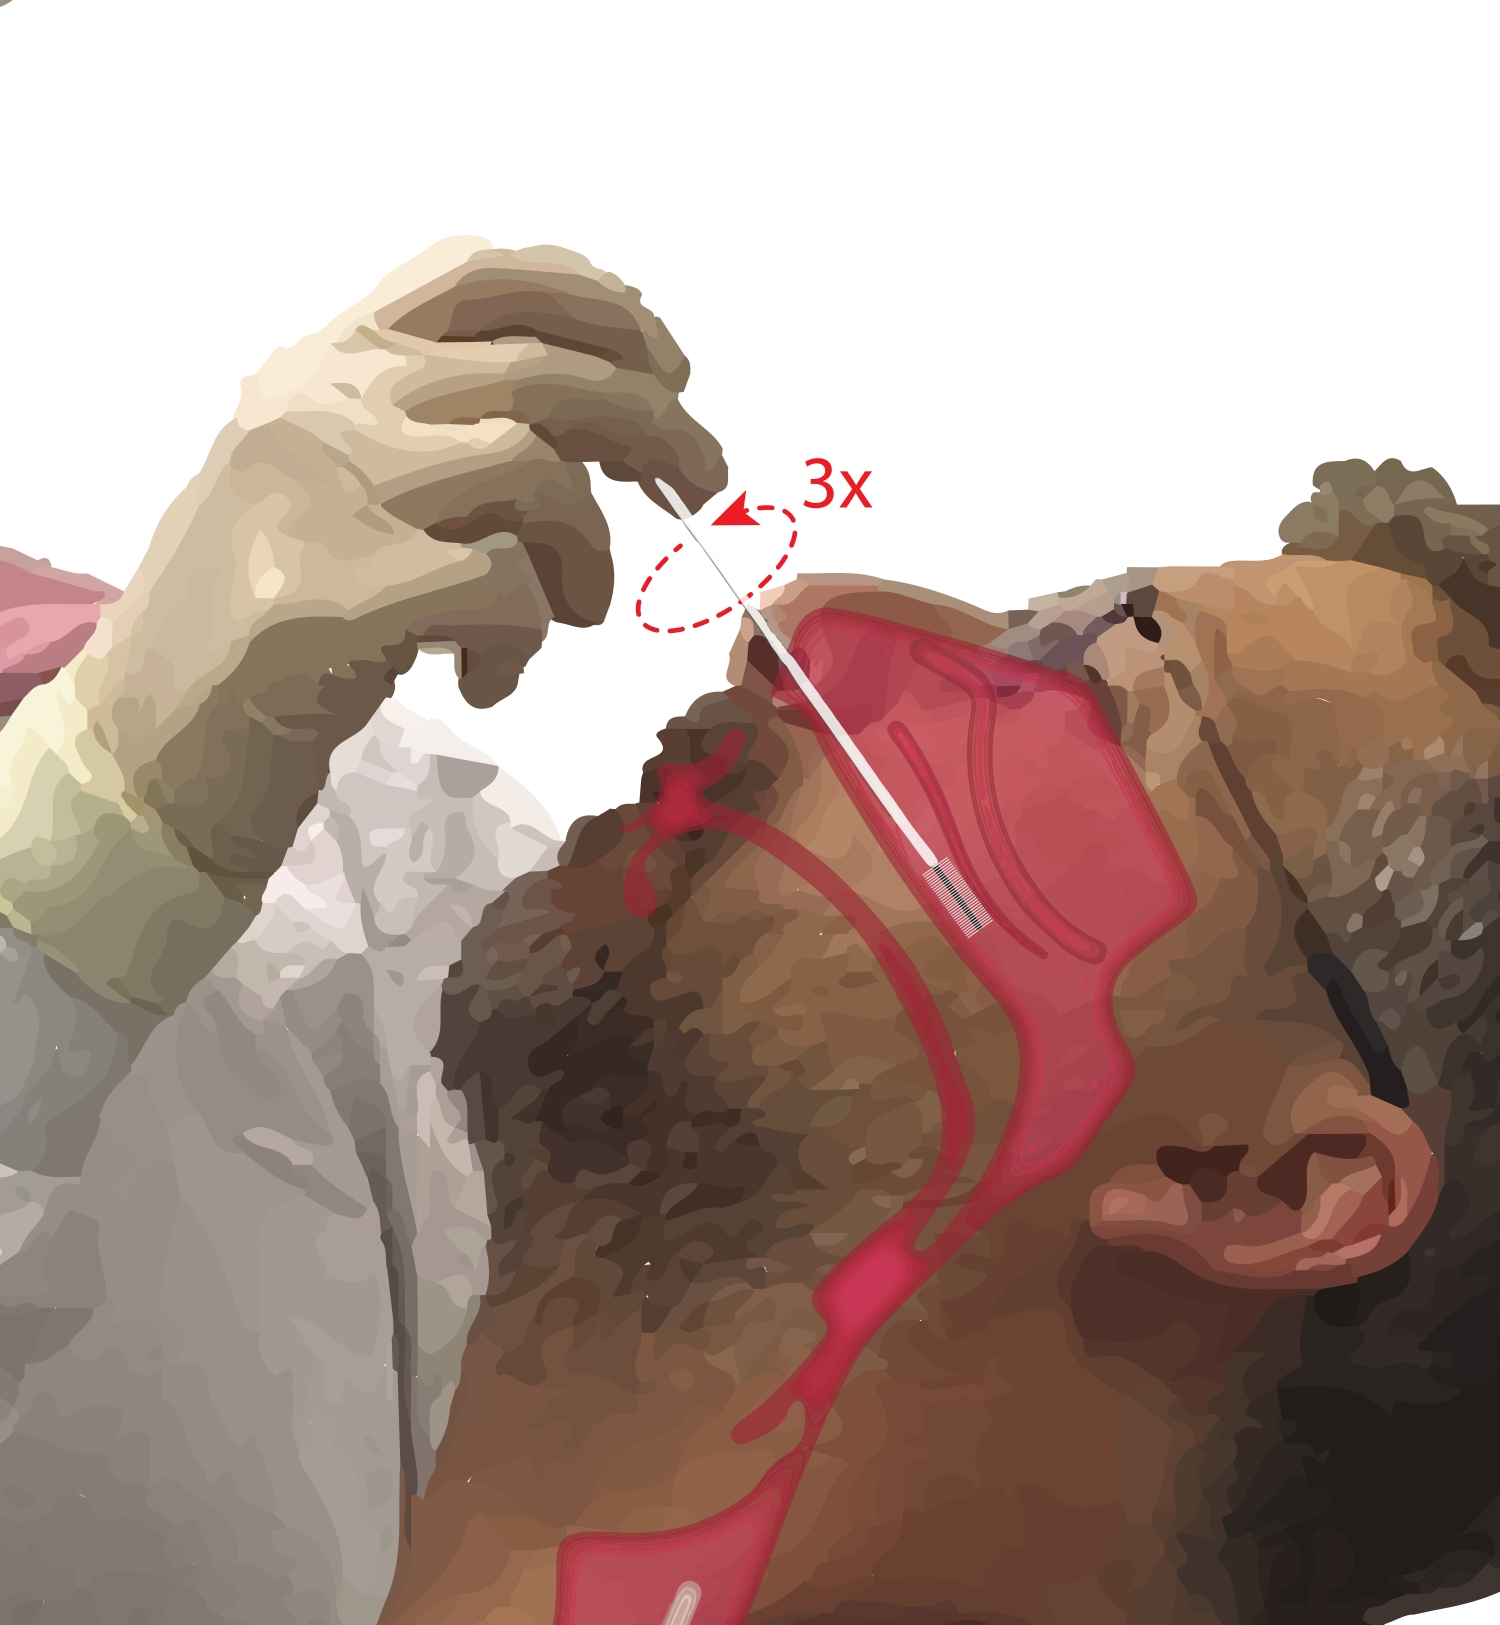
- Ask the participant to breathe through their mouth. Take a cytology brush in the dominant hand. While resting the fifth digit on the participant's chin to anchor the hand, insert the cytology brush into the participant's nasal passage (Figure 2). Insert the brush at ~45° to the participant's face to pass through the nasal meatus.
- Pivot the brush upright so that it is perpendicular to the participant's face. Advance the brush gently but firmly against the lateral wall of the nose beneath the inferior turbinate until it is at the mid to posterior part of the inferior turbinate.
NOTE: Avoid over-insertion; if a sudden drop in resistance is felt, the nasal pharynx has been entered, and the brush should be retracted until resistance is again felt by the proceduralist. - Rotate the brush 360° up to three times. Remove the brush gently in reverse of the insertion maneuver, so cells are not dislodged from the brush.
- Place the brush into the prepared collection tube with nasal cell collection media. Place the collection tube on ice.
- Repeat the brushing in the second nostril if the participant is agreeable/a large number of cells are required (e.g., to initiate cell culture).
NOTE: The same nostril can be brushed again if there were no visible blood cells on the brush, noting, however, that the risk of bleeding is slightly increased with a second brushing in the same nostril.

Figure 2: Collection of nasal epithelial cells. Illustration of the location of the cytology brush at the mid to posterior part of the inferior turbinate. This position is reached by inserting the brush through the nares, pivoting the brush to a 90° angle to the face and guiding the brush along the nasal passage below the inferior turbinate. Please click here to view a larger version of this figure.
3. Preparation of airway epithelial sheets
NOTE: This section of the protocol requires collection tube (cytology brush(es) + 1 mL of nasal cell collection media) (section 2) and 96-well flat-bottomed plate. If collecting nasal turbinate brushings for the purpose of imaging airway epithelial sheets, only use 1 mL of antibiotic-free nasal cell collection media; otherwise, epithelial sheets will be too dispersed for imaging.
- Gently swirl the collection tube containing the cytology brush(es) to dislodge the airway epithelial sheets from the brush(es).
- Collect all media and cells with a P1000 pipette. Dispense 5-6 drops into a well of a 96-well flat-bottomed plate. Repeat for approximately seven wells.
- Transfer plate to the microscope as per step 7.1.4 and follow the remainder of section 7 to image cilia beat frequency.
- Image epithelial sheets (Figure 1) and not single unattached cells since it has been demonstrated that ciliary function differs between epithelial sheets and single unattached cells5.
4. Airway epithelial cell expansion and maintenance
- Airway epithelial conditional reprogramming cell expansion culture
NOTE: Collagen solution coated vessel (section 1), Irradiated mouse embryonic feeder cells (NIH-3T3), Conditional Reprogramming Cell (CRC) media (section 1), cytology brush(es) in nasal cell collection media (section 2).- Plate irradiated feeder cells into prepared Collagen solution coated culture vessel(s) at a seeding density of 8,000 cells/cm2 at least 2 h and no more than 72 h prior to co-culture with airway epithelial cells (see36 for feeder cell culture and irradiation).
- Transfer the brushed cells in the collection tube (cytology brush(es) + nasal cell collection media) to the vortex on ice. On a low speed, vortex tube 10 s on, 10 s off (keep on ice in between) to dislodge cells from the brush(es). Vigorous vortexing may decrease cell viability. Inspect the brush(es) to check if the mucus is still adhered. If so, repeat the vortexing.
- Transfer the tube(s) on ice back to the biosafety cabinet. Use a serological pipette to transfer the media from the collection tube to a new tube (Tube B), leaving behind the cytology brushes. Centrifuge Tube B at 300 × g for 7 min at 4 °C.
- Remove Tube B from the centrifuge, discard the supernatant. If the mucus is visible, wash the pellet with another 5 mL of nasal cell collection media and centrifuge again.
- Add 1 mL of CRC media to resuspend the cell pellet in Tube B. Using a 5 mL serological pipette, pass cells through a cell sieve placed on top of a 50 mL tube (Tube C) in a circular motion.
- Repeat multiple times to form a single cell suspension. Collect the residual media from the bottom of the sieve and incorporate it with the media. Discard the cell sieve.
- Using a 5 mL serological pipette, take 1 mL of media from Tube C and transfer it into a microcentrifuge tube.
- Take 10 µL of this cell suspension and add it to the microcentrifuge tube pre-aliquoted with 10 µL trypan blue. Mix well and immediately use an automated cell counter to record cell count and viability.
- Seed the airway epithelial cells into the T25 flask pre-seeded with irradiated feeder cells.
- Airway epithelial cell maintenance and dissociation
NOTE: CRC media must be warmed to 37 °C by placing it in a temperature-controlled laboratory water bath or a bead bath device before it is added to the cells.- Check cells under the cell culture microscope (4× objective lens) regularly for attachment, contamination, morphology, and confluence.
- Change CRC media every second day. When reprogrammed cells are observed (Figure 1) and there is no contamination present, reduce or withdraw antibiotics.
- When cells reach 90% confluency, use a double trypsin method32 to dissociate the cells and perform a cell count as described in step 4.1.8 (refer to Supplementary File 2 for cell dissociation and freezing).
5. Seeding and differentiation of airway epithelial cells and maintenance of differentiated ALI models
- Seeding airway epithelial cells to permeable support inserts
- Transfer the Collagen solution coated permeable support inserts (section 1) from the CO2 incubator to the biosafety cabinet. Aspirate the Collagen solution and discard. Add 750 µL expansion medium (antibiotic-free) to the basal compartment of the permeable support inserts.
- Transfer the dissociated cells or thawed cells on ice to the biosafety cabinet. Add the volume of expansion medium needed to seed 200,000-250,000 cells in 150 µL to the apical compartment of each permeable support insert.
- Being careful not to create bubbles; mix well to ensure the cells are homogenous and in suspension. Add 150 µL of the cell suspension to the apical side of each permeable support insert.
- Resuspend the cells after seeding every three permeable support inserts to maintain a homogenous cell suspension.
- Every second day until a confluent cell monolayer is formed (usually by Day 4 post seeding), discard the media and add fresh expansion medium warmed to room temperature (RT, 15-25 °C).
- Differentiation of airway epithelial cells at the air-liquid interface
- Warm ALI media (antibiotic-free) to RT (15-25 °C).
- Remove the expansion medium and change to differentiation media (ALI) on both apical and basal compartments.
- After 2 days of culture in submerged ALI media, aspirate and discard the media.
- Add 750 µL of ALI media to the basal compartment only to create an air-liquid interface.
NOTE: If after 1 week of culture, the monolayer is not confluent and holes are still observed, cells may no longer have the capacity to expand into the void regions, consider discarding of the airway epithelial cells.
- Maintenance of differentiated ALI model and mucus removal
- Change the apical and basal media every second day until full differentiation (day 21-25 post air-liquid interface establishment).
- Once per week, wash mucus from the apical side following steps 5.3.3-5.3.4.
- Warm PBS to RT (15-25 °C).
- Add 200 µL of PBS to the apical compartment. Incubate in the CO2 incubator for 10 min. Use an aspiration device or pipette to remove the PBS.
6. Three-dimensional airway epithelial organoids
- Preparations for airway epithelial organoid culture
- Place 24-well plate(s) in a CO2 incubator to warm to 37 °C overnight.
- Thaw a 10 mL vial of ECM (Table of Materials) on ice as per the manufacturer's instructions. Prepare 500 µL aliquots (one-time use) to minimize the number of freeze-thaw cycles.
NOTE: Use ECM with protein concentration >10.5 mg/mL for the best culture outcomes is recommended. Lower concentration will accelerate the disintegration of the ECM dome and increase the occurrence of apical-facing-outwards organoids. - Use the Airway Organoid Kit (Table of Materials) to prepare Airway Organoid Seeding Media (AOSM) and Differentiation Media (AODM) as per the manufacturer's instructions.
- Prepare airway organoid basal media as per Table 2.
| Component | Volume |
| Advanced DMEM/F-12 | 500 mL |
| HEPES | 5 mL |
| Alanyl-glutamine | 5 mL |
| Penicillin-Streptomycin | 5 mL |
Table 2: Components of airway organoid basal media
- Use the number of live airway epithelial cells dissociated in section 4.2 to calculate how many wells can be seeded at a seeding density of 10,000 cells (see Table 3).
- Calculate the total volume of ECM and AOSM needed to create 1 x 50 µL of 90% ECM dome (45 µL of ECM and 5 µL of AOSM) per well.
NOTE: The recommended seeding density of 10,000 cells per well is for CRC-expanded nasal epithelial cells at passage 1. Later passage cells may require higher seeding density to achieve the formation of the same number of organoids.
| Number of wells | Number of cells | Number of domes | Vol of Matrigel ECM | Vol of AOSM |
| 1 | 10,000 cells | 1 | 45 µL x 1.1 | 5 µL x 1.1 |
| 2 | 20,000 cells | 2 | 90 µL x 1.1 | 10 µL x 1.1 |
| 5 | 50,000 cells | 5 | 225 µL x 1.1 | 25 µL x 1.1 |
| ……… | ………cells | ……… | ………µL x 1.1 | ………µL x 1.1 |
Table 3: Calculations for seeding airway epithelial cells in ECM domes
- Seeding airway epithelial cells in ECM domes
NOTE: Keep ECM on ice at all times and perform all steps involving ECM on ice, since ECM will start to solidify at temperatures >10°C.- Resuspend the airway epithelial cells dissociated in section 4.2 with the calculated volume of 90% ECM as per Table 3.
- Holding the pipette at a 90° angle (vertical) as close to the bottom of the well as possible, dispense 50 µL (to the first stop to avoid creating bubbles) of the ECM cell suspension to the center of the well. Avoid touching the wall of the well.
- Incubate plate at 37 °C for 20 min until the ECM solidifies. While the ECM is solidifying, warm AOSM to RT (15-25 °C) to prevent it from causing re-liquification and disintegration of the ECM dome upon addition.
- Add 500 µL of warmed AOSM to each well by dispensing down the wall of the well. Do not pipette media directly onto the ECM dome.
- Change media every 2 days for 4-7 days. To aspirate media, tilt the plate at a 45° angle and aspirate from the bottom edge of the well away from the ECM dome.
- After 4-7 days, initiate organoid differentiation by adding 500 µL of AODM (15-25 °C) to each well and change media every 2 days for 7 days.
- Replating airway epithelial organoids at Day 7 of differentiation
NOTE: Replating airway epithelial organoids is necessary because the edge of the ECM domes gradually disintegrate over the 2-week culture period. Airway epithelial organoids at the edge of the dome may be lost (dislodge into the media) or have apical-facing-outwards orientation when not fully embedded in ECM. The replating step also "cleans up" the ECM dome by removing cells/debris which does not successfully form organoids.- Aspirate the media from each well. Add 500 µL of cold airway organoid basal media (henceforth termed basal media) to each well.
- Use the P1000 pipette since this pipette tip has the largest orifice and will reduce the likelihood of organoids bursting during pipetting. Adjust the pipette to 350 µL to avoid creating bubbles, then pipette up and down gently to disrupt the ECM dome in each well. Collect all ECM/basal media into a 15 mL centrifuge tube.
- Rinse each well with 500 µL of cold basal media. Collect the basal media containing any remaining ECM and organoids into the same 15 mL centrifuge tube as above.
- Centrifuge at 300 x g for 5 min at 4 °C. Of the three layers visible following centrifuging - (1) supernatant, (2) ECM containing cellular debris (fluffy) and (3) pellet containing organoids - discard the supernatant and ECM layer and preserve the organoid pellet.
- Add 1 mL of cold basal media to the organoid pellet and pipette up and down gently to separate any remaining ECM. Add 6 mL of cold basal media to the tube and mix gently.
- Centrifuge at 300 × g for 5 min at 4 °C. Discard the supernatant.
- If excess ECM is still visible, repeat steps 6.3.5- 6.3.6 to perform another wash.
- Resuspend the organoid pellet with an appropriate volume of 90% ECM (use AODM instead of AOSM) to plate ~30 organoids per 50 µL of the dome.
- Check the density of organoids under the cell culture microscope (4x objective lens) after plating the first dome. If too dense, add an additional 90% ECM to achieve the desired density of ~30 organoids.
- Follow steps 6.2.3- 6.2.4 to solidify ECM and feed cells every second day with 500 µL of warmed AODM to each well for another 14 days until they reach maturity (after 21 days of differentiation) with lumen formation surrounded by inward-facing pseudostratified epithelium containing basal cells, ciliated cells, and goblet cells.
NOTE: The airway epithelial organoids described here are terminally differentiated and cannot be passaged or cryopreserved.
7. Imaging cilia beat frequency
NOTE: This section of the protocol requires a live-cell imaging microscope with a heating and humidity environmental chamber, a fast frame rate (>100 Hz) scientific camera, a 20x long working distance objective, and imaging software (refer to Table of Materials for recommended equipment used in this protocol).
- Microscope set up
- Ensure the microscope heating system is turned on and equilibrated to 37 °C. Turn on the microscope. Adjust the gas to 5% CO2 via the CO2/air gas mixer.
- Top up the humidity module bottle that the CO2 passes through with purified water. Set the relative humidity to 85% via the stage top controller so that the water is heated and the cells are supplied with humidified air. Equilibrate the chamber for 30 min.
- Place the microscope plate insert into the microscope holder.
- Transfer the airway epithelial cell models from the incubator to the microscope on a heat block or thermal beads equilibrated to 37 °C to maintain the sample at a physiological temperature.
- Place the culture plate containing the airway epithelial cell models into the microscope plate insert. Close the microscope environmental chamber.
- Allow the sample to equilibrate in the pre-warmed 37 °C, 5% CO2-filled microscope chamber for 30 min.
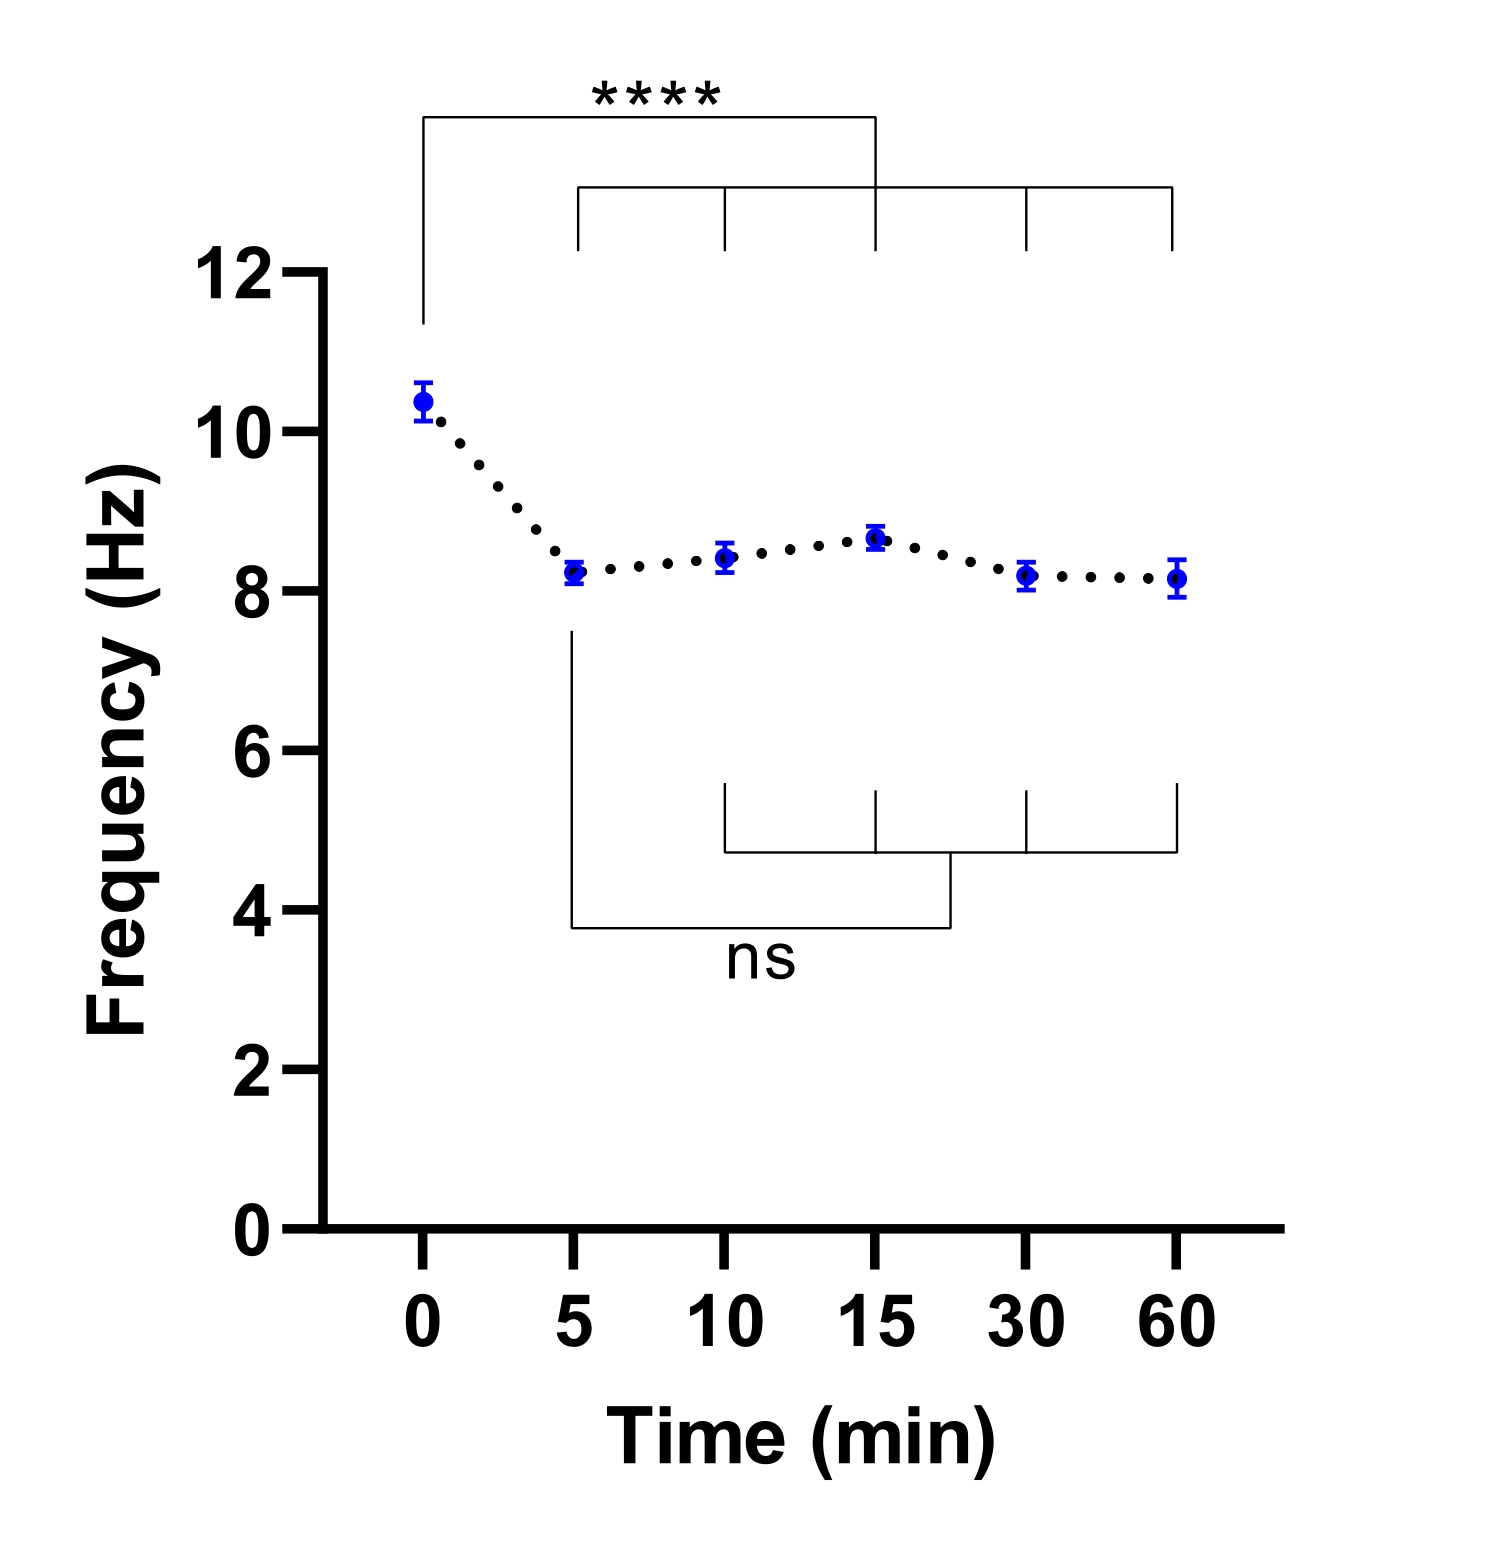
NOTE: A shorter equilibration time may be sufficient. This can be determined by performing an experiment to identify the time required for the stabilization of CBF (refer to Figure 3).

Figure 3: Stabilisation of ciliary beat frequency in live-cell imaging microscope. Dot plots of mean cilia beat frequency (CBF) in airway epithelial cells at the air-liquid interface (ALI models) following transfer into a live-cell imaging microscope with an environmental chamber. Chamber was equilibrated and maintained at 37 °C, 5% CO2 and relative humidity of 85% for 30 min prior to opening the chamber door and placing the culture plate into the microscope plate insert. Cell models were imaged for 60 min at indicated intervals. ALI models were derived from two participants with CF. Six field of view (FOV) images were acquired per ALI model. Each dot (blue) represents the mean CBF in 12-36 FOV images. Data are represented as mean ± SEM, with mean connected by a dotted line. One-way analysis of variance (ANOVA) was used to determine statistical differences. **** P < 0.0001, ns: no significance. Please click here to view a larger version of this figure.
- During the equilibration period, at the computer, open the acquisition software. Select the 20x long working distance objective lens.
- At the microscope eyepiece, focus on the cell model (~Z = 8000 µm).
- Ensure that the microscope is set up for Kohler illumination so that transmission light source bulb filaments are not focused on the sample plane, avoiding artifacts in the imaging. For this follow steps 7.1.10-7.1.13
- Completely close the field iris diaphragm above the condenser. Slowly open the field iris diaphragm and move the condenser up/down until an octagon shape appears.
- If the field iris diaphragm is not aligned (i.e., the octagon is not in the center of the field of view (FOV)), align it to the center using Allen keys.
- Once the field iris diaphragm is aligned, adjust the condenser focus to bring the octagon into sharp focus.
- Open the field iris diaphragm until it can no longer be seen within the FOV.
- Using the acquisition software, click on L100 to switch the light path to the port where the camera is mounted. Click on the green play (Run) button to visualize the microscope FOV via the software. Check that the cilia are in focus and adjust if required.
- Using the acquisition software, set up the microscope with the following settings: Filters: empty; Condenser: empty; Format: no binning; Exposure time: 0.003 s; Readout mode: rolling shutter; ROI: 512 × 512 pixels.
NOTE: Exposure time is based on the highest frequency that needs to be measured since 1/exposure time must be at least twice this frequency. E.g., if the maximum physiological range of cilia beating = 30 Hz, then 1/exposure time = 60, and exposure time must be ≤ 0.016 s. ROI depends on camera frame rate specifications. Select an ROI that captures frame rates >100 Hz.
- Image acquisition
- To acquire time-lapse images from the menu, click on Acquire and then click on Fast Time Lapse. In the pop-up window, select a save location and file name. Acquire 1000 frames.
- Click on Apply. Click on the green play (Run) button to preview the cilia in the microscope FOV and adjust the Z focus if required. Click Run Now to capture the fast time-lapse.
- Once the fast time-lapse has been captured, click on the green play (Run) button to visualize the microscope FOV. Using the microscope joystick, move along the X/Y axis to another FOV.
- Adjust the Z focus to bring the cilia into focus. Click on Run Now to capture another fast time-lapse.
- Repeat steps 7.2.3-7.2.4. For ALI models and airway organoids, image 6x FOV in each of 3x replicate samples. For airway epithelial sheets, image a minimum of 4x replicate images per participant.
8. Data analysis and quantification of CBF
- Preparations for data analysis
NOTE: This section of the protocol requires custom analysis scripts (Supplementary File 3), raw image files (acquired in section 7.2), a computing software, and analysis software.- Install the computing software, preferably the latest version, on the analysis computer. Ensure that standard computing software toolboxes (elmat, ops, datafun, uitools, datatypes, iofun, iotools, audiovideo) and Image and Signal Processing toolboxes are installed.
- Copy the custom analysis scripts 'BeatingCiliaBatchOMEfiles_JOVE.m' and 'LoadRawDataExportFilteredMovies_JOVE.m' and 'support scripts' folder to the local drive of the computer.
- On the computing software, click on the Home tab. Then click on Set Path (Figure 4A-B).
- In the pop-up window, click on Add With Subfolders (Figure 4C). Under 'MATLAB search path', select the folders shown in Figure 4D, then click on Save and Close (Figure 4E-F).
- Confirm that the analysis scripts are linked to the computing software by checking that they appear in the left-hand panel (Figure 4G).
- Transfer the raw image files (open microscopy environment (OME) format) acquired in section 7.2 to the computer's local drive.
NOTE: Example raw image files may be accessed at: https://doi.org/10.6084/m9.figshare.16649878.v1.

Figure 4: Setting up computing software for data analysis. (A) Open the Home tab. (B) Select Set Path. (C) Select Add with Subfolders. (D) Select folders containing the analysis scripts. (E) Select Save. (F) Select Close. (G) The analysis scripts will appear in the left-hand panel. Please click here to view a larger version of this figure.
- Quantification of CBF by peak detection of the spectrum of intensity of single pixels
- Open the computing software. Click on the 'BeatingCiliaBatchOMEfiles_JOVE.m' analysis script file (Figure 5A).
- Click on the Editor tab, and then click on the green play (Run) button to run the script (Figure 5B-C). In the prompt window, select the raw image files to be analyzed (Figure 5D).
- Enter the exposure time from step 7.1.15 into the prompt window for acquisition time per frame, then click on OK (Figure 5E).
- Wait ~15 min per file while the script computes and outputs the CBF in the 'AveSpectrum' file (Supplementary File 4), which is automatically saved to the same folder as the raw image files. Visualize the progress via the progress bar (Figure 5F).

Figure 5: Running analysis scripts using computing software. (A) Open the script for analysis of CBF ('BeatingCiliaBatchOMEfiles_JOVE.m') or creation of cilia beating movie ('LoadRawDataExportFilteredMovies_JOVE.m'). (B) Open the Editor tab. (C) Select the green play (Run) button to run the analysis script. (D) A prompt window will require the selection of files for analysis or movie creation. (E) While running the 'BeatingCiliaBatchOMEfiles_JOVE.m' script, a prompt will appear to manually input the acquisition time per frame (s) in case the file-reading script does not read the metadata properly. (F) Progress bar indicating cilia beat frequency being computed. (G) While running the 'LoadRawDataExportFilteredMovies_JOVE.m' script, a prompt will appear to manually input the type of movie to be outputted (mp4 or avi), the movie frame rate (fps), whether the immobile component is removed from the movie data ('y' or 'n'), the frame time (s), and the pixel size (microns) of the data exported into the movie. It is recommended to use 'y' for immobile filtering as it will remove mucus or any other obstructing immobile layers in the data. (H) Progress bar for indicating movie being exported. Please click here to view a larger version of this figure.
- Run the 'GetFirstAmplitude.m' script on the folder that contains the 'AveSpectrum' files using the process in steps 8.2.1-8.2.2. Wait for the script to output the 'FirstAmplitudeStacked.xlsx' file, which contains the frequency that has the highest amplitude and is within the physiological range of airway epithelium cilia beating, ≥3 and <30 Hz.
- Copy the frequency values from the 'FirstAmplitudeStacked.xlsx' file and plot using a scientific analysis software.
NOTE: An explanation of how the custom analysis script quantifies CBF is provided in Supplementary File 5. Example analyzed datasets may be accessed at: https://doi.org/10.6084/m9.figshare.16649815.
- Exporting a video of cilia beating
- Open the computing software. Click on the 'LoadRawDataExportFilteredMovies_JOVE.m' script file (Figure 5A) to load the script.
- Click on the Editor tab, and then click on the green play (Run) button to run the script (Figure 5C). In the prompt window, select the raw image files to be exported to movie files (Figure 5D).
- Input the settings detailed in Table 4 into the 'Make Movie' pop-up window (Figure 5G).
- Wait ~8 min per file while the script creates the movie files and outputs them to the location of the raw image files. Visualize the progress via the progress bar (Figure 5H).
| Movie inputs | Description |
| File type | Input the file type you would like to export (mp4 or avi). |
| Frame rate | Input the frame rate at which the movie should be exported. If you have ~1000 frames per time series acquired, it is recommended to set frame rate ~30 fps. |
| Immobile filtering | Options are ‘y’ or ‘n’. Default is ‘y’, and the time filtering script removes, using Fourier space, any immobile components from movie data. Typically, any layers of cells under cilia or immobile mucus will contribute a zero-frequency offset component or time invariant component in the signal that can be filtered out. |
| Acquisition time per frame | The acquisition time per frame of acquired data. It is used to display a time stamp in the movie in seconds. |
| Pixel size | The pixel size in micrometres is used to display a scale bar in the movie in micrometres. |
Table 4: Input settings for movie creation
Results
To demonstrate the efficiency of this protocol in quantifying CBF, the results of CBF measured in airway epithelial cell ALI models derived from three participants with CF and three healthy control participants are presented. On Day 14 of culture differentiation, beating cilia were present (Figure 6). From Day 14 to 21 of culture differentiation, a statistically significant (P < 0.0345) increase in CBF was observed within both cohorts. On Day 21 of culture differentiation, the mean CBF f...
Discussion
There are multiple factors that could obscure the quantification of CBF in nasal epithelial sheets. Epithelial sheets should be imaged within 3-9 hrs of sample collection since the ciliary function is most stable during this time37. Less red blood cells and debris are most optimal for imaging since these interfere with data acquisition. When selecting an ROI for imaging, it is important to select an epithelial sheet that edge has not been damaged or disrupted during the collection of the sample, a...
Disclosures
The authors declare that they have nothing to disclose.
Acknowledgements
We thank the study participants and their families for their contributions. We appreciate the assistance from Sydney Children's Hospitals (SCH) Randwick respiratory department in the organization and collection of patient biospecimens - special thanks to Dr. John Widger, Dr. Yvonne Belessis, Leanne Plush, Amanda Thompson, and Rhonda Bell. We acknowledge the assistance of Iveta Slapetova and Renee Whan from the Katharina Gaus Light Microscopy Facility within the Mark Wainwright Analytical Centre at UNSW Sydney. This work is supported by National Health and Medical Research Council (NHMRC) Australia (GNT1188987), CF Foundation Australia, and Sydney Children's Hospital Foundation. The authors would like to acknowledge Luminesce Alliance - Innovation for Children's Health for its contribution and support. Luminesce Alliance - Innovation for Children's Health is a not-for-profit cooperative joint venture between the Sydney Children's Hospitals Network, the Children's Medical Research Institute, and the Children's Cancer Institute. It has been established with the support of the NSW Government to coordinate and integrate pediatric research. Luminesce Alliance is also affiliated with the University of Sydney and the University of New South Wales Sydney. KMA is supported by an Australian Government Research Training Program Scholarship. LKF is supported by the Rotary Club of Sydney Cove/Sydney Children's Hospital Foundation and UNSW University postgraduate award scholarships.
Materials
| Name | Company | Catalog Number | Comments |
| Adenine | Sigma-Aldrich | A2786 | 10 mg/mL |
| Advanced DMEM/F-12 | Thermo Fisher Scientific | 12634-010 | |
| Alanyl-glutamine | Sigma-Aldrich | G8541 | 200 mM |
| Andor Zyla 4.2 sCMOS | Oxford Instruments | Fast frame rate (>100 Hz) scientific camera | |
| Bottle-top vacuum filter system | Sigma-Aldrich | CLS431098 | |
| Ceftazidime hydrate | Sigma-Aldrich | A6987 | 50 mg/mL |
| Cell Culture Microscope | Olympus | CKX53 | |
| CFI S Plan Fluor ELWD 20XC | Nikon Instruments Inc. | MRH08230 | Long working distance objective lens. NA0.45 WD 8.2-6.9 |
| Cholera toxin | Sigma-Aldrich | C8052-1MG | 200 µg/mL |
| Corning Gel Strainer 40 UM | Sigma-Aldrich | CLS431750 | Pore size 40 μm |
| Corning Matrigel Matrix (Phenol red-free) | Corning | 356231 | Extracellular matrix (ECM) |
| Corning bottle-top vacuum filter system | Sigma-Aldrich | CLS431098 | |
| Corning CoolCell LX Cell Freezing Container | Sigma-Aldrich | CLS432002 | |
| Corning Transwell polyester membrane cell culture inserts | Sigma-Aldrich | CLS3470 | Permeable support inserts. 6.5 mm Transwell with 0.4 μm pore polyester membrane insert. |
| Countess Cell Counting Chamber Slides | Thermo Fisher Scientific | C10228 | |
| Countess II Automated Cell Counter | ThermoFisher Scientific | AMQAX1000 | Automated cell counter |
| Cytology brushes | McFarlane Medical | 33009 | |
| DMEM/F12-Ham | Thermo Fisher Scientific | 11330032 | |
| DMEM/F12-Ham | Thermo Fisher Scientific | 11330032 | |
| DMEM-High Glucose | Thermo Fisher Scientific | 11965-092 | |
| Dulbecco′s Phosphate Buffered Saline (PBS) | Sigma-Aldrich | D8537 | |
| Eclipse Ti2-E | Nikon | Live-cell imaging microscope. | |
| Fetal Bovine Serum, certified, heat inactivated, United States | Thermo Fisher Scientific | 10082147 | |
| Fungizone (Amphotericin B) | Thermo Fisher Scientific | 15290018 | 250 µg/mL |
| Gentamicin solution | Sigma-Aldrich | G1397 | 50 mg/mL |
| Graphpad Prism | Graphpad | Scientific analysis software | |
| Greiner Cryo.s vials | Sigma-Aldrich | V3135 | Cryogenic vials |
| HEPES solution | Sigma-Aldrich | H0887 | 1 M |
| HI-FBS | Thermo Fisher Scientific | 10082-147 | |
| Hydrocortisone | Sigma-Aldrich | H0888 | 3.6 mg/mL |
| Incubator NL Ti2 BLACK 2000 | PeCon | Microscope environmental chamber. Allows warm air incubation and local CO2 and O2 gassing | |
| Insulin | Sigma-Aldrich | I2643 | 2 mg/mL |
| Lab Armor 74220 706 Waterless Bead Bath 6L | John Morris Group | 74220 706 | Bead bath |
| Lab Armor Beads | Thermo Fisher Scientific | A1254302 | Thermal beads |
| MATLAB | MathWorks | Computing software | |
| Microsoft Excel | Microscoft | Spreadsheet software | |
| NIH/3T3 | American Type Culture Collection | CRL-1658 | Irradiated NIH-3T3 mouse embryonic feeder cells |
| NIS-Elements AR | Nikon Instruments Inc. | Image acquisition software | |
| Penicillin-Streptomycin | Sigma-Aldrich | P4333 | 10,000 units penicillin and 10 mg streptomycin/mL |
| Dulbecco′s Phosphate Buffered Saline (PBS) | Sigma-Aldrich | D8537 | |
| PneumaCult Airway Organoid Kit | StemCell Technologies | 5060 | Airway Organoid Kit |
| PneumaCult-ALI Medium | StemCell Technologies | 5001 | |
| PneumaCult-Ex Plus Medium | StemCell Technologies | 5040 | |
| PureCol-S | Advanced BioMatrix | 5015 | Type I Collagen solution |
| ReagentPack Subculture Reagents | Lonza | CC-5034 | |
| rhEGF (Epidermal Growth Factor, human) | Sigma-Aldrich | E9644 | 25 µg/mL |
| Y-27632 2HCl (ROCK inhibitor) | Selleckchem | S1049 | 10 mM |
| Tobramycin | Sigma-Aldrich | T4014 | 100 mg/mL |
| Trypan blue solution | Sigma-Aldrich | T8154 | 0.4% |
| UNO Stage Top Incubator | Okolab | Microscope incubator. Allows temperature, humidity and CO2 conditioning |
References
- Barbato, A., et al. Primary ciliary dyskinesia: a consensus statement on diagnostic and treatment approaches in children. European Respiratory Journal. 34 (6), 1264-1276 (2009).
- Cutting, G. R. Cystic fibrosis genetics: from molecular understanding to clinical application. Nature Reviews Genetics. 16 (1), 45-56 (2015).
- Chioccioli, M., Feriani, L., Kotar, J., Bratcher, P. E., Cicuta, P. Phenotyping ciliary dynamics and coordination in response to CFTR-modulators in Cystic Fibrosis respiratory epithelial cells. Nature Communications. 10 (1), 1763 (2019).
- Hirst, R. A., Rutman, A., Williams, G., O'Callaghan, C. Ciliated air-liquid cultures as an aid to diagnostic testing of primary ciliary dyskinesia. Chest. 138 (6), 1441-1447 (2010).
- Thomas, B., Rutman, A., O'Callaghan, C. Disrupted ciliated epithelium shows slower ciliary beat frequency and increased dyskinesia. European Respiratory Journal. 34 (2), 401-404 (2009).
- Coles, J. L., et al. A revised protocol for culture of airway epithelial cells as a diagnostic tool for primary ciliary dyskinesia. Journal of Clinical Medicine. 9 (11), (2020).
- Pifferi, M., et al. Simplified cell culture method for the diagnosis of atypical primary ciliary dyskinesia. Thorax. 64 (12), 1077-1081 (2009).
- Pifferi, M., et al. Rapid diagnosis of primary ciliary dyskinesia: cell culture and soft computing analysis. European Respiratory Journal. 41 (4), 960-965 (2013).
- Lee, D. D. H., et al. Higher throughput drug screening for rare respiratory diseases: Readthrough therapy in primary ciliary dyskinesia. European Respiratory Journal. 58 (4), 2000455 (2021).
- Saint-Criq, V., et al. Choice of differentiation media significantly impacts cell lineage and response to CFTR modulators in fully differentiated primary cultures of cystic fibrosis human airway epithelial cells. Cells. 9 (9), (2020).
- Awatade, N. T., et al. Significant functional differences in differentiated Conditionally Reprogrammed (CRC)- and Feeder-free Dual SMAD inhibited-expanded human nasal epithelial cells. Journal of Cystic Fibrosis. 20 (2), 364-371 (2021).
- Dabrowski, M., Bukowy-Bieryllo, Z., Jackson, C. L., Zietkiewicz, E. Properties of non-aminoglycoside compounds used to stimulate translational readthrough of PTC mutations in primary ciliary dyskinesia. International Journal of Molecular Sciences. 22 (9), (2021).
- Hirst, R. A., et al. Culture of primary ciliary dyskinesia epithelial cells at air-liquid interface can alter ciliary phenotype but remains a robust and informative diagnostic aid. PloS One. 9 (2), 89675 (2014).
- Marthin, J. K., Stevens, E. M., Larsen, L. A., Christensen, S. T., Nielsen, K. G. Patient-specific three-dimensional explant spheroids derived from human nasal airway epithelium: a simple methodological approach for ex vivo studies of primary ciliary dyskinesia. Cilia. 6, 3 (2017).
- Chilvers, M. A., O'Callaghan, C. Analysis of ciliary beat pattern and beat frequency using digital high speed imaging: comparison with the photomultiplier and photodiode methods. Thorax. 55 (4), 314-317 (2000).
- Chilvers, M. A., Rutman, A., O'Callaghan, C. Functional analysis of cilia and ciliated epithelial ultrastructure in healthy children and young adults. Thorax. 58 (4), 333-338 (2003).
- Castillon, N., et al. Polarized expression of cystic fibrosis transmembrane conductance regulator and associated epithelial proteins during the regeneration of human airway surface epithelium in three-dimensional culture. Laboratory Investigation. 82 (8), 989-998 (2002).
- Jorissen, M., Bessems, A. Normal ciliary beat frequency after ciliogenesis in nasal epithelial cells cultured sequentially as monolayer and in suspension. Acta Oto-Laryngologica. 115 (1), 66-70 (1995).
- Conger, B. T., et al. Comparison of cystic fibrosis transmembrane conductance regulator (CFTR) and ciliary beat frequency activation by the CFTR Modulators Genistein, VRT-532, and UCCF-152 in primary sinonasal epithelial cultures. JAMA Otolaryngology-Head & Neck Surgery. 139 (8), 822-827 (2013).
- Pique, N., De Servi, B. Rhinosectan((R)) spray (containing xyloglucan) on the ciliary function of the nasal respiratory epithelium; results of an in vitro study. Allergy, Asthma & Clinical Immunology. 14, 41 (2018).
- Chen, Q., et al. Host antiviral response suppresses ciliogenesis and motile ciliary functions in the nasal epithelium. Frontiers in Cell and Developmental Biology. 8, 581340 (2020).
- Clary-Meinesz, C. F., Cosson, J., Huitorel, P., Blaive, B. Temperature effect on the ciliary beat frequency of human nasal and tracheal ciliated cells. Biology of the Cell. 76 (3), 335-338 (1992).
- Ballenger, J. J., Orr, M. F. Quantitative measurement of human ciliary activity. Annals of Otology, Rhinology and Laryngology. 72, 31-39 (1963).
- Mercke, U. The influence of varying air humidity on mucociliary activity. Acta Oto-Laryngologica. 79 (1-2), 133-139 (1975).
- Sutto, Z., Conner, G. E., Salathe, M. Regulation of human airway ciliary beat frequency by intracellular pH. Journal of Physiology. 560, 519-532 (2004).
- Salathe, M. Regulation of mammalian ciliary beating. Annual Review of Physiology. 69, 401-422 (2007).
- Kempeneers, C., Seaton, C., Garcia Espinosa, B., Chilvers, M. A. Ciliary functional analysis: Beating a path towards standardization. Pediatric Pulmonology. 54 (10), 1627-1638 (2019).
- Kempeneers, C., Seaton, C., Chilvers, M. A. Variation of ciliary beat pattern in three different beating planes in healthy subjects. Chest. 151 (5), 993-1001 (2017).
- Jackson, C. L., et al. Accuracy of diagnostic testing in primary ciliary dyskinesia. European Respiratory Journal. 47 (3), 837-848 (2016).
- Feriani, L., et al. Assessing the collective dynamics of motile cilia in cultures of human airway cells by multiscale DDM. Biophysical Journal. 113 (1), 109-119 (2017).
- Brewington, J. J., et al. Brushed nasal epithelial cells are a surrogate for bronchial epithelial CFTR studies. JCI Insight. 3 (13), (2018).
- Liu, X., et al. ROCK inhibitor and feeder cells induce the conditional reprogramming of epithelial cells. The American Journal of Pathology. 180 (2), 599-607 (2012).
- Suprynowicz, F. A., et al. Conditionally reprogrammed cells represent a stem-like state of adult epithelial cells. Proceedings of the National Academy of Sciences of the United States of America. 109 (49), 20035-20040 (2012).
- Martinovich, K. M., et al. Conditionally reprogrammed primary airway epithelial cells maintain morphology, lineage and disease specific functional characteristics. Scientific Reports. 7 (1), 17971 (2017).
- Wong, J. Y., Rutman, A., O'Callaghan, C. Recovery of the ciliated epithelium following acute bronchiolitis in infancy. Thorax. 60 (7), 582-587 (2005).
- Gentzsch, M., et al. Pharmacological rescue of conditionally reprogrammed cystic fibrosis bronchial epithelial cells. American Journal of Respiratory Cell and Molecular Biology. 56 (5), 568-574 (2017).
- Sommer, J. U., Gross, S., Hormann, K., Stuck, B. A. Time-dependent changes in nasal ciliary beat frequency. European Archives of Oto-Rhino-Laryngology. 267 (9), 1383-1387 (2010).
- Ratjen, F., et al. Cystic fibrosis. Nature Reviews Disease Primers. 1, 15010 (2015).
- Delmotte, P., Sanderson, M. J. Ciliary beat frequency is maintained at a maximal rate in the small airways of mouse lung slices. American Journal of Respiratory Cell and Molecular Biology. 35 (1), 110-117 (2006).
- Smith, C. M., et al. Cooling of cilia allows functional analysis of the beat pattern for diagnostic testing. Chest. 140 (1), 186-190 (2011).
- Raidt, J., et al. Ciliary beat pattern and frequency in genetic variants of primary ciliary dyskinesia. European Respiratory Journal. 44 (6), 1579-1588 (2014).
Reprints and Permissions
Request permission to reuse the text or figures of this JoVE article
Request PermissionExplore More Articles
This article has been published
Video Coming Soon
Copyright © 2025 MyJoVE Corporation. All rights reserved