
A subscription to JoVE is required to view this content. Sign in or start your free trial.
Method Article
High-Resolution Cardiac Positron Emission Tomography/Computed Tomography for Small Animals
In This Article
Summary
Here, we present an experimental imaging protocol for the quantification of cardiac function and morphology using high-resolution positron emission tomography/computed tomography for small animals. Both mice and rats are considered, discussing the different requirements of computed tomography contrast agents for the two species.
Abstract
Positron emission tomography (PET) and computed tomography (CT) are among the most employed diagnostic imaging techniques, and both serve in understanding cardiac function and metabolism. In preclinical research, dedicated scanners with high sensitivity and high spatio-temporal resolution are employed, designed to cope with the demanding technological requirements posed by the small heart size and very high heart rates of mice and rats. In this paper, a bimodal cardiac PET/CT imaging protocol for experimental mouse and/or rat models of cardiac diseases is described, from animal preparation and image acquisition and reconstruction to image processing and visualization.
In particular, the 18F-labeled fluorodeoxyglucose ([18F]FDG)-PET scan allows for the measurement and visualization of glucose metabolism in the different segments of the left ventricle (LV). Polar maps are convenient tools to display this information. The CT part consists of a time-resolved 3D reconstruction of the entire heart (4D-CT) using retrospective gating without electrocardiography (ECG) leads, allowing the morphofunctional evaluation of the LV and the subsequent quantification of the most important cardiac function parameters, such as ejection fraction (EF) and stroke volume (SV). Using an integrated PET/CT scanner, this protocol can be executed within the same anesthesia induction without the need to reposition the animal between different scanners. Hence, PET/CT can be seen as a comprehensive tool for the morphofunctional and metabolic evaluation of the heart in several small animal models of cardiac diseases.
Introduction
Small animal models are extremely important for the advancement of the understanding of cardiovascular diseases1,2. Non-invasive, diagnostic imaging tools have revolutionized the way we look at cardiac function in the last decades, both in clinical and preclinical settings. As far as small animal models of cardiac diseases are concerned, specific imaging tools have been developed with very high spatiotemporal resolution. Thus, such instruments can match the need for accurate quantification of the relevant metabolic and kinetic myocardial parameters on the very small and very fast-moving hearts of mice and rats in specific disease models, such as heart failure (HF)3 or myocardial infarction (MI)4. Several modalities are available for this purpose, each with their own strengths and weaknesses. Ultrasound (US) imaging is the most widely used modality due to its great flexibility, very high temporal resolution, and relatively low cost. The adoption of US cardiac imaging in small animals has increased considerably since the advent of systems using probes with ultra-high frequency5,6, featuring spatial resolutions below 50 µm.
Among the main disadvantages of US for fully 3D cardiac imaging is the need for linear scans along the heart axis by mounting the probe on a motorized translation stage to create a full stack of dynamic B-mode images of the whole heart7. Eventually, this procedure gives rise (after accurate spatial and temporal registration of the images acquired in each probe position) to a 4D image with different spatial resolutions between the in-plane and out-of-plane directions. The same problem of non-uniform spatial resolution occurs in cardiac MR (CMR),8 which still represents the gold standard in the functional imaging of the heart. Real isotropic 3D imaging can be instead obtained using both computed tomography (CT) and positron emission tomography (PET)9. PET provides a very sensitive tool in terms of image signal per quantity of injected probe (in the nanomolar range), even though it suffers from a reduced spatial resolution compared to CT, MR, or US. The main advantage of PET is its ability to display the cellular and molecular mechanisms underlying the organ's pathophysiology. For instance, a PET scan following the injection of [18F]FDG allows the reconstruction of a 3D map of the glucose metabolism in the body. By combining this with dynamic (i.e., time-resolved) data acquisition, tracer kinetic modeling can be used to calculate parametric maps of the metabolic rates of glucose uptake (MRGlu), which will provide important information about myocardial viability10.
CT requires significant volumes of external contrast agents (CA) at high concentrations (up to 400 mg of iodine per mL) to provide a measurable enhancement of the relevant tissue components (e.g., blood vs. muscle), but it excels in spatial and temporal resolution, especially when using state-of-the-art micro-CT scanners designed for small animal imaging.11 A typical disease model in which the cardiac PET/CT can be applied is the experimental evaluation of myocardial infarction and heart failure and related response to therapy. A common way of inducing MI in small animals is by surgical ligation of the left anterior descending (LAD) coronary artery12,13 and then longitudinally evaluating the progression of the disease and the cardiac remodeling in the subsequent days4. Nevertheless, the quantitative morphofunctional evaluation of the heart in small animals is largely applicable also for other disease models, such as the evaluation of the effect of aging on cardiac function14 or altered receptor expression in models of obesity15. The presented imaging protocol is not restricted to any given disease model and, hence, could be of the widest interest in several contexts of preclinical research with small rodents.
In this paper, we present a start-to-end experimental protocol for cardiac imaging using small animal integrated PET/CT. Even though the presented protocol is designed for a specific bimodal integrated scanner, the PET and CT parts of the described procedure could be performed independently on separate scanners from different manufacturers. In the PET/CT scanner in use, the sequence of operations is organized in a preprogrammed workflow. The main branches of each workflow are one or more acquisition protocols; each acquisition protocol can have one or more branches for specific preprocessing protocols, and in turn, each preprocessing protocol can have one or more branches for specific reconstruction protocols. Both the preparation of the animal on the imaging bed and the preparation of the external agents to be injected during the imaging procedures are described. After the completion of the image acquisition procedure, example procedures for quantitative image analysis based on commonly available software tools are provided. The main protocol is specifically designed for mouse models; even though the mouse remains the most used species in this field, we also show an adaptation of the protocol for rat imaging at the end of the main protocol. Representative results are shown for both mice and rats, demonstrating the type of output that might be expected with the described procedures. A thorough discussion is made at the end of this paper to emphasize the pros and cons of the technique, critical points, as well as how different PET radiotracers could be used with almost no modification to the preparatory and acquisition/reconstruction steps.
Protocol
Animal experiments were performed in accordance with the recommendations in the Guide for the Care and Use of Laboratory Animals of the International Guidelines on Handling of Laboratory Animals, demanded by the European Directive (Directive 86/609/EEC of 1986 and Directive 2010/63/UE) and Italian laws (D.Lgs. 26/2014).
1. Setup of the PET/CT imaging protocols and workflow
NOTE: The protocol presented here is specifically designed for cardiac imaging of mouse models. Working with rats might imply some modifications to the actual protocol, mainly because of the bigger size of the animal (roughly 10x heavier). The modifications for rat imaging are specifically mentioned in the steps; if no modifications are mentioned, then the same steps for mouse imaging can be used for rats.
- Open the graphical user interface (GUI) of the PET/CT scanner (see Table of Materials) and create a set of new protocols (inclusive of parameters for data acquisition, preprocessing, and image reconstruction): (i) a dynamic PET scan, (ii) a low-dose CT scan for attenuation correction (CTAC) without contrast agent, and (iii) a contrast-enhanced Cine-CT scan.
NOTE: The creation of new protocols (i.e., specific software instructions for the tomograph) for the acquisition, preprocessing, and reconstruction phases is a straightforward process; in case of trouble, the user can find more detailed information in the GUI user manual.- For the PET scan, open the Protocol tab of the scanner (GUI) and create three new protocols (for acquisition, preprocessing, and reconstruction) with the following parameters:
- For the acquisition protocol: set 3,600 s total scan time and single bed position. Save this protocol with a proper name for subsequent import into the workflow. Do the same also for all the next protocols in the following points.
- For the preprocessing protocol for mouse: select a 250-750 keV energy window (EW) and enable the following corrections: radioactive decay, random coincidences, and dead time. Set the framing protocol (i.e., dynamic splitting of the raw data) as follows: 8 x 5 s, 8 x 10 s, 3 x 40 s, 2 x 60 s, 2 x 120 s, 10 x 300 s (= 3,600 s). For rat, select a 350-750 keV energy window (EW), using the same framing as for the mouse protocol.
- For the reconstruction protocol: select the high-quality, Monte Carlo-based 3D Ordered Subset Expectation Maximization (3D-OSEM-MC) algorithm, with 8 subsets and 8 iterations, with normalization, quantitative correction, and CT attenuation correction enabled.
- For the low-dose CT scan for attenuation correction (CTAC), use the following parameters:
- For the acquisition protocol: single frame, single bed position, full-scan; tube settings: 80 kV, low-current (low-dose); 576 views over 360°, with 34 ms of exposure time per view (20 s scan time); rotation type: continuous, sensitivity mode: high sensitivity.
- For the preprocessing protocol: 240 µm voxel size, transversal FOV: Rat, axial FOV: 100%.
- For the reconstruction protocol: filter window: smooth, voxel size: standard, enable beam hardening and ring precorrection, disable ring artifact post correction.
- For the contrast-enhanced gated CT scan, create three new protocols (for acquisition, preprocessing, and reconstruction) with the following settings:
- For the acquisition protocol for mouse: set single frame, single bed position, full-scan; tube settings: 65 kV, full-current (low-noise); 8,000 views over 360°, with 15 ms of exposure time per view (120 s scan time); rotation type: continuous, sensitivity mode: high sensitivity. For rat, set the acquisition protocol parameters as follows: 80 kV tube voltage, 16,000 views over 360°, with 12 ms exposure time per view (192 s scan time).
- For the preprocessing protocol for mouse: select 120 µm voxel size; transversal Field of View (FOV): Mouse; axial FOV: 50%. For rat, select a 240 µm voxel size; transversal Field of View (FOV): Rat; axial FOV: 50%.
- For the reconstruction protocol: filter windows: smooth, voxel size: standard; enable beam hardening and ring precorrection, disable ring artifact post correction.
- Open the Workflow tab in the GUI, and create a new workflow, adding the protocols just created: steps 1.1.1.1-1.1.1.3 for PET, steps 1.1.2.1. -1.1.2.3. for CTAC, and steps 1.1.3.1. -1.1.3.3. for gated CT, in the given order. In both cases, ensure that the protocols are nested with the following order: Acquisition | Preprocessing | Reconstruction.
NOTE: Dynamic PET frames with durations <5 s to better capture the peak of the arterial input function at the beginning of the PET scan are possible but are not recommended as this can lead to noisy images with reduced quantitative accuracy. In step 1.1.2.2, we have used the "Rat" size for the transversal FOV. This is commonly used for both rats and mice in CTAC.
- For the PET scan, open the Protocol tab of the scanner (GUI) and create three new protocols (for acquisition, preprocessing, and reconstruction) with the following parameters:
2. Animal preparation for PET/CT imaging
NOTE: For the present protocol, all animals were fasted overnight.
- Anesthetize the mouse with 3%-4% (v/v) isoflurane in an induction chamber initially, and then maintain with 1%-2% (v/v) isoflurane.
- Weigh the mouse and measure the basal glycemia to monitor the condition of the animal. To take the required blood sample, use sharp scissors and make a small cut at the tail tip, then gently massage the tail to collect a droplet of blood (~1 µL) directly on the test strip.
- Proceed with the insertion of a venous access at the level of the caudal vein using a 29 G butterfly for mouse and 24 G for rat.
- To perform the cannulation technique, use concurrent heating (typically, under a heating lamp) and disinfection of the point where the needle is inserted for vasodilation of the vein. After cannulation, fix the butterfly with a silk ribbon to the tail to keep it in place during the procedure.
NOTE: Fasting is required for [18F]FDG studies. Different tracers might involve different animal preparation, but a thorough discussion on this topic is outside of the scope of the present protocol. As far as [18F]FDG is concerned, avoiding fasting leads to very different tracer biodistribution16.
- To perform the cannulation technique, use concurrent heating (typically, under a heating lamp) and disinfection of the point where the needle is inserted for vasodilation of the vein. After cannulation, fix the butterfly with a silk ribbon to the tail to keep it in place during the procedure.
- Turn on the anesthesia system (isoflurane 1%-2%, 0.8 L/min O2 for mouse and 1-1.2 L/min for rat) connected to the PET-CT scanner and transfer the mouse to the bed.
- Place the mouse in the supine position, head first, on the scanner bed of the PET-CT tomograph, putting its nose in the nose mask for anesthesia and gently blocking the head of the mouse to the mask with adhesive tape.
- Fix the upper and lower limbs of the mouse on the scanner bed to prevent any involuntary movements during the imaging procedures, which may lead to motion artifacts.
- Monitor the body temperature and respiration rate using a rectal probe and a respiration pillow, respectively.
3. PET tracer dose preparation
- For mice, draw 10 MBq of [18F]FDG in a volume of 100-150 µL with an insulin syringe (1 mL). For rats, draw a higher dose of 15 MBq in 0.20-0.25 mL.
NOTE: Avoid higher activity as the PET scanner discussed in this protocol has very high sensitivity and just requires a modest amount of activity to obtain high-quality images. - If the original concentration of the tracer in the vial is too high, use physiological solution (0.9% w/v NaCl) to dilute the tracer dose to a concentration of 50-100 MBq/mL.
- Use the PET dose calibrator to measure the actual activity in the syringe. Annotate the preinjection activity and time of measurement as these values will be used later using specific input modules of the PET scanner GUI.
4. CT contrast agent preparation
- Draw 0.2 mL per 20 g of mouse weight of iodinated lipid emulsion contrast agent into a 1 mL syringe. Limit the volume of injection to 0.5 mL of CA for heavier mice. If using iomeprol, set the injection rate for mice to 10 mL/h (~0.17 mL/min) and limit the injection volume to 0.5 mL.
- For rats, draw 2.3-3 mL of iomeprol, diluted to a concentration of 200 mg/mL, into a 5 mL syringe.
NOTE: If small-animal lipid emulsion CA is not available, iomeprol with continuous injection by means of a syringe pump can be used, as discussed below. - Connect the syringe to the syringe pump, and set the pump for the actual syringe size and diameter.
- Connect the syringe to the CA tubing and needle, and prefill the tubing with the CA.
- Set the injection rate to 24 mL/h (= 0.4 mL/min), limiting the injection to a maximum volume of 2 mL.
NOTE: Using blood-pool CA based on iodinated lipid emulsion is also possible in rats, despite the relatively high cost of this procedure due to the larger volume of a single injection. If this option is preferred (e.g., to simplify the protocol by avoiding the syringe pump), the following procedure can be employed:
- For rats, draw 2.3-3 mL of iomeprol, diluted to a concentration of 200 mg/mL, into a 5 mL syringe.
- Draw 7.5 mL per kg of body weight of iodinated lipid emulsion contrast agent into a 5 mL syringe. Limit the volume of injection to 2 mL of CA also for heavier rats.
5. Animal alignment and preliminary operations before imaging
- Upon immobilization of the animal on the imaging bed, create a new study on the tomograph GUI. Add a study name identifier in the Study name module and select the imaging workflow previously saved from the dropdown menu.
- Select the proper anatomical part with Animal/Specimen information | Anatomical part | Cardiac and animal positioning by Animal/Specimen information | Positioning | Supine/Head first. Annotate the animal weight in grams for the corresponding module: Animal/Specimen information | Animal weight.
NOTE: All other information in this section is optional, but it is useful to provide as much as possible of the requested information to find it in the DICOM header of the reconstruction images, thus facilitating subsequent data querying. - Select the radionuclide in PET Scan information | F18 for [18F]FDG studies and other 18F-labeled compounds; modify if other tracers (e.g., [13N]NH3) are used. Write also the name of the tracer in the PET Scan information | Tracer name module as this name will be reported in the DICOM header upon completion of the image reconstruction.
NOTE: The information about tracer injection time, activity, and volume is mandatory but could be provided later during the PET acquisition. - In the CT scan information, write all the available information regarding the contrast agent.
NOTE: All this information is optional but could facilitate subsequent data querying if provided. - Press Perform scan and wait for another tab of the GUI to be opened, allowing animal positioning and the specification of other scanning options.
- Select CT calibration type in CT calibration | Use default CT calibration.
- In the Study preparation section, select each scanning protocol from the dropdown menu, and check the Wait for user confirmation before this scan checkbox.
NOTE: This step is very important, as it will put the scanner in standby waiting for user input before starting the corresponding acquisition phase. For the PET scan, this will allow the synchronization of the tracer injection and actual PET scan start; for the CTAC scan, it will allow the user to close the lid (shielding) before the emission of X-rays during the CT scan (the study will be automatically aborted if the lid is open before the CT scan start); for the Cine-CT scan, this pause will allow the user to initiate the CA infusion protocol and CT data scanning with the required delay. - For animal positioning, switch on the Motor control module using the switch on the left pane of the GUI.
NOTE: This will switch on the centering lasers on the animal bed and enable the manual bed alignment buttons placed on the side of the scanner. - Use the manual bed alignment buttons to move the chest of the animal onto the laser marks. Check carefully both the longitudinal and vertical alignment of the animal.
- Once the animal is placed in the correct position according to the centering laser, press Switch off the laser to save the current laser-marked position, which is to be moved to the center of the PET and CT scanners during the corresponding acquisition phases. Afterward, switch off the motor control module.
6. PET scan
- Press Start acquisition to move the animal onto the PET scanner FOV. The tail and the cannula will remain outside the FOV to allow tracer injection. The scanner will stay idle until the user presses the Continue button.
- Prepare the syringe with the calibrated PET tracer dose.
- Start the acquisition by pressing the Continue button and start injecting the tracer in the cannula within 5 s from the scan start (Figure 1).
NOTE: The injection duration will be ~20-25 s. - Put the syringe in the PET dose calibrator to measure the residual activity in the syringe. Annotate the actual activity and the time of measurement.
- In the Hardware monitor tab of the scanner GUI, use the Update PET tracer info button to insert the actual injected time, activity, and volume.
- During the scan, check the animal's physiological parameters periodically.
- During the scan, measure the glycemia as explained in step 2.2 at the following time points: 5 min, 20 min, 40 min, and 60 min after the beginning of the PET scan.
- After the measurement of glycemia, put the test strip in the gamma counter and perform the activity measurement for 60 s. Record the actual time at which the activity measurement has been carried out, and correct for radioactive decay, taking the tracer injection time as a reference time. Convert the recorded activity values into activity concentration (Bq/mL) by considering an average blood volume of 1 µL in the glucose test strip (i.e., by using equation [1]):
Cblood(t) = Ablood(t)/0.001 mL [Bq/mL] (1)
where Ablood(t) is the decay corrected measured activity of the blood sample in the test strip, expressed in Bq.
NOTE: The PET scan start and tracer injection can be performed by the same operator by using the tomograph's mobile controlling device placed on the lateral table of the scanner close to the site of the operator during injection. Longer delays between the scan start and the beginning of the injection are allowed, but some reconstructed frame at the beginning of the dynamic sequence will remain blank. It is recommended to avoid delays greater than 10 s (i.e., leading to two blank frames with the current protocol).

Figure 1: Injection of the PET tracer. This operation is performed right after the PET scan start. The animal is inside the PET field of view (head first, with its tail visible on the operator's side). Abbreviation: PET = positron emission tomography. Please click here to view a larger version of this figure.
7. CT scans
- Before injecting the CT contrast agent, start the CTAC scan right after closing the scanner's lid and pressing the Continue button on the GUI. At the end of this very short acquisition, employ the following procedures to ensure proper enhancement of the blood pool by injecting the CA prior to acquisition using the same vascular access employed for the injection of the PET tracer.
- Iodinated lipid emulsion CA:
- After completion of the CTAC scan, inject the iodinated lipid emulsion CA using the cannula already connected to the mouse tail vein. The typical injection duration is in the order of 30-60 s.
- Start the imaging right after completion of the injection. Press Continue on the scanner GUI to start the Cine-CT acquisition.
- Iomeprol/syringe pump:
- If a normal X-ray CA is used, such as iomeprol, use a syringe pump allowing slow injection at a constant rate.
- For mice, set the injection rate of the CA to 10 mL/h (~0.17 mL/min) by limiting the volume of injection to 0.5 mL. With this setting, stop the injection after ~3 min. For rats, set the pump to a rate of 24 mL/h (= 0.4 mL/min) and limit the volume of injection to 2 mL. With this setting, stop the injection after 5 min.
- Connect the needle attached to the CA tubing to the tail vein's cannula, ensuring that both the tubing and the needle are prefilled with CA.
- Start the injection. Close the scanner's lid and prepare for the Cine-CT scan.
- Press the Continue button on the tomograph's GUI after 60 s from the beginning of the injection for mice and after 90 s from the beginning of the injection for rats, so that the Cine-CT acquisition is started. The injection of CA will stop roughly at the same time as the Cine-CT scan completion for mice and upon completion for rats.
- Iodinated lipid emulsion CA:
- Upon completion of the Cine-CT scan, disconnect the animal from the physiological monitoring system and remove the tail vein cannula. Depending on the actual protocol, animals are either recovered or euthanized after the described imaging procedure. In the first case, animals are awakened in their cages in a warm environment under an infrared lamp. They are monitored until complete awakening, taking 15/30 min after gaseous anesthesia. In case of protocols requiring e.g., tissue harvesting at the end of the imaging procedure, animals are euthanized using a anesthetic overdose in an induction chamber (5% isoflurane), as per Annex VI of D.Lgs. 26/2014.
NOTE: In the case of 18F-based radionuclides as discussed in this protocol, 24 h after tracer injection are sufficient to reach a level of residual radioactivity on the animal's body that is safe for all practical purposes.
8. Reconstruction of the cardiac 4DCT images using intrinsic cardiorespiratory gating
NOTE: Upon completion of the imaging study, the standard PET and CT reconstruction is automatically performed. Nevertheless, the reconstruction of the 4D (Cine) cardio CT sequence must be performed manually and requires some user interaction. This special type of reconstruction, mandatory for the subsequent morpho-functional cardiac CT analysis, is discussed in this section.
- Open the cardiac gating module of the tomogragh's GUI and select the imaging study to be analyzed.
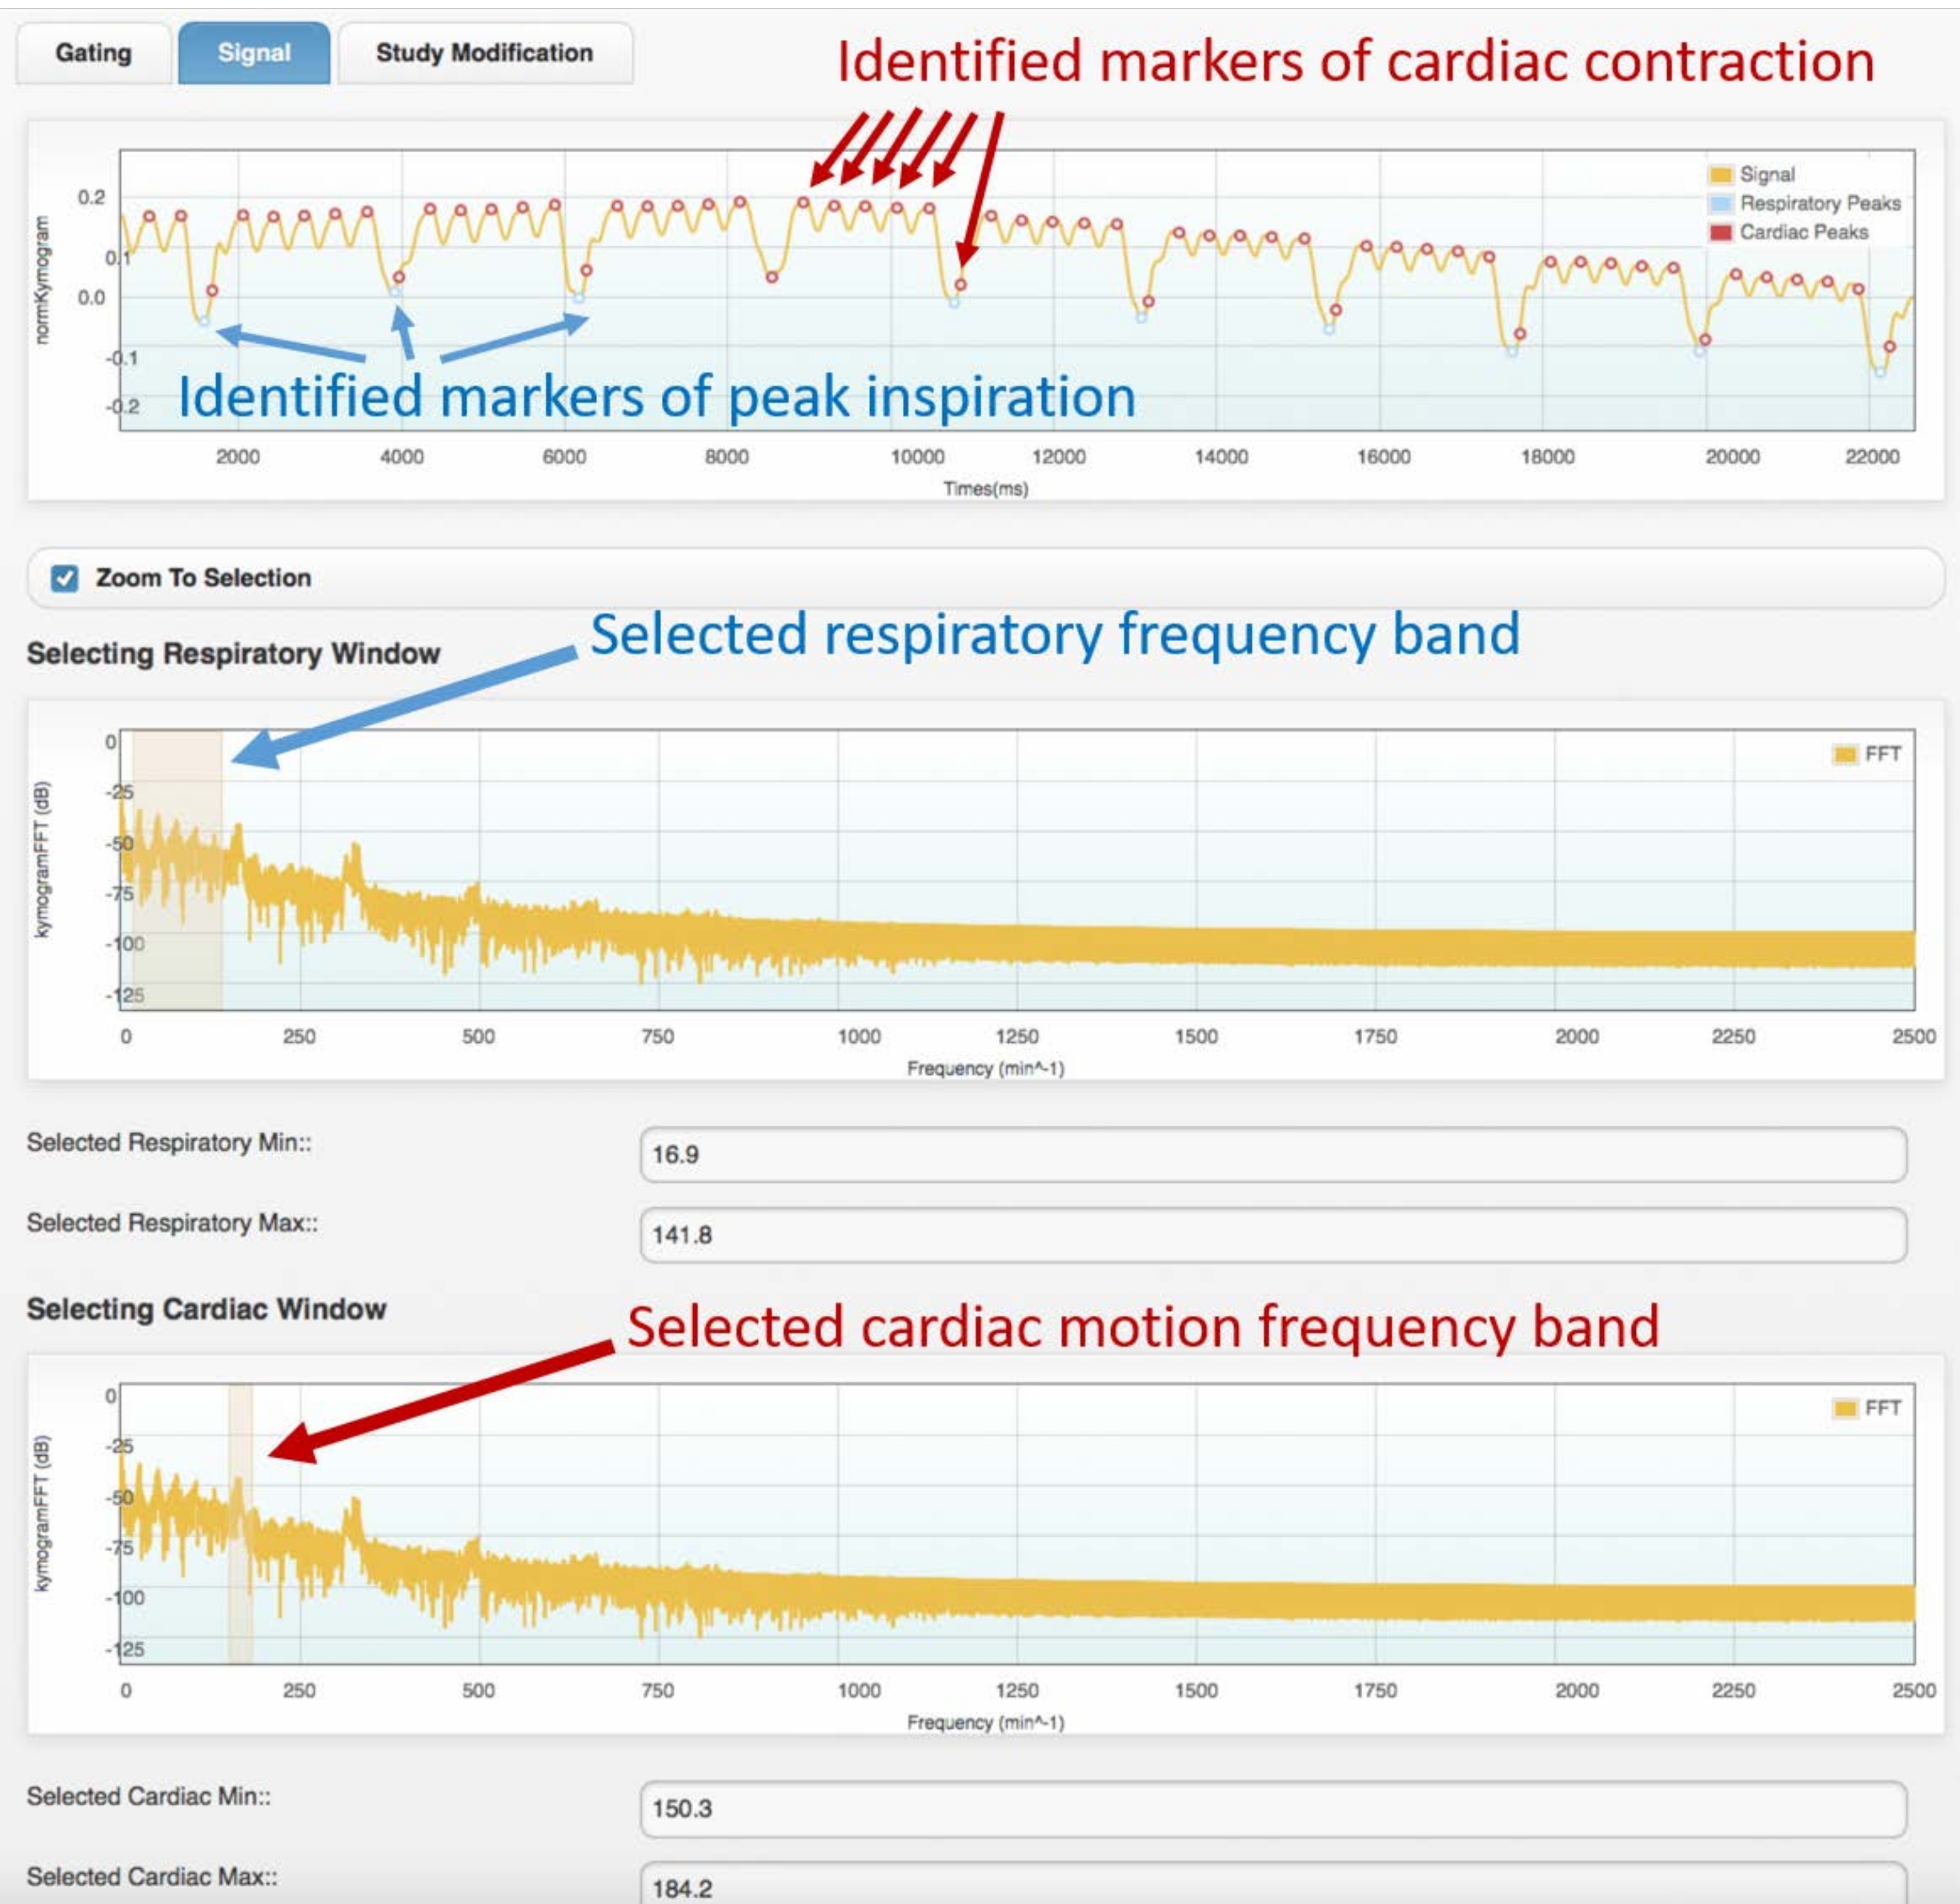
- Select a region of interest (ROI) on the displayed animal's radiographs (Figure 2) for building a time-dependent cardiac motion curve, representing the gating signal-the kymogram. Vertically move the predrawn rectangular ROI in such a way that both the heart apex and the diaphragm are selected. Then, select Gating signal analysis. The user interface will now show the gating signal both on the time domain and frequency domain.
- In the first frequency domain graph, select the respiratory frequency band by highlighting the first group of peaks of the frequency spectrum (refer to Figure 3 for an example spectrum).
- In the second frequency-domain graph, select the cardiac motion frequency band, highlighting the second sharpest peak.
- In the next phase, observe the time-domain gating signal with color markers (dots) superimposed, showing the identified respiration peaks and cardiac contraction peaks. If the marker positions fit well with the respiratory and cardiac peaks of the original gating signal, proceed to the next phase. Otherwise:
- If the shape of the gating signal is too different from that displayed in Figure 3, go back to step 8.2 and select another ROI.
- If the shape of the gating signal is reasonably similar to the one shown in Figure 3, go back to step 8.3 and step 8.4 and select different frequency bands on the gating signal spectrum.
- In the next phase, select a minimum of four cardiac gates.
NOTE: Typical Cine-CT reconstruction consists of 8-12 cardiac gates. - Select the proper respiratory window by using the dropdown menu: Respiratory window | 20%-80%.
NOTE: This will retain 60% of the acquired data in the reconstruction, excluding the phase of peak inspiration and, thus, improving the sharpness of the reconstructed myocardial walls in each cardiac phase. - Perform reconstruction to convert the retrospectively gated Cine-CT images into DICOM format, ready to be imported into the software for subsequent functional analysis.

Figure 2: ROI selection tool for intrinsic gating. This image is shown in the tomograph's GUI during the Cine-CT reconstruction phase. The user must select the position of the ROI (yellow rectangle) on which the intrinsic gating signal (kymogram) is obtained from the raw CT projections. The circular-shaped object superimposed to the animal chest is the respiratory pillow used only for physiological monitoring during the study. Abbreviations: ROI = region of interest; CT = computed tomography; GUI = graphical user interface. Please click here to view a larger version of this figure.

Figure 3: Example gating signal (top frame) and corresponding frequency spectrum (center and bottom). Images obtained with the cardiac gating module of the Atrium software. The user must select the proper frequency bands for both respiratory (center frame) and cardiac motion (bottom frame). This will allow the identification of the respiratory and cardiac markers on the gating signal, which must be checked by the user before proceeding with the 4D reconstruction. Bad identification of the peaks or wrong assignment (e.g., respiratory to cardiac, or vice versa) will lead to incorrect reconstruction. The data shown were obtained from the analysis of a 4D Cine-CT scan of a healthy, adult male Wistar rat (507 g) injected with 2 mL of iomeprol, 200 mg/mL, at the rate of 0.4 mL/min for 5 min (the graph on top is zoomed in on the first 22 s of acquisition to allow better visualization of the identified cardiac and respiratory motion). Abbreviation: CT = computed tomography. Please click here to view a larger version of this figure.
9. PET cardiac analysis
NOTE: This section shows how to perform a kinetic analysis of dynamic [18F]FDG data of the small-animal left ventricle. The analysis is based on the Carimas software. The instructions below are not meant to be a replacement for the software user manual17. The procedure presented below is based on the Patlak graphical analysis of dynamic PET data18. Refer to the Discussion section for details regarding this analysis.
- Open the DICOM images of the dynamic PET scan.
- Select the HeartPlugin module.
- Zoom into the image on the mouse/rat heart, and select the last time frame (or equivalently, the sum of the last three to five time frames) for which most of the blood-pool activity has been already washed out.
- Follow the on-screen instruction to reorient the image along the principal axis of the animal heart (short axis, vertical, and horizontal long axis). Do this interactively by moving the displayed markers for the heart base and apex (Figure 4).
- Select the Segmentation tool.
NOTE: By default, automatic segmentation is enabled, which yields reliable results in most cases. - If the result of the automatic segmentation is not acceptable, refine the shape of the segmented myocardium and/or LV cavity by enabling the Manual Mode (ROI Search Disabled).
- In the Modeling Tool, select the appropriate kinetic model to be used for dynamic PET analysis. In this case, select Graphical | Patlak to enable the Patlak plot analysis for the computation of the metabolic rate of glucose uptake (MRGlu) for each cardiac sector.
- In the polarmap tool, select the correct number of displayed heart segments. In this case, select 17 segments.
- Now, press the Fit button to perform the fitting procedure of the Patlak analysis.
- At the end of the fitting procedure, observe the displayed polar map of the Ki values (i.e., the slope of the linear regression expressed in mL/[mL × min]).
- Using the Ki values for each sector shown in a table, calculate the MRGlu using equation (2):
MRGlu = (Ki × PGlu)/LC (2)
where PGlu is a blood-sample-derived value of the plasma glucose concentration (mmol/L), and the lumped constant (LC) is an empirical coefficient used to compensate for the difference in uptake between normal glucose and FDG. See, for instance, Ng et al.22 for typical values of the lumped constant in various experimental conditions.
NOTE: Before starting PET analysis, it is good practice to visually inspect the dynamic sequence of PET volumes within the PET analysis software tool. This is necessary to exclude macroscopic animal motion between time frames during the study. If motion is present, proper image registration (outside of the scope of this protocol) should be carried out before analysis, if possible.

Figure 4: Reorientation tool of the PET analysis software. The projection of two simple line segments in 3D space is shown on each of the three standard planes (transaxial, coronal, and sagittal). The first segment allows the user to select the heart base and apex, while the second one allows for selecting the left and right sides of the heart. This step results in a new (interpolated) PET image (bottom row), with the heart reoriented along the standard AHA representation. Images were obtained with Carimas from a healthy adult male CD-1 mouse weighing 51 g and injected with 10 MBq of [18F]FDG. Abbreviations: PET = positron emission tomography; AHA = American Heart Association; FDG = fluorodeoxyglucose. Please click here to view a larger version of this figure.
10. Cine-CT cardiac analysis
NOTE: This section shows how to perform quantitative analysis of the Cine-CT cardiac image to collect global quantitative data of the heart function. The analysis is based on the Osirix MD software. The instructions below are not meant to be a replacement for the Osirix user manual24.
- Load the DICOM images of the Cine-CT scan in the software.
- Open the dynamic dataset with the built-in 4D viewer.
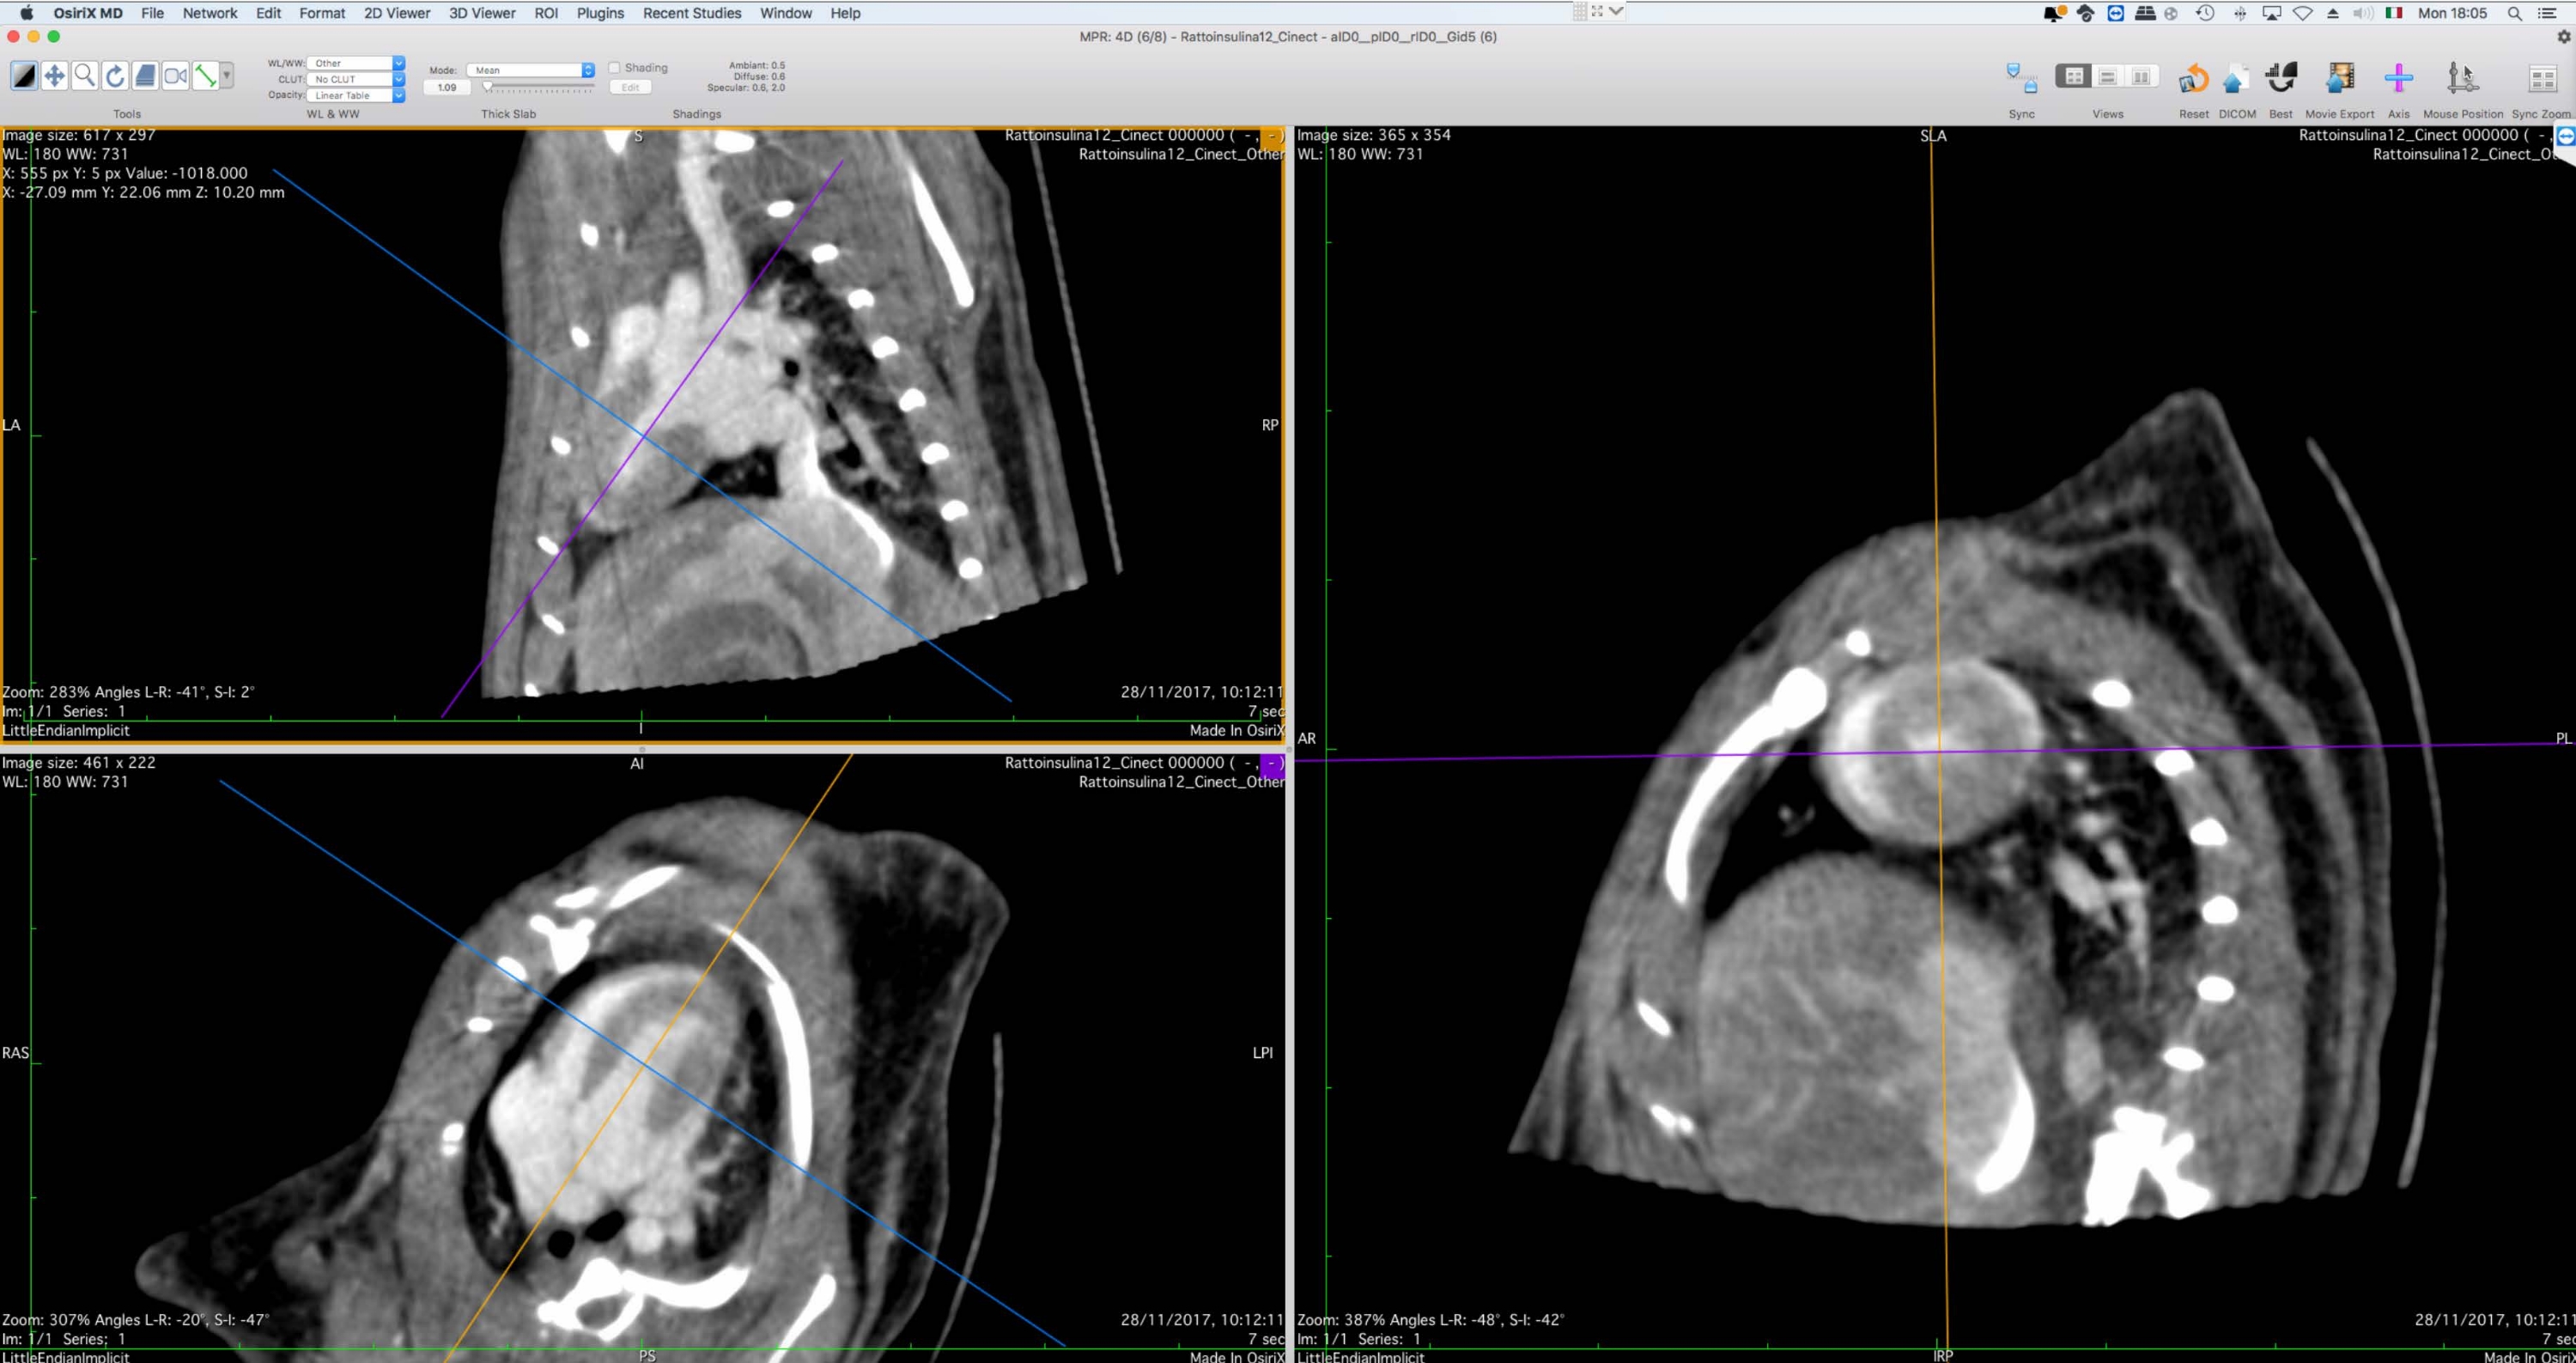
- Using the 3D Multiplanar Reformation (MPR) tool, reorient the image data along the short axis (Figure 5).
- Export the reoriented data to DICOM, ensuring that the entire 4D data are exported, with preserved slice thickness (same as the original) and image bit depth (16 bit per voxel)
- Open the exported 4D MPR images using the 4D viewer.
- Select a time frame corresponding to end-diastole. Browse through all the time frames with the time slider on the main toolbar to ensure that the correct cardiac phase is selected.
- On this time frame, pick the closed polygon annotation tool and manually delineate the endocardial wall of the LV.
- Do the same for 10-20 slices from the base to the apex, ensuring that all the ROIs have the same name (e.g., LVENDO).
- On the ROI menu, select ROI Volume | Generate missing ROIs to generate the ROIs on all the short axis slices by interpolation of the manually drawn ROIs.
- On the ROI menu, select ROI Volume | Compute Volume to calculate the volume of the ROI group with the same ROI name.
- Browse through the time frames and select a phase corresponding to end-systole (smaller LV volume) and repeat steps 10.7-10.10 above.
- Calculate the stroke volume (SV) and ejection fraction using equations (3) and (4):
SV = EDV - ESV[mL] (3)
EF = 100 × SV/EDV [%] (4)
where EDV is the end-diastolic volume and ESV is the end-systolic volume.

Figure 5: Graphical interface of the multiplanar reformation tool. This tool is used for the reorientation of the Cine-CT data for subsequent functional analysis. The user shall rotate and translate the reference axes on the left side of the screen in such a way that the short-axis view of the heart is shown on the right. At the end of this procedure, the user can export the reoriented images as a DICOM file set. The images were obtained with Osirix MD and refer to a healthy adult male Wistar rat (507 g) injected with 2 mL of iomeprol, 200 mg/mL, at a rate of 0.4 mL/min for 5 min, reconstructed with Filtered BackProjection with a voxel size of 0.24 mm3. Please click here to view a larger version of this figure.
Results
In this section, typical results are shown for both PET and CT analysis following the procedures described so far. Figure 6 shows the results of the automatic myocardial and LV cavity segmentation of the [18F]FDG PET scan of a control (healthy) CD-1 mouse. Even though the right ventricle is not always visible in the reconstructed images, the orientation axes based on the DICOM header can be used to correctly discriminate the interventricular septum from the other LV walls, as requ...
Discussion
The protocol presented in this paper focuses on a typical experimental procedure for translational cardiovascular research on small animal models of cardiac injury by using high-resolution PET/CT imaging. The presented results are indicative of the high quantitative and qualitative value of PET and Cine-CT images, providing both functional and structural information of the whole heart regarding its glucose metabolism, shape, and the dynamics of its contraction. Moreover, all the images obtained are 3D, time-resolved, and...
Disclosures
Daniele Panetta received grants for the R&D of micro-CT instrumentation from Inviscan Sas.
Acknowledgements
This research was supported in part by the JPI-HDHL-INTIMIC "GUTMOM" Project: Maternal obesity and cognitive dysfunction in the offspring: Cause-effect role of the GUT MicrobiOMe and early dietary prevention (project no. INTIMIC-085, Italian Ministry of Education, University and Research Decree no. 946/2019).
Materials
| Name | Company | Catalog Number | Comments |
| 0.9% sterile saline | Fresenius Kabi | 0.9% sodium chloride for injection | |
| 1025L Physiological Monitoring | Small Animal Instruments | Physiological monitoring system for small animal imaging | |
| 5 mL syringes | Artsana | Syringes with needle for injection of PET tracer | |
| Atomlab 500 | Else Nuclear | PET Dose calibrator | |
| Atrium software | Inviscan | Version 1.5.5 | PET/CT operating software |
| Butterfly catheters | Delta Med | 27.5 G needle | |
| Carimas software | Turku PET Center | Version 2.10 | Image analysis software |
| Fenestra VC | Medilumine | Lipid emulsion iodinated contrast agent for small animals | |
| Heat lamp | Heat lamp with clamp and switch | ||
| Insulin syringes | Artsana | Syringes with needle for injection of CT CA | |
| Iomeron 400 mgI/mL | Bracco | Iomeprol, vascular contrast agent | |
| IRIS PET/CT | Inviscan | PET/CT scanner for small animals | |
| Isoflurane | Zoetis | Inhalation anesthetic, 250 mL | |
| OneTouch Glucometer | Johnson&Johnson Medical | Glucose meter kit | |
| Osirix MD software | Pixmeo | Version 11 | Image analysis software |
| Oxygen | Air liquide | Compressed gas | |
| Rectal probe for 1025L | Small Animal Instruments | Rectal probe with cable for SAII 1025L systems | |
| Respiratory sensor for 1025L | Small Animal Instruments | Respiratory pillow with tubings for SAII 1025L systems | |
| TJ-3A syringe pump | Longer | Motorized syringe pump for CT CA injection |
References
- Zaragoza, C. Animal models of cardiovascular diseases. Journal of Biomedicine and Biotechnology. 2011, 497841 (2011).
- Russell, J. C., Proctor, S. D. Small animal models of cardiovascular disease: Tools for the study of the roles of metabolic syndrome, dyslipidemia, and atherosclerosis. Cardiovascular Pathology. 15 (6), 318-330 (2006).
- Riehle, C., Bauersachs, J. Small animal models of heart failure. Cardiovascular Research. 115 (13), 1838-1849 (2019).
- Menichetti, L., et al. MicroPET/CT imaging of αvß3 integrin via a novel 68Ga-NOTA-RGD peptidomimetic conjugate in rat myocardial infarction. European Journal of Nuclear Medicine and Molecular Imaging. 40 (8), 1265-1274 (2013).
- Zhou, H., et al. Development of a micro-computed tomography-based image-guided conformal radiotherapy system for small animals. International Journal of Radiation Oncology, Biology, Physics. 78 (1), 297-305 (2010).
- Di Lascio, N., Kusmic, C., Stea, F., Faita, F. Ultrasound-based pulse wave velocity evaluation in mice. Journal of Visualized Experiments. (120), e54362 (2017).
- Dann, M. M., et al. Quantification of murine myocardial infarct size using 2-D and 4-D high-frequency ultrasound. American Journal of Physiology-Heart and Circulatory Physiology. 322 (3), 359-372 (2022).
- Espe, E. K. Novel insight into the detailed myocardial motion and deformation of the rodent heart using high-resolution phase contrast cardiovascular magnetic resonance. Journal of Cardiovascular Magnetic Resonance. 15 (1), 82 (2013).
- Vanhove, C., et al. Accurate molecular imaging of small animals taking into account animal models, handling, anaesthesia, quality control and imaging system performance. EJNMMI Physics. 2 (1), 31 (2015).
- Garcia, M. J., et al. State of the art: Imaging for myocardial viability: A scientific statement from the American Heart Association. Circulation: Cardiovascular Imaging. 13 (7), 000053 (2020).
- Panetta, D., et al. Cardiac computed tomography perfusion: Contrast agents, challenges and emerging methodologies from preclinical research to the clinics. Academic Radiology. 28 (1), 1-18 (2020).
- Kusmic, C. Up-regulation of heme oxygenase-1 after infarct initiation reduces mortality, infarct size and left ventricular remodeling: experimental evidence and proof of concept. Journal of Translational Medicine. 12 (1), 89 (2014).
- Muthuramu, I., Lox, M., Jacobs, F., De Geest, B. Permanent ligation of the left anterior descending coronary artery in mice: A model of post-myocardial infarction remodelling and heart failure. Journal of Visualized Experiments. (94), e52206 (2014).
- Fischer, M., et al. Comparison of metabolic and functional parameters using cardiac 18F-FDG-PET in early to mid-adulthood male and female mice. EJNMMI Research. 11 (1), 7 (2021).
- Valenta, I., et al. Feasibility evaluation of myocardial cannabinoid type 1 receptor imaging in obesity: A translational approach. JACC: Cardiovascular Imaging. 11 (2), 320-332 (2018).
- Fueger, B. J., et al. Impact of animal handling on the results of 18F-FDG PET studies in mice. Journal of Nuclear Medicine. 47 (6), 999-1006 (2006).
- . Carimas User Manual Available from: https://turkupetcentre.fl/carimas/files/archive/Html/a1.html (2022)
- Peters, A. M. Graphical analysis of dynamic data: The Patlak-Rutland plot. Nuclear Medicine Communications. 15 (9), 669-672 (1994).
- Choi, Y., et al. Parametric images of myocardial metabolic rate of glucose generated from dynamic cardiac PET and 2-[18F]fluoro-2-deoxy-d-glucose studies. Journal of Nuclear Medicine. 32 (4), 733-738 (1991).
- Laffon, E., Marthan, R. Is Patlak y-intercept a relevant metrics. European Journal of Nuclear Medicine and Molecular Imaging. 48 (5), 1287-1290 (2021).
- Flores, J. E., McFarland, L. M., Vanderbilt, A., Ogasawara, A. K., Williams, S. -. P. The effects of anesthetic agent and carrier gas on blood glucose and tissue uptake in mice undergoing dynamic FDG-PET imaging: Sevoflurane and isoflurane compared in air and in oxygen. Molecular Imaging and Biology. 10 (4), 192-200 (2008).
- Ng, C. K. Sensitivity of myocardial fluorodeoxyglucose lumped constant to glucose and insulin. American Journal of Physiology-Heart and Circulatory Physiology. 260 (2), 593-603 (1991).
- Shoghi, K. I., Welch, M. J. Hybrid image and blood sampling input function for quantification of small animal dynamic PET data. Nuclear Medicine and Biology. 34 (8), 989-994 (2007).
- Heuberger, J., Pixmeo, S., Rosset, A. OsiriX User Manual. Blurb. , (2017).
- Cerqueira, M. D., et al. Standardized myocardial segmentation and nomenclature for tomographic imaging of the heart. A statement for healthcare professionals from the Cardiac Imaging Committee of the Council on Clinical Cardiology of the American Heart Association. Circulation. 105 (4), 539-542 (2002).
- Kolanowski, T. J., et al. Multiparametric evaluation of post-MI small animal models using metabolic ([18F]FDG) and perfusion-based (SYN1) heart viability tracers. International Journal of Molecular Sciences. 22 (22), 12591 (2021).
- Guiducci, L., et al. Contribution of organ blood flow, intrinsic tissue clearance and glycaemia to the regulation of glucose use in obese and type 2 diabetic rats: A PET study. Nutrition Metabolism and Cardiovascular Diseases. 21 (9), 726-732 (2011).
- Tadinada, S. M., et al. Functional resilience of C57BL/6J mouse heart to dietary fat overload. American Journal of Physiology-Heart and Circulatory Physiology. 321 (5), 850-864 (2021).
- Dreyfuss, A. D., et al. A novel mouse model of radiation-induced cardiac injury reveals biological and radiological biomarkers of cardiac dysfunction with potential clinical relevance. Clinical Cancer Research. 27 (8), 2266-2276 (2021).
- Hsu, B. PET tracers and techniques for measuring myocardial blood flow in patients with coronary artery disease. Journal of Biomedical Research. 27 (6), 452-459 (2013).
- Dinkel, J., et al. Intrinsic gating for small-animal computed tomography. Circulation: Cardiovascular Imaging. 1 (3), 235-243 (2008).
- Kuntz, J., et al. Fully automated intrinsic respiratory and cardiac gating for small animal CT. Physics in Medicine and Biology. 55 (7), 2069-2085 (2010).
- Li, Y., Zhang, W., Wu, H., Liu, G. Advanced tracers in PET imaging of cardiovascular disease. BioMed Research International. 2014, 504532 (2014).
- Kim, D. -. Y., Cho, S. -. G., Bom, H. -. S. Emerging tracers for nuclear cardiac PET imaging. Nuclear Medicine and Molecular Imaging. 52 (4), 266-278 (2018).
- Maddahi, J., Packard, R. R. S. Cardiac PET perfusion tracers: Current status and future directions. Seminars in Nuclear Medicine. 44 (5), 333-343 (2014).
- Bentourkia, M. Kinetic modeling of PET data without blood sampling. IEEE Transactions on Nuclear Science. 52 (3), 697-702 (2005).
- Lammertsma, A. A. Forward to the past: The case for quantitative PET imaging. Journal of Nuclear Medicine. 58 (7), 1019-1024 (2017).
- Nahrendorf, M., et al. High-resolution imaging of murine myocardial infarction with delayed-enhancement cine micro-CT. American Journal of Physiology-Heart and Circulatory Physiology. 292 (6), 3172-3178 (2007).
- Badea, C. T., Fubara, B., Hedlund, L. W., Johnson, G. A. 4-D micro-CT of the mouse heart. Molecular Imaging. 4 (2), 110-116 (2005).
- Technical Resources. MediLumine Available from: https://www.medilumine.com/technical-resources (2019)
- Nebuloni, L., Kuhn, G. A., Müller, R. A Comparative analysis of water-soluble and blood-pool contrast agents for in vivo vascular imaging with micro-CT. Academic Radiology. 20 (10), 1247-1255 (2013).
- Panetta, D., et al. Performance evaluation of the CT component of the IRIS PET/CT preclinical tomograph. Nuclear Instruments & Methods in Physics Research Section A: Accelerators Spectrometers Detectors and Associated Equipment. 805, 135-144 (2016).
- Gu, J., et al. At what dose can total body and whole abdominal irradiation cause lethal intestinal injury among C57BL/6J mice. Dose-Response. 18 (3), 1559325820956783 (2020).
- Amirrashedi, M., Zaidi, H., Ay, M. R. Advances in preclinical PET instrumentation. PET Clinics. 15 (4), 403-426 (2020).
- Clark, D. P., Badea, C. T. Advances in micro-CT imaging of small animals. Physica Medica. 88, 175-192 (2021).
- Belcari, N., Del Guerra, A., Panetta, D., Grupen, C., Buvat, I. High-Resolution and Animal Imaging Instrumentation and Techniques. Handbook of Particle Detection and Imaging. , 1497-1535 (2021).
- Wang, G., Rahmim, A., Gunn, R. N. PET Parametric imaging: Past, present, and future. IEEE Transactions on Radiation and Plasma Medical Sciences. 4 (6), 663-675 (2020).
- Befera, N. T., Badea, C. T., Johnson, G. A. Comparison of 4D-microSPECT and microCT for murine cardiac function. Molecular Imaging and Biology. 16 (2), 235-245 (2014).
- van Deel, E., Ridwan, Y., van Vliet, J. N., Belenkov, S., Essers, J. In vivo quantitative assessment of myocardial structure, function, perfusion and viability using cardiac micro-computed tomography. Journal of Visualized Experiments. (108), e53603 (2016).
- Lee, C. -. L., et al. Assessing cardiac injury in mice with dual energy-microCT, 4D-microCT and microSPECT imaging following partial-heart irradiation. International Journal of Radiation Oncology, Biology, Physics. 88 (3), 686-693 (2014).
- Harms, H., et al. Comparison of clinical non-commercial tools for automated quantification of myocardial blood flow using oxygen-15-labelled water PET/CT. European Heart Journal - Cardiovascular Imaging. 15 (4), 431-441 (2013).
- Nesterov, S. V., et al. Myocardial perfusion quantitation with 15O-labelled water PET: High reproducibility of the new cardiac analysis software (CarimasTM). European Journal of Nuclear Medicine and Molecular Imaging. 36 (10), 1594-1602 (2009).
- Nesterov, S. V., et al. Myocardial perfusion quantification with Rb-82 PET: Good interobserver agreement of Carimas software on global, regional, and segmental levels. Annals of Nuclear Medicine. 36, 507-514 (2022).
- Nesterov, S. V., et al. One-tissue compartment model for myocardial perfusion quantification with N-13 ammonia PET provides matching results: A cross-comparison between Carimas, FlowQuant, and PMOD. Journal of Nuclear Cardiology. , (2021).
- Thackeray, J. T., Kuntner-Hannes, C., Haemisch, Y. Preclinical Multimodality Imaging and Image Fusion in Cardiovascular Disease. Image Fusion in Preclinical Applications. , 161-181 (2019).
- Vohra, R., Batra, A., Forbes, S. C., Vandenborne, K., Walter, G. A. Magnetic resonance monitoring of disease progression in mdx mice on different genetic backgrounds. The American Journal of Pathology. 187 (9), 2060-2070 (2017).
- Baehr, A., et al. Agrin promotes coordinated therapeutic processes leading to improved cardiac repair in pigs. Circulation. 142 (9), 868-881 (2020).
- Lalwani, K., et al. Contrast agents for quantitative microCT of lung tumors in mice. Comparative Medicine. 63 (6), 482-490 (2013).
- Bertoldo, A., et al. Evaluation of compartmental and spectral analysis models of [18F]FDG kinetics for heart and brain studies with PET. IEEE Transactions on Bio-medical Engineering. 45 (12), 1429-1448 (1998).
- Li, Y., Kundu, B. K. An improved optimization algorithm of the three-compartment model with spillover and partial volume corrections for dynamic FDG PET images of small animal hearts in vivo. Physics in Medicine and Biology. 63 (5), 055003 (2018).
- Mabrouk, R., Dubeau, F., Bentourkia, M., Bentabet, L. Extraction of time activity curves from gated FDG-PET images for small animals' heart studies. Computerized Medical Imaging and Graphics. 36 (6), 484-491 (2012).
Reprints and Permissions
Request permission to reuse the text or figures of this JoVE article
Request PermissionThis article has been published
Video Coming Soon
Copyright © 2025 MyJoVE Corporation. All rights reserved