
需要订阅 JoVE 才能查看此. 登录或开始免费试用。
Method Article
利用细胞外通量分析探索单个3D微组织球体的线粒体能量代谢
Erratum Notice
摘要
这些方案将帮助用户使用Seahorse细胞外通量分析来探测3D癌细胞系衍生球体中的线粒体能量代谢。
摘要
近年来,三维(3D)细胞聚集体(称为球状体)已成为 体外 细胞培养的最前沿。与将细胞培养为二维单细胞单层(2D培养)相比,球状细胞培养促进,调节和支持 体内存在的生理细胞结构和特征,包括细胞外基质蛋白的表达,细胞信号传导,基因表达,蛋白质产生,分化和增殖。3D培养的重要性已在许多研究领域得到认可,包括肿瘤学,糖尿病,干细胞生物学和组织工程。在过去的十年中,已经开发了改进的方法来产生球状体并评估其代谢功能和命运。
细胞外通量(XF)分析仪已用于探索3D微组织中的线粒体功能,例如使用XF24胰岛捕获板或XFe96球状微孔板的球状体。然而,尚未详细描述使用XF技术探测球体中线粒体能量代谢的不同方案和优化。本文提供了使用球状微孔板和XFe96 XF分析仪探测单个3D球体中线粒体能量代谢的详细方案。使用不同的癌细胞系,XF技术被证明能够区分3D球体中的细胞呼吸,不仅具有不同的大小,而且具有不同的体积,细胞数量,DNA含量和类型。
使用寡霉素,BAM15,鱼藤酮和抗霉素A的最佳线粒体效应器化合物浓度来探测3D球体中线粒体能量代谢的特定参数。本文还讨论了对从球体获得的数据进行归一化的方法,并讨论了在使用XF技术探索球体代谢时应考虑的许多注意事项。该协议将有助于推动先进 体外 球体模型的研究。
引言
在过去的20年中,生物研究中体外模型的进步迅速发展。这些模型现在包括器官芯片模式,类器官和3D微组织球体,所有这些都已成为改善体外和体内研究之间转换的共同焦点。先进体外模型的使用,特别是球体,跨越多个研究领域,包括组织工程、干细胞研究、癌症和疾病生物学1,2,3,4,5,6,7,以及安全性测试,包括遗传毒理学8,9,10,纳米材料毒理学11,12、13、14、药品安全有效性检测8、15、16、17、18、19。
正常的细胞形态对生物表型和活性至关重要。将细胞培养成3D微组织球体允许细胞采用形态,表型功能和结构,更类似于 在体内 观察到的,但很难用经典的单层细胞培养技术捕获。 无论是在体内 还是在 体外, 细胞功能都直接受到细胞微环境的影响,其不仅限于细胞通信和编程(例如,细胞 - 细胞连接形成,形成细胞生态位的机会);细胞暴露于直接环境中的激素和生长因子(例如,细胞细胞因子暴露作为炎症反应的一部分);物理和化学基质的组成(例如,细胞是在坚硬的组织培养塑料中生长还是在弹性组织环境中生长);最重要的是,细胞代谢如何受到营养和氧气获取以及代谢废物(如乳酸)的加工的影响。
代谢通量分析是检查定义的 体外 系统中细胞代谢的一种有效方法。具体而言,XF技术允许分析完整细胞和组织的细胞生物能量学的实时变化。鉴于许多细胞内代谢事件发生在几秒钟到几分钟的量程内,实时功能方法对于了解 体外完整细胞和组织中细胞代谢通量的实时变化至关重要。
本文提供了使用强制聚集方法将癌症衍生细胞系A549(肺腺癌),HepG2 / C3A(肝细胞癌),MCF-7(乳腺癌)和SK-OV-3(卵巢腺癌)培养为 体外 3D球体模型的方案(图1)。它还 (i) 详细描述了如何使用 Agilent XFe96 XF 分析仪探测单个 3D 球体的线粒体能量代谢,(ii) 重点介绍了使用单个 3D 球体优化 XF 测定的方法,以及 (iii) 讨论了使用此方法探测 3D 球体代谢的重要考虑因素和局限性。最重要的是,本文描述了如何收集数据集,允许计算耗氧率(OCR)以确定氧化磷酸化,从而确定细胞球体中的线粒体功能。虽然没有针对该方案进行分析,但细胞外酸化率(ECAR)是XF实验中与OCR数据一起测量的另一个参数。但是,ECAR通常从XF数据集中解释得很差或不正确。我们针对按照技术制造商提供的基本方法计算 ECAR 的局限性进行了评论。
Access restricted. Please log in or start a trial to view this content.
研究方案

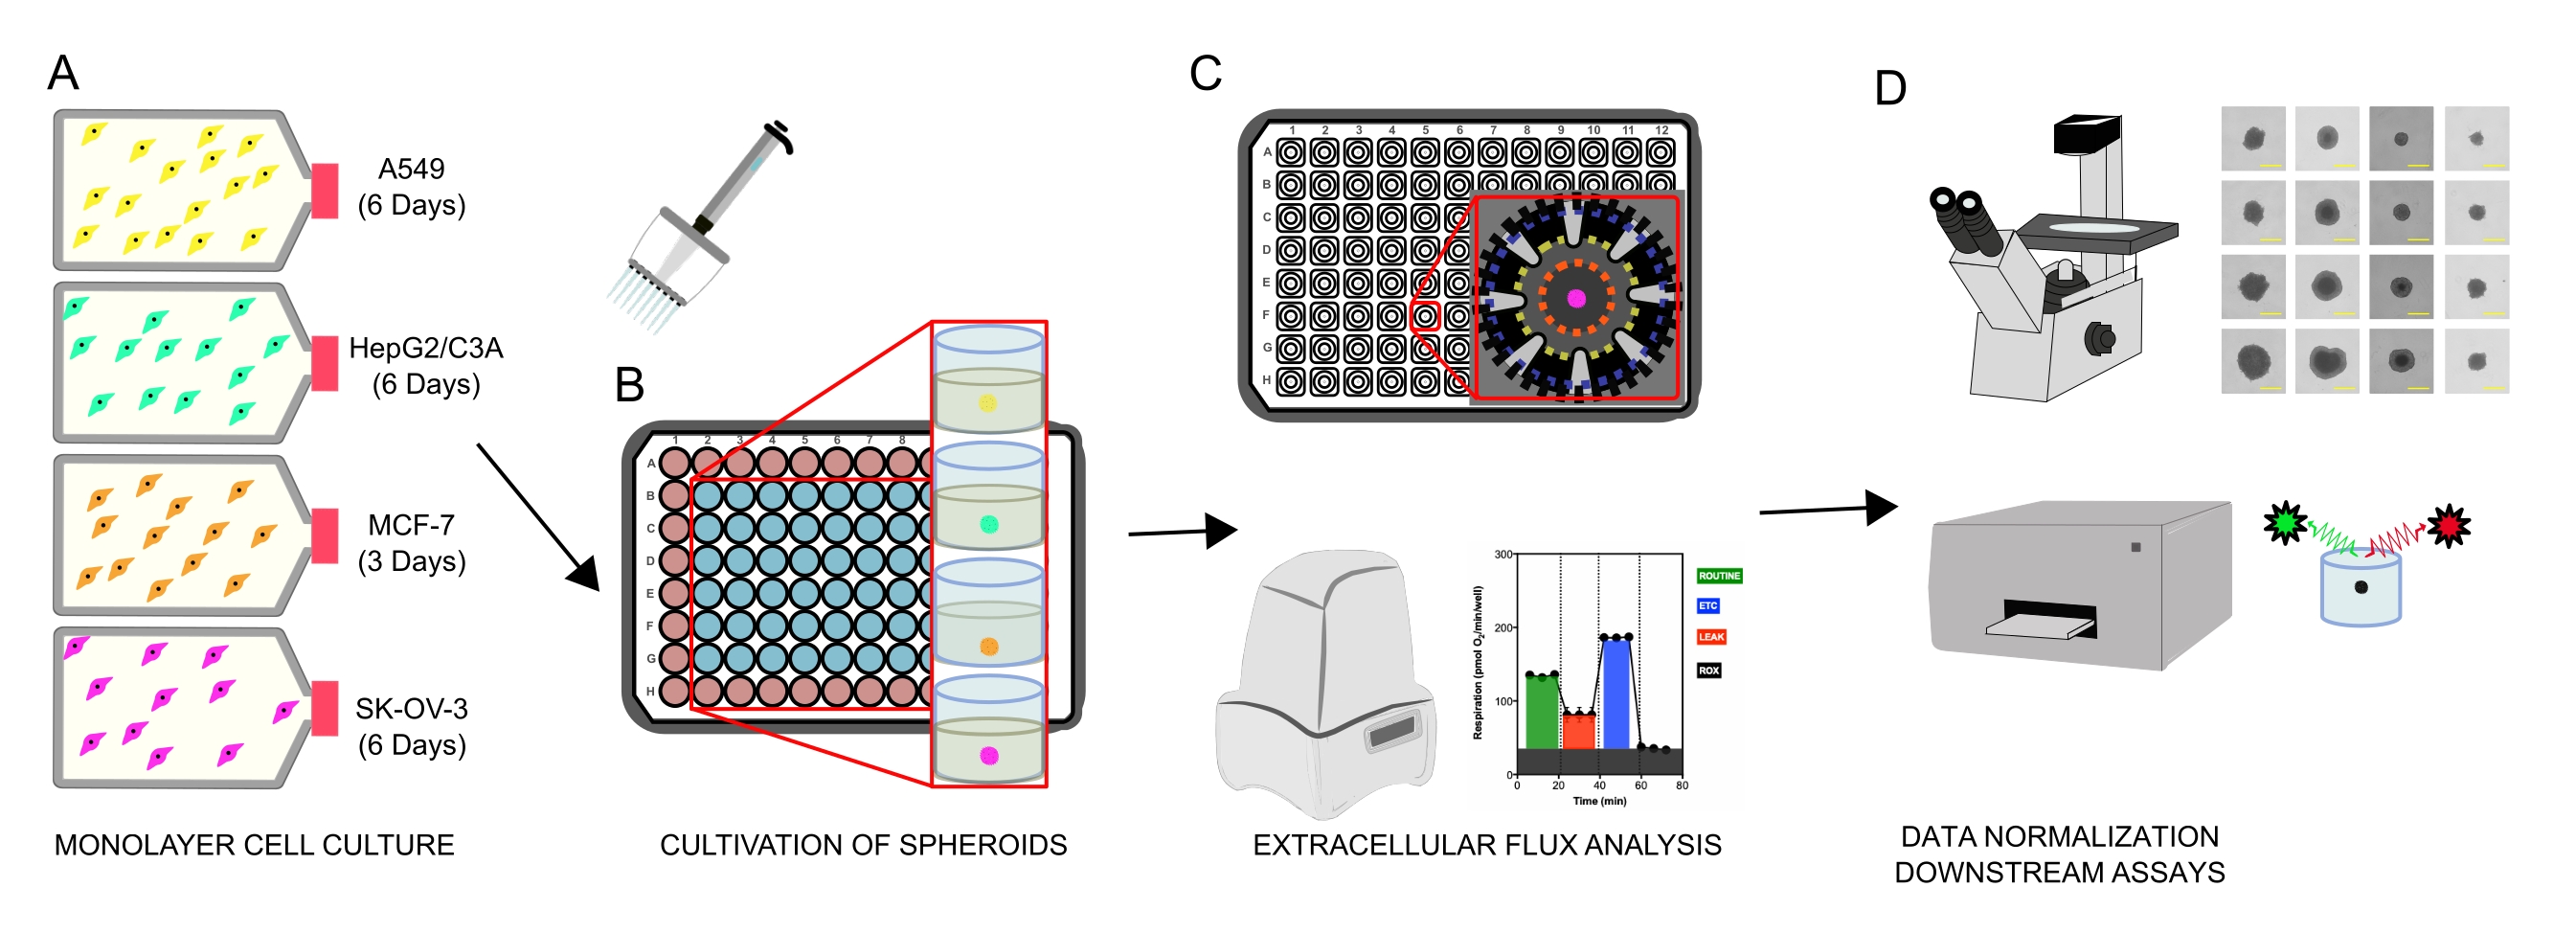
图 1:用于生成细胞球体、细胞外通量分析和下游测定的图形工作流程。 将四个癌细胞系选择性地培养为单层(A),从组织培养瓶中分离,并接种到超低附着物96孔微孔板中以形成球状体(B)。将A549肺癌、HepG2/C3A肝癌、SK-OV-3卵巢腺癌和MCF-7乳腺癌细胞接种于1×103-8×103 个细胞/孔,长大至7 d,形成单个球体,并通过连续观察和平面测量优化球体接种密度和培养时间。形成后,将单个球体洗涤到无血清XF培养基中,并小心地接种到球体测定微孔板中,并用聚-D-赖氨酸(C)预涂。使用XFe96分析仪对球体进行细胞外通量分析,使用几种方案来解决:(1)基础线粒体呼吸反应的最佳球体尺寸;(2)优化线粒体呼吸抑制剂滴定;(3)优化微孔板孔内球体放置。(D)使用XF后分析,相差显微镜和球体DNA定量进行数据归一化和其他下游 体外 测定。 请点击此处查看此图的大图。
1. 将癌细胞系培养为3D 体外 球状体
| 细胞系 | 描述 | 培养基 | 源 |
| 空客A549 | 肺癌细胞系 | 转速 1640 | 欧洲认证细胞培养物收集 (ECACC) |
| 丙酮酸钠(1 mM) | |||
| 青霉素- 链霉素 - (100 U/mL – 100 毫克/毫升) | |||
| 10 % (v/v) 断续器 | |||
| 七氢呋喃 2/丙三酸 | 肝癌细胞系,母体HepG2细胞系的克隆衍生物 | 断续器 | 美国组织培养收集 |
| 青霉素- 链霉素 - (100 U/mL – 100 毫克/毫升) | |||
| 10 % (v/v) 断续器 | |||
| 断续器7 | 乳腺癌细胞系 | 转速 1640 | 欧洲认证细胞培养物收集 (ECACC) |
| 丙酮酸钠(1 mM) | |||
| 青霉素- 链霉素 - (100 U/mL – 100 毫克/毫升) | |||
| 10 % (v/v) 断续器 | |||
| 断续器-3 | 卵巢腺癌细胞系 | 转速 1640 | 欧洲认证细胞培养物收集 (ECACC) |
| 丙酮酸钠(1 mM) | |||
| 青霉素- 链霉素 - (100 U/mL – 100 毫克/毫升) | |||
| 10 % (v/v) 断续器 | |||
| 元件 | RPMI 检测培养基(50 mL 终体积) | ||
| 基础介质 | 安捷伦海马 XF RPMI, pH 7.4 | ||
| 葡萄糖(1M无菌储备) | 11 mM(0.55 mL 储备溶液) | ||
| L-谷氨酰胺(200 mM无菌储备) | 2 毫升(0.5 毫升储备溶液) | ||
| 丙酮酸钠(100 mM无菌储备) | 1 毫升(0.5 毫升储备溶液) |
表1:癌细胞系培养基和XF培养基组成。
- 使用标准无菌组织培养技术培养所有细胞系,并使用合适的检测试剂盒确认它们不含支原体。
- 使用推荐的培养基在T75组织培养瓶或等效物中培养细胞系(表1)。将细胞系培养至65-80%汇合度,并定期传代至最多25次传代。
- 在杜贝克的改性磷酸盐缓冲盐水(DBPS)中冲洗细胞培养瓶两次。
- 用3mL细胞解离试剂(参见 材料表)在37°C下将细胞从烧瓶中分离5分钟,并通过显微镜确认分离。
- 轻轻吸出分离的细胞悬浮液以确保单细胞悬浮液,并用7mL完整组织培养基使细胞解离试剂失活。
- 通过以300× g 离心5分钟收集细胞,弃去上清液,并将细胞重悬于完全培养基中。
- 使用血细胞计数器或自动细胞计数器计数细胞,并滴定为接种所需的细胞密度。
注意:要以100μL/孔以4×103 个细胞/孔接种整个96孔板,应将细胞滴定至4×104 个细胞/ mL,推荐体积为12 mL。 - 将细胞悬浮液倾倒到无菌储液槽中,并使用多通道移液器将100μL细胞悬浮液分配到细胞排斥微孔的每个孔中。
注意:只有微孔板的内部60孔应接种,其余孔用DPBS填充。这将形成蒸发屏障,确保整个板的球体均匀性,并最大限度地减少板边缘效应。 - 将球状微孔板以300× g 离心15分钟,以迫使细胞进入松散的聚集体。
- 将板在37°C,5%CO2 下孵育至少3天以确保球状物形成。
- 使用标准化的实验室实践进行相差显微镜检查,以监测球体的生长。通过进行半体积培养基更换,每3天或每周补充两次细胞培养基。
2. 使用细胞外通量(XF)技术探测单个球体的线粒体能量代谢
- 检测准备(前一天)
- 使用相差为4倍放大倍率的倒置光学显微镜检查球体活力,以确保样品之间的完整球体结构,形态和整体均匀性。
- 为传感器墨盒补水。
- 将~20 mL口径滴入锥形管中。
- 将含有口径的锥形管置于非CO2 37°C培养箱中过夜。
- 从测定试剂盒中取出内容物。
- 从实用板上取下传感器滤芯,并将其倒置放在实用板旁边的工作台面上。
- 使用多通道P300移液管将200μL无菌ddH2O移液到传感器盒实用程序板的每个孔中。
- 将传感器盒放在公用设施板的顶部。
- 检查每个孔中的水位是否足够高,可以淹没传感器探头。
- 将组装好的传感器盒转移到非 CO2 37 °C 培养箱中,并保持过夜。
注意:此步骤可以在测定开始前12-72小时进行。
- 涂层球状体测定微孔板
- 使用无菌技术,将30μL /孔的无菌聚-D-赖氨酸(0.1mg / mL)溶液加入球状微孔板中,并在室温下孵育30分钟。
- 从球状微孔板的每个孔中吸出溶液,倒置板,然后将其牢固地敲击到薄纸上以除去任何残留的溶液。
- 用200μL /孔的无菌ddH2O洗涤板两次。
- 最后一次洗涤后,倒置微孔板并将其牢固地拍打到薄纸上以除去任何残留的水。
- 在使用前让板风干30分钟,或将其储存在4°C以备将来使用。
注意:球状体测定微孔板应涂有分子粘合剂,以确保球状物固定在微孔板的底部。如果没有分子粘合剂,球状体会脱落并干扰测定结果。其他分子粘合剂也可用作聚-D-赖氨酸的替代品,用于预涂板。预涂板可以储存在4°C,但在测定开始之前应保持平衡至室温。
- 制备XF测定培养基
- 制备XF RPMI培养基,如 表1所示,并使用0.22μm注射器过滤器进行无菌过滤器
- 测定准备(测定前1小时)
- 将补充的XF RPMI测定培养基预热至37°C。
- 将包被的球体测定微孔板预热在非CO2 37°C培养箱或干浴中。
- 准备传感器盒。
- 从空气培养箱中取出装有口径和传感器盒的锥形管。
- 从实用板上取下传感器盒,并将其倒置在工作台面上。
- 使用P300多通道移液器,从实用板中吸出水并将其丢弃。
- 将校准剂溶液倒入无菌试剂储液槽中,并使用P300多通道移液器将200μL/孔的预热校准剂加入实用板中。
- 拿起传感器滤芯并将其放回实用板的顶部,确保传感器完全浸没在校准液中。
- 将组装好的传感器滤芯移回非 CO2 37 °C 培养箱中,直到准备好装载端口注射液。
- 用测定培养基洗涤球状体。
- 从37°C,5%CO2 培养箱中取出球体培养板,并在显微镜下观察球体,以确保其在球体转移步骤之前的完整性。
- 用180μL/孔的预热测定培养基(包括任何背景校正孔)加载球状板的所有孔。
- 用3mL测定培养基部分填充7厘米培养皿。
- 使用装有宽孔口移液器吸头的多通道移液器,通过将移液器的抽吸体积设置为10-50μL,将球状体从96孔培养板转移到7cm培养皿中。
- 将种子球状体放入预包被的球状体测定微孔板中。
- 使用解剖显微镜和灯箱装置,将球体从培养皿转移到球体测定微孔板,如下所述。
- 将装有宽孔移液器吸头的单通道移液器的体积设置为20μL,并小心地吸出单个球体。将吸头直接置于球体测定微孔板的每个孔的中心,并允许重力将单个球体洗脱到每个孔的中心,即不要从移液器吸头中排出任何培养基,并允许毛细管作用从移液器吸头中取出球体。为了确认洗脱,可以在显微镜下将移液器的内容物移回7厘米培养皿中。
注意:单个球体的重力洗脱通常需要15-30秒,具体取决于球体的大小/密度。在此期间,不应取出移液器。任何背景校正孔都应不含球状体,并且仅含有测定培养基。在显微镜下,确认每个球体的位置。理想情况下,每个球体应位于每个孔的中心。 - 一旦所有球状体都转移到球状体测定微孔板中,在测定前将板转移到37°C的非CO2 培养箱中至少1小时。
- 将装有宽孔移液器吸头的单通道移液器的体积设置为20μL,并小心地吸出单个球体。将吸头直接置于球体测定微孔板的每个孔的中心,并允许重力将单个球体洗脱到每个孔的中心,即不要从移液器吸头中排出任何培养基,并允许毛细管作用从移液器吸头中取出球体。为了确认洗脱,可以在显微镜下将移液器的内容物移回7厘米培养皿中。
- 使用解剖显微镜和灯箱装置,将球体从培养皿转移到球体测定微孔板,如下所述。
3. 制备化合物并将其装载到XF测定的传感器盒中
| 注射策略 | 复合(端口) | XFe96 微孔起始体积 (μL) | 所需的终井浓度 | 端口体积(μL) | 最终 XFe96 微孔体积注射后 (μL) | 工作库存集中 |
| 1 | 寡霉素 (A) | 180 | 3微克/毫升 | 20 | 200 | 30微克/毫升 |
| 鱼藤酮 (B) | 200 | 2 微米 | 20 | 220 | 22 微米 | |
| 抗霉素 A (B) | 200 | 2 微米 | 20 | 220 | 22 微米 | |
| 2 | 巴姆15 (A) | 180 | 5 微米 | 20 | 200 | 50 微米 |
| 鱼藤酮 (B) | 200 | 2 微米 | 20 | 220 | 22 微米 | |
| 抗霉素 A (B) | 200 | 2 微米 | 20 | 220 | 22 微米 |
表2:使用XFe96分析仪探测单个3D球体的线粒体能量代谢的线粒体化合物浓度。
- 使用完全补充的预热XF RPMI测定培养基制备 表2 中所述的每种化合物的工作储备浓度。
- 按列方向定位墨盒板(与实用板耦合),从左到右 1-12。
- 如果使用装载导轨,请根据装井程序将其放置在墨盒板上,例如,如果首先装载端口A,请确保 A 在导轨的左上角可见。
- 将每种化合物的工作溶液转移到合适的储液槽中,并使用校准的P100多通道移液器将20μL分配到所有相应的端口中。对每个化合物重复上述步骤,将其放入其余端口中。
注意:如果传感器盒板上未使用任何端口,则可以将其留空或填充测定培养基。如果只选择特定的端口号,请确保与该字母对应的其他端口装载了测定介质;否则,空气将被注入井中,从而影响这些井中的结果。 - 端口加载后,取下板加载导轨(如果使用)并准备分析仪以加载传感器盒。
注意:如果在加载端口后未立即进行测定,请将盖子放回传感器盒上,并将板放回37°C空气培养箱中,直到准备好装入机器。
4. 分析设计、注射策略和数据采集
- 运行检测
- 打开分析仪电源并连接到控制器(计算机)。
注:这可以通过波形控制器软件小部件面板中的仪器连接状态进行验证。 - 导航到WAVE软件中的 模板 页面,找到实验的检测模板文件,然后双击将其打开。
注意:如果检测模板未出现在 "模板" 视图中,请将模板文件从共享网络驱动器或 USB 闪存驱动器导入模板文件夹。 - 要开始检测,请单击 运行检测 选项卡。
注意:如果在板图中正确分配了组定义,则分析将准备好按照页面右侧绿色勾号所示运行。在此阶段,可以在测定摘要页面或空白页面上输入任何其他信息;继续执行下一步。由于线粒体调制器在3D微组织球体中的延迟穿透(图2),请使用 表3中描述的测量方案信息。
- 打开分析仪电源并连接到控制器(计算机)。
| 测量周期 | 注入编号和端口 | 测量细节 | 周期持续时间(小时:分钟:秒) |
| 校准 | 不適用 | XF分析仪始终执行此校准,以确保测量准确 | 00:20:00(这是平均值,可能因机器而异) |
| 平衡 | 不適用 | 校准后发生平衡,建议使用。 | 00:10:00 |
| 基底 | 不適用 | 周期 = 5 | 00:30:00 |
| 混合 = 3:00 | |||
| 等待 = 0:00 | |||
| 测量 = 3:00 | |||
| 寡霉素/BAM15 | 注入 1(端口 A) | 周期 = 10 | 01:00:00 |
| 混合 = 3:00 | |||
| 等待 = 0:00 | |||
| 测量 = 3:00 | |||
| 鱼藤酮 + 抗霉素 A | 注入 2(端口 B) | 周期 = 10 | 01:00:00 |
| 混合 = 3:00 | |||
| 等待 = 0:00 | |||
| 测量 = 3:00 | |||
| 总时间: | 03:00:00 | ||
表 3:使用 XFe96 分析仪探测单个 3D 球体的线粒体能量代谢的实验方案设置。
- 单击 "开始运行 "以显示 保存位置 对话框。
- 输入结果文件的 保存位置 ,然后将组装好的传感器盒放在分析仪侧面门上显示的热托盘上。等待热托盘自动打开,并等待屏幕显示 "装载校准器"实用程序板 消息。在按照屏幕上的提示操作之前,请确保 i) 传感器墨盒正确安装在实用板上,ii) 盖子已从传感器盒上取下,以及 iii) 传感器盒在实用板上的正确方向。
- 按照屏幕上的命令启动传感器盒校准。
注意:完成校准所需的时间约为10-20分钟(用于37°C下的测定)。 - 传感器盒校准后,按照波形控制器上的屏幕说明将球形微孔板加载到分析仪中,以启动12分钟的平衡步骤。
注意:带有白色勾号的绿色框表示该孔的"良好"校准。如果任何孔未能提供"良好"校准,则将用红色框和白色十字表示。在使用修饰测定选项卡完成测定后,应注意此类孔并将其排除在任何 分析 之外。 - 等待分析仪在机器完成平衡步骤后自动开始采集基线测量值(如仪器协议中所述)。
- 要完成实验,请按照 WAVE 控制器上的屏幕命令进行操作。
注意:从分析仪中取出球状微孔板后,丢弃传感器盒,并留出球状板,以便在必要时进行进一步分析(例如,双链(ds)DNA定量)。如果进一步分析不需要微孔板,可以将其与传感器盒一起丢弃。 - 等待分析对话框出现并查看结果或返回 模板 视图。
5. 数据归一化和分析策略 - 分析后归一化和下游分析(可选步骤)
- 数据规范化
- 要对球体数据进行归一化,请参阅与数据归一化策略相关的一系列方案,用于计算球体大小和体积以及量化球体测定中的 dsDNA。这些已作为补充文件列入;请参阅 补充文件 1 和 补充文件 2。
- 数据分析
- 要将数据导出到其中一个自动分析发生器中,请按照WAVE控制器上的数据导出命令进行操作,然后选择与测定类型匹配的导出发生器。或者,导出数据文件并将其上传到海马分析中。
注意:报告生成器和Seahorse分析的缺点是数据分析仅限于XF分析的设计方式,并且不允许在整个测量周期中取平均值。从仪器软件手动导出数据集允许用户在这方面偏好。鉴于用于评估3D球体的线粒体呼吸的注射策略可能与典型的"MitoStress"测试不同,因此已经开发了一系列电子表格模板来帮助分析这些数据集,特定于3D细胞培养物,并将根据要求提供。这些数据模板文件将提供有关关键线粒体呼吸参数的数据,详见 图2并加以说明。 - 要分析数据,请从WAVE控制器软件将数据导出为电子表格报告,并使用独立的电子表格模板进行分析。
- 要将数据导出到其中一个自动分析发生器中,请按照WAVE控制器上的数据导出命令进行操作,然后选择与测定类型匹配的导出发生器。或者,导出数据文件并将其上传到海马分析中。

图 2:从细胞外通量数据分析派生参数的示意图描述符。 简称:OCR = 耗氧率。 请点击此处查看此图的大图。
Access restricted. Please log in or start a trial to view this content.
结果
为了获得形状良好的致密球体,每个细胞系分别针对接种密度和培养持续时间进行了优化(图3)。A549,HepG2 / C3A和SK-OV-3细胞系最初形成松散的聚集体,直到培养7天后才进展为具有明确定义周长的圆形球状体。相反,MCF-7细胞可以在3天内形成球状体。所有球体模型的初始细胞接种密度与培养期后的球体体积之间存在明显的相关性。根据接种密度优化了球体尺寸和形态。在所?...
Access restricted. Please log in or start a trial to view this content.
讨论
二. 主要结论和产出
本文提供了使用XFe96 XF分析仪的一系列癌症衍生细胞系探测单个3D球体的线粒体能量代谢的详细方案。开发并描述了一种利用细胞排斥技术强制聚集快速培养A549、HepG2/C3A、MCF7和SK-OV-3细胞球体的方法。该协议解决了使用XF技术探测球体代谢的许多考虑因素,包括(1)球体培养方案的优化以及将球体处理和转移到技术制造商从其原始培养容器中分离到特定球体测定?...
Access restricted. Please log in or start a trial to view this content.
披露声明
作者没有利益冲突需要声明。
致谢
新泽西州获得了与系统发现有限公司(BB/M01116X/1,1940003)的BBSRC MIBTP案例奖的支持
Access restricted. Please log in or start a trial to view this content.
材料
| Name | Company | Catalog Number | Comments |
| A549 | ECACC | #86012804 | Lung carcinoma cell line |
| Agilent Seahorse XF RPMI Medium, pH 7.4 | Agilent Technologies Inc. | 103576-100 | XF assay medium with 1 mM HEPES, without phenol red, sodium bicarbonate, glucose, L-glutamine, and sodium pyruvate |
| Agilent Seahorse XFe96 Extracellular Flux Analyzer | Agilent Technologies Inc. | - | Instrument for measuring rates of spheroid oxygen uptake in single spheroids |
| Antimycin A | Merck Life Science | A8674 | Mitochondrial respiratory complex III inhibitor |
| BAM15 | TOCRIS bio-techne | 5737 | Mitochondrial protnophore uncoupler |
| Black-walled microplate | Greiner Bio-One | 655076 | For fluorescence-based assays |
| CELLSTAR cell-repellent surface 96 U well microplates | Greiner Bio-One | 650970 | Microplates for generating spheroids |
| CellTiter-Glo 3D Cell Viability Assay | Promega | G9681 | Assay for the determination of cell viability in 3D microtissue spheroids |
| Cultrex Poly-D-Lysine | R&D Systems a biotechne brand | 3439-100-01 | Molecular cell adhesive for coating XFe96 spheroid microplates to facillitate attachment of spheroids |
| D-(+)-Glucose | Merck Life Sciences | G8270 | Supplement for cell culture growth and XF assay medium |
| Dulbecco’s Modified Eagle Medium (DMEM) | Gibco | 11885084 | Culture medium for HepG2/C3A spheroids |
| EVOS XL Core Imaging System | Thermo Fisher Scientific | AMEX1000 | Phase-contrast imaging microscope |
| EZ-PCR Mycoplasma test kit | Biological Industries | 20-700-20 | Mycoplasma screening in cell cultures |
| FIJI Is Just Image J | Analysis of collated images | ||
| Foetal bovine serum | Merck Life Science | F7524 | Supplement for cell culture medium |
| HepG2/C3A | ATCC | #CRL-10741 | Hepatic carcinoma cell line, a clonal derivative of the parent HepG2 cell line |
| Lactate-Glo | Promega | J5021 | Assay for measurement of lactate within spheorid culture medium |
| L-glutamine (200 mM solution) | Merk Life Sciences | G7513 | Supplement for cell culture growth and XF assay medium |
| M50 Stereo microscope | Leica Microsytems | LEICAM50 | Stereo dissection micrscope; used for spheorid handling |
| MCF-7 | ECACC | #86012803 | Breast adenocarcinoma cell line |
| Oligomycin from Streptomyces diastatochromogenes | Merck Life Science | O4876 | ATP Synthase Inhibitor |
| Penicilin-Streptomycin | Gibco | 15140122 | Antibiotics added to cell culture medium |
| Quant-iT PicoGreen dsDNA Assay Kit | Initrogen | P7589 | Analysis of dsDNA in spehroids |
| Rotenone | Merck Life Science | R8875 | Mitochondrial Respiratory Complex I Inhibitor |
| RPMI 1640 | Gibco | 21875091 | Culture medium for A549, MCF7, and SK-OV-3 spheroids |
| Seahorse Analytics | Agilent Technologies Inc. | Build 421 | https://seahorseanalytics.agilent.com |
| Seahorse XFe96 Spheroid FluxPak | Agilent Technologies Inc. | 102905-100 | Each Seahorse XFe96 Spheroid FluxPak contains: 6 Seahorse XFe96 Spheroid Microplates (102978-100), 6 XFe96 sensor cartridges, and 1 bottle of Seahorse XF Calibrant Solution 500 mL (100840-000) |
| Serological pipette: 5, 10, and 25 mL | Greiner Bio-One | 606107; 607107; 760107 | Consumables for cell culture |
| SK-OV-3 | ECACC | #HTB-77 | Ovarian adenocarcinoma cell line |
| Sodium pyruvate (100 mM solution) | Merck Life Science | S8636 | Supplement for cell culture growth and XF assay medium |
| T75 cm2 cell culture flask | Greiner Bio-One | 658175 | Tissue culture treated flasks for maintaining cell cultures |
| TrypLExpress | Gibco | 12604-021 | Cell dissociation reagent |
| Wave controller software | Agilent Technologies Inc. | - | |
| Wide orifice tip | STARLAB International GmbH | E1011-8400 | Pipette tips with wide opening for spheroid handling |
参考文献
- Correa de Sampaio, P., et al. A heterogeneous in vitro three dimensional model of tumour-stroma interactions regulating sprouting angiogenesis. PLoS One. 7 (2), 30753(2012).
- Amann, A., et al. Development of an innovative 3D cell culture system to study tumour-stroma interactions in non-small cell lung cancer cells. PLoS One. 9 (3), 92511(2014).
- Russell, S., Wojtkowiak, J., Neilson, A., Gillies, R. J. Metabolic profiling of healthy and cancerous tissues in 2D and 3D. Scientific Reports. 7 (1), 15285(2017).
- Zanoni, M., et al. 3D tumor spheroid models for in vitro therapeutic screening: a systematic approach to enhance the biological relevance of data obtained. Scientific Reports. 6, 19103(2016).
- Song, Y., et al. Patient-derived multicellular tumor spheroids towards optimized treatment for patients with hepatocellular carcinoma. Journal of Experimental and Clinica Cancer Research. 37 (1), 109(2018).
- Courau, T., et al. Cocultures of human colorectal tumor spheroids with immune cells reveal the therapeutic potential of MICA/B and NKG2A targeting for cancer treatment. Journal for ImmunoTherapy of Cancer. 7 (1), 74(2019).
- Ivanova, E., et al. Use of ex vivo patient-derived tumor organotypic spheroids to identify combination therapies for HER2 mutant non-small cell lung cancer. Clinical Cancer Research. 26 (10), 2393-2403 (2020).
- Mandon, M., Huet, S., Dubreil, E., Fessard, V., Le Hegarat, L. Three-dimensional HepaRG spheroids as a liver model to study human genotoxicity in vitro with the single cell gel electrophoresis assay. Scientific Reports. 9 (1), 10548(2019).
- Stampar, M., et al. Hepatocellular carcinoma (HepG2/C3A) cell-based 3D model for genotoxicity testing of chemicals. Science of the Total Environment. 755, 143255(2020).
- Coltman, N. J., et al. Application of HepG2/C3A liver spheroids as a model system for genotoxicity studies. Toxicology Letters. 345, 34-45 (2021).
- Tchoryk, A., et al. Penetration and uptake of nanoparticles in 3D tumor spheroids. Bioconjugate Chemistry. 30 (5), 1371-1384 (2019).
- Leite, P. E. C., et al. Suitability of 3D human brain spheroid models to distinguish toxic effects of gold and poly-lactic acid nanoparticles to assess biocompatibility for brain drug delivery. Partical Fibre Toxicology. 16 (1), 22(2019).
- Elje, E., et al. Hepato(Geno)toxicity assessment of nanoparticles in a HepG2 liver spheroid model. Nanomaterials. 10 (3), 545(2020).
- Conway, G. E., et al. Adaptation of the in vitro micronucleus assay for genotoxicity testing using 3D liver models supporting longer-term exposure durations. Mutagenesis. 35 (4), 319-330 (2020).
- Wang, Z., et al. HepaRG culture in tethered spheroids as an in vitro three-dimensional model for drug safety screening. Journal of Applied Toxicology. 35 (8), 909-917 (2015).
- Proctor, W. R., et al. Utility of spherical human liver microtissues for prediction of clinical drug-induced liver injury. Archives of Toxicology. 91 (8), 2849-2863 (2017).
- Basharat, A., Rollison, H. E., Williams, D. P., Ivanov, D. P. HepG2 (C3A) spheroids show higher sensitivity compared to HepaRG spheroids for drug-induced liver injury (DILI). Toxicology and Applied Pharmacology. 408, 115279(2020).
- Benning, L., Peintner, A., Finkenzeller, G., Peintner, L. Automated spheroid generation, drug application and efficacy screening using a deep learning classification: a feasibility study. Scientific Reports. 10 (1), 11071(2020).
- Mittler, F., et al. High-content monitoring of drug effects in a 3D spheroid model. Frontiers in Oncology. 7, 293(2017).
- Brand, M. D., Nicholls, D. G. Assessing mitochondrial dysfunction in cells. The Biochemical Journal. 435 (2), 297-312 (2011).
- Benz, R., McLaughlin, S. The molecular mechanism of action of the proton ionophore FCCP (carbonylcyanide p-trifluoromethoxyphenylhydrazone). Biophysical Journal. 41 (3), 381-398 (1983).
- Kasianowicz, J., Benz, R., McLaughlin, S. The kinetic mechanism by which CCCP (carbonyl cyanide m-chlorophenylhydrazone) transports protons across membranes. The Journal of Membrane Biology. 82 (2), 179-190 (1984).
- Kenwood, B. M., et al. Identification of a novel mitochondrial uncoupler that does not depolarize the plasma membrane. Molecular Metabolism. 3 (2), 114-123 (2013).
- Mitchell, P. Coupling of phosphorylation to electron and hydrogen transfer by a chemi-osmotic type of mechanism. Nature. 191, 144-148 (1961).
- Alexopoulos, S. J., et al. Mitochondrial uncoupler BAM15 reverses diet-induced obesity and insulin resistance in mice. Nature Communications. 11 (1), 2397(2020).
- Chen, S. -Y., et al. Mitochondrial uncoupler SHC517 reverses obesity in mice without affecting food intake. Metabolism - Clinical and Experimental. 117, 154724(2021).
- Goedeke, L., Shulman, G. I. Therapeutic potential of mitochondrial uncouplers for the treatment of metabolic associated fatty liver disease and NASH. Molecular Metabolism. 46, 101178(2021).
- Hill, B. G., et al. Integration of cellular bioenergetics with mitochondrial quality control and autophagy. Biological chemistry. 393 (12), 1485-1512 (2012).
- Demine, S., Renard, P., Arnould, T. Mitochondrial uncoupling: a key controller of biological processes in physiology and diseases. Cells. 8 (8), 795(2019).
- Wang, J., et al. Uncoupling effect of F16 is responsible for its mitochondrial toxicity and anticancer activity. Toxicological Sciences. 161 (2), 431-442 (2018).
- Tretter, L., Chinopoulos, C., Adam-Vizi, V. Plasma membrane depolarization and disturbed Na+ homeostasis induced by the protonophore carbonyl cyanide-p-trifluoromethoxyphenyl-hydrazon in isolated nerve terminals. Molecular Pharmacology. 53 (4), 734-741 (1998).
- Connop, B. P., Thies, R. L., Beyreuther, K., Ida, N., Reiner, P. B. Novel effects of FCCP [carbonyl cyanide p-(trifluoromethoxy) phenylhydrazone] on amyloid precursor protein processing. Journal of neurochemistry. 72 (4), 1457-1465 (1999).
- Stöckl, P., et al. Partial uncoupling of oxidative phosphorylation induces premature senescence in human fibroblasts and yeast mother cells. Free Radical Biology and Medicine. 43 (6), 947-958 (2007).
- Firsov, A. M., et al. Protonophoric action of BAM15 on planar bilayers, liposomes, mitochondria, bacteria and neurons. Bioelectrochemistry. 137, 107673(2021).
- Dranka, B. P., Hill, B. G., Darley-Usmar, V. M. Mitochondrial reserve capacity in endothelial cells: The impact of nitric oxide and reactive oxygen species. Free Radical Biology and Medicine. 48 (7), 905-914 (2010).
- Eilenberger, C., Rothbauer, M., Ehmoser, E. K., Ertl, P., Kupcu, S. Effect of spheroidal age on sorafenib diffusivity and toxicity in a 3D HepG2 spheroid model. Scientific Reports. 9 (1), 4863(2019).
- vanden Brand, D., Veelken, C., Massuger, L., Brock, R. Penetration in 3D tumor spheroids and explants: Adding a further dimension to the structure-activity relationship of cell-penetrating peptides. Biochimica et Biophysica Acta (BBA) - Biomembranes. 1860 (6), 1342-1349 (2018).
- Niora, M., et al. Head-to-head comparison of the penetration efficiency of lipid-based nanoparticles into tumor spheroids. ACS Omega. 5 (33), 21162-21171 (2020).
- Millard, M., et al. Drug delivery to solid tumors: the predictive value of the multicellular tumor spheroid model for nanomedicine screening. International Journal of Nanomedicine. 12, 7993-8007 (2017).
- Ruas, J. S., et al. Underestimation of the maximal capacity of the mitochondrial electron transport system in oligomycin-treated cells. PLoS One. 11 (3), 0150967(2016).
- Benton, G., DeGray, G., Kleinman, H. K., George, J., Arnaoutova, I. In vitro microtumors provide a physiologically predictive tool for breast cancer therapeutic screening. PLoS One. 10 (4), 0123312(2015).
- Hirpara, J., et al. Metabolic reprogramming of oncogene-addicted cancer cells to OXPHOS as a mechanism of drug resistance. Redox Biology. 25, 101076(2019).
- Ware, M. J., et al. Generation of homogenous three-dimensional pancreatic cancer cell spheroids using an improved hanging drop technique. Tissue Engineering. Part C, Methods. 22 (4), 312-321 (2016).
- Song, Y., et al. TGF-β-independent CTGF induction regulates cell adhesion mediated drug resistance by increasing collagen I in HCC. Oncotarget. 8 (13), 21650-21662 (2017).
- Wrzesinski, K., et al. HepG2/C3A 3D spheroids exhibit stable physiological functionality for at least 24 days after recovering from trypsinisation. Toxicology Research. 2 (3), 163-172 (2013).
- Gaskell, H., et al. Characterization of a functional C3A liver spheroid model. Toxicology Research. 5 (4), 1053-1065 (2016).
- Takahashi, Y., et al. 3D spheroid cultures improve the metabolic gene expression profiles of HepaRG cells. Bioscience Reports. 35 (3), 00208(2015).
- Hendriks, D. F. G., Puigvert, L. F., Messner, S., Mortiz, W., Ingelman-Sundberg, M. Hepatic 3D spheroid models for the detection and study of compounds with cholestatic liability. Scientific Reports. 6, 35434(2016).
- Leung, B. M., Lesher-Perez, S. C., Matsuoka, T., Moraes, C., Takayama, S. Media additives to promote spheroid circularity and compactness in hanging drop platform. Biomaterials Science. 3 (2), 336-344 (2015).
- Cavo, M., et al. A synergic approach to enhance long-term culture and manipulation of MiaPaCa-2 pancreatic cancer spheroids. Scientific Reports. 10 (1), 10192(2020).
- Carlsson, J., Yuhas, J. M. Liquid-overlay culture of cellular spheroids. Recent Results in Cancer Research. 95, 1-23 (1984).
- Costa, E. C., Gaspar, V. M., Coutinho, P., Correia, I. J. Optimization of liquid overlay technique to formulate heterogenic 3D co-cultures models. Biotechnology and Bioengineering. 111 (8), 1672-1685 (2014).
- Lundholt, B. K., Scudder, K. M., Pagliaro, L. A simple technique for reducing edge effect in cell-based assays. Journal of Biomolecular Screening. 8 (5), 566-570 (2003).
- Zhang, X. D., et al. The use of strictly standardized mean difference for hit selection in primary RNA interference high-throughput screening experiments. Journal of Biomolecular Screening. 12 (4), 497-509 (2007).
- Yepez, V. A., et al. OCR-Stats: Robust estimation and statistical testing of mitochondrial respiration activities using Seahorse XF Analyzer. PLoS One. 13 (7), 0199938(2018).
- Silva, L. P., et al. Measurement of DNA concentration as a normalization strategy for metabolomic data from adherent cell lines. Analytical Chemistry. 85 (20), 9536-9542 (2013).
Access restricted. Please log in or start a trial to view this content.
Erratum
Formal Correction: Erratum: Exploring Mitochondrial Energy Metabolism of Single 3D Microtissue Spheroids using Extracellular Flux Analysis
Posted by JoVE Editors on 3/11/2022. Citeable Link.
An erratum was issued for: Exploring Mitochondrial Energy Metabolism of Single 3D Microtissue Spheroids using Extracellular Flux Analysis. The Representative Results section was updated.
Figure 5 was updated from:
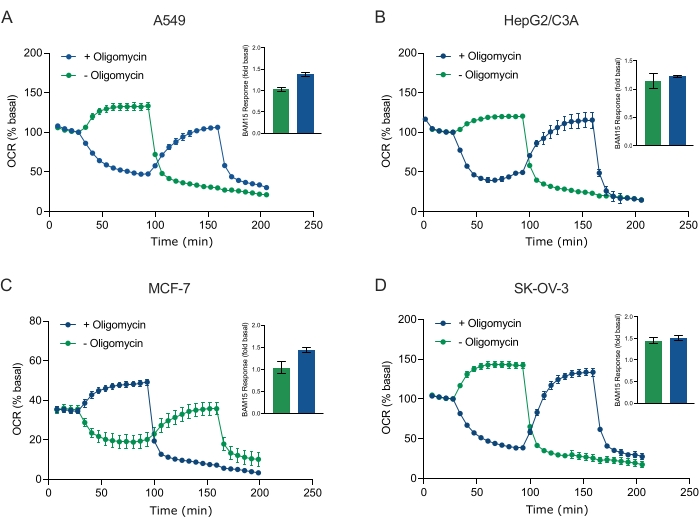
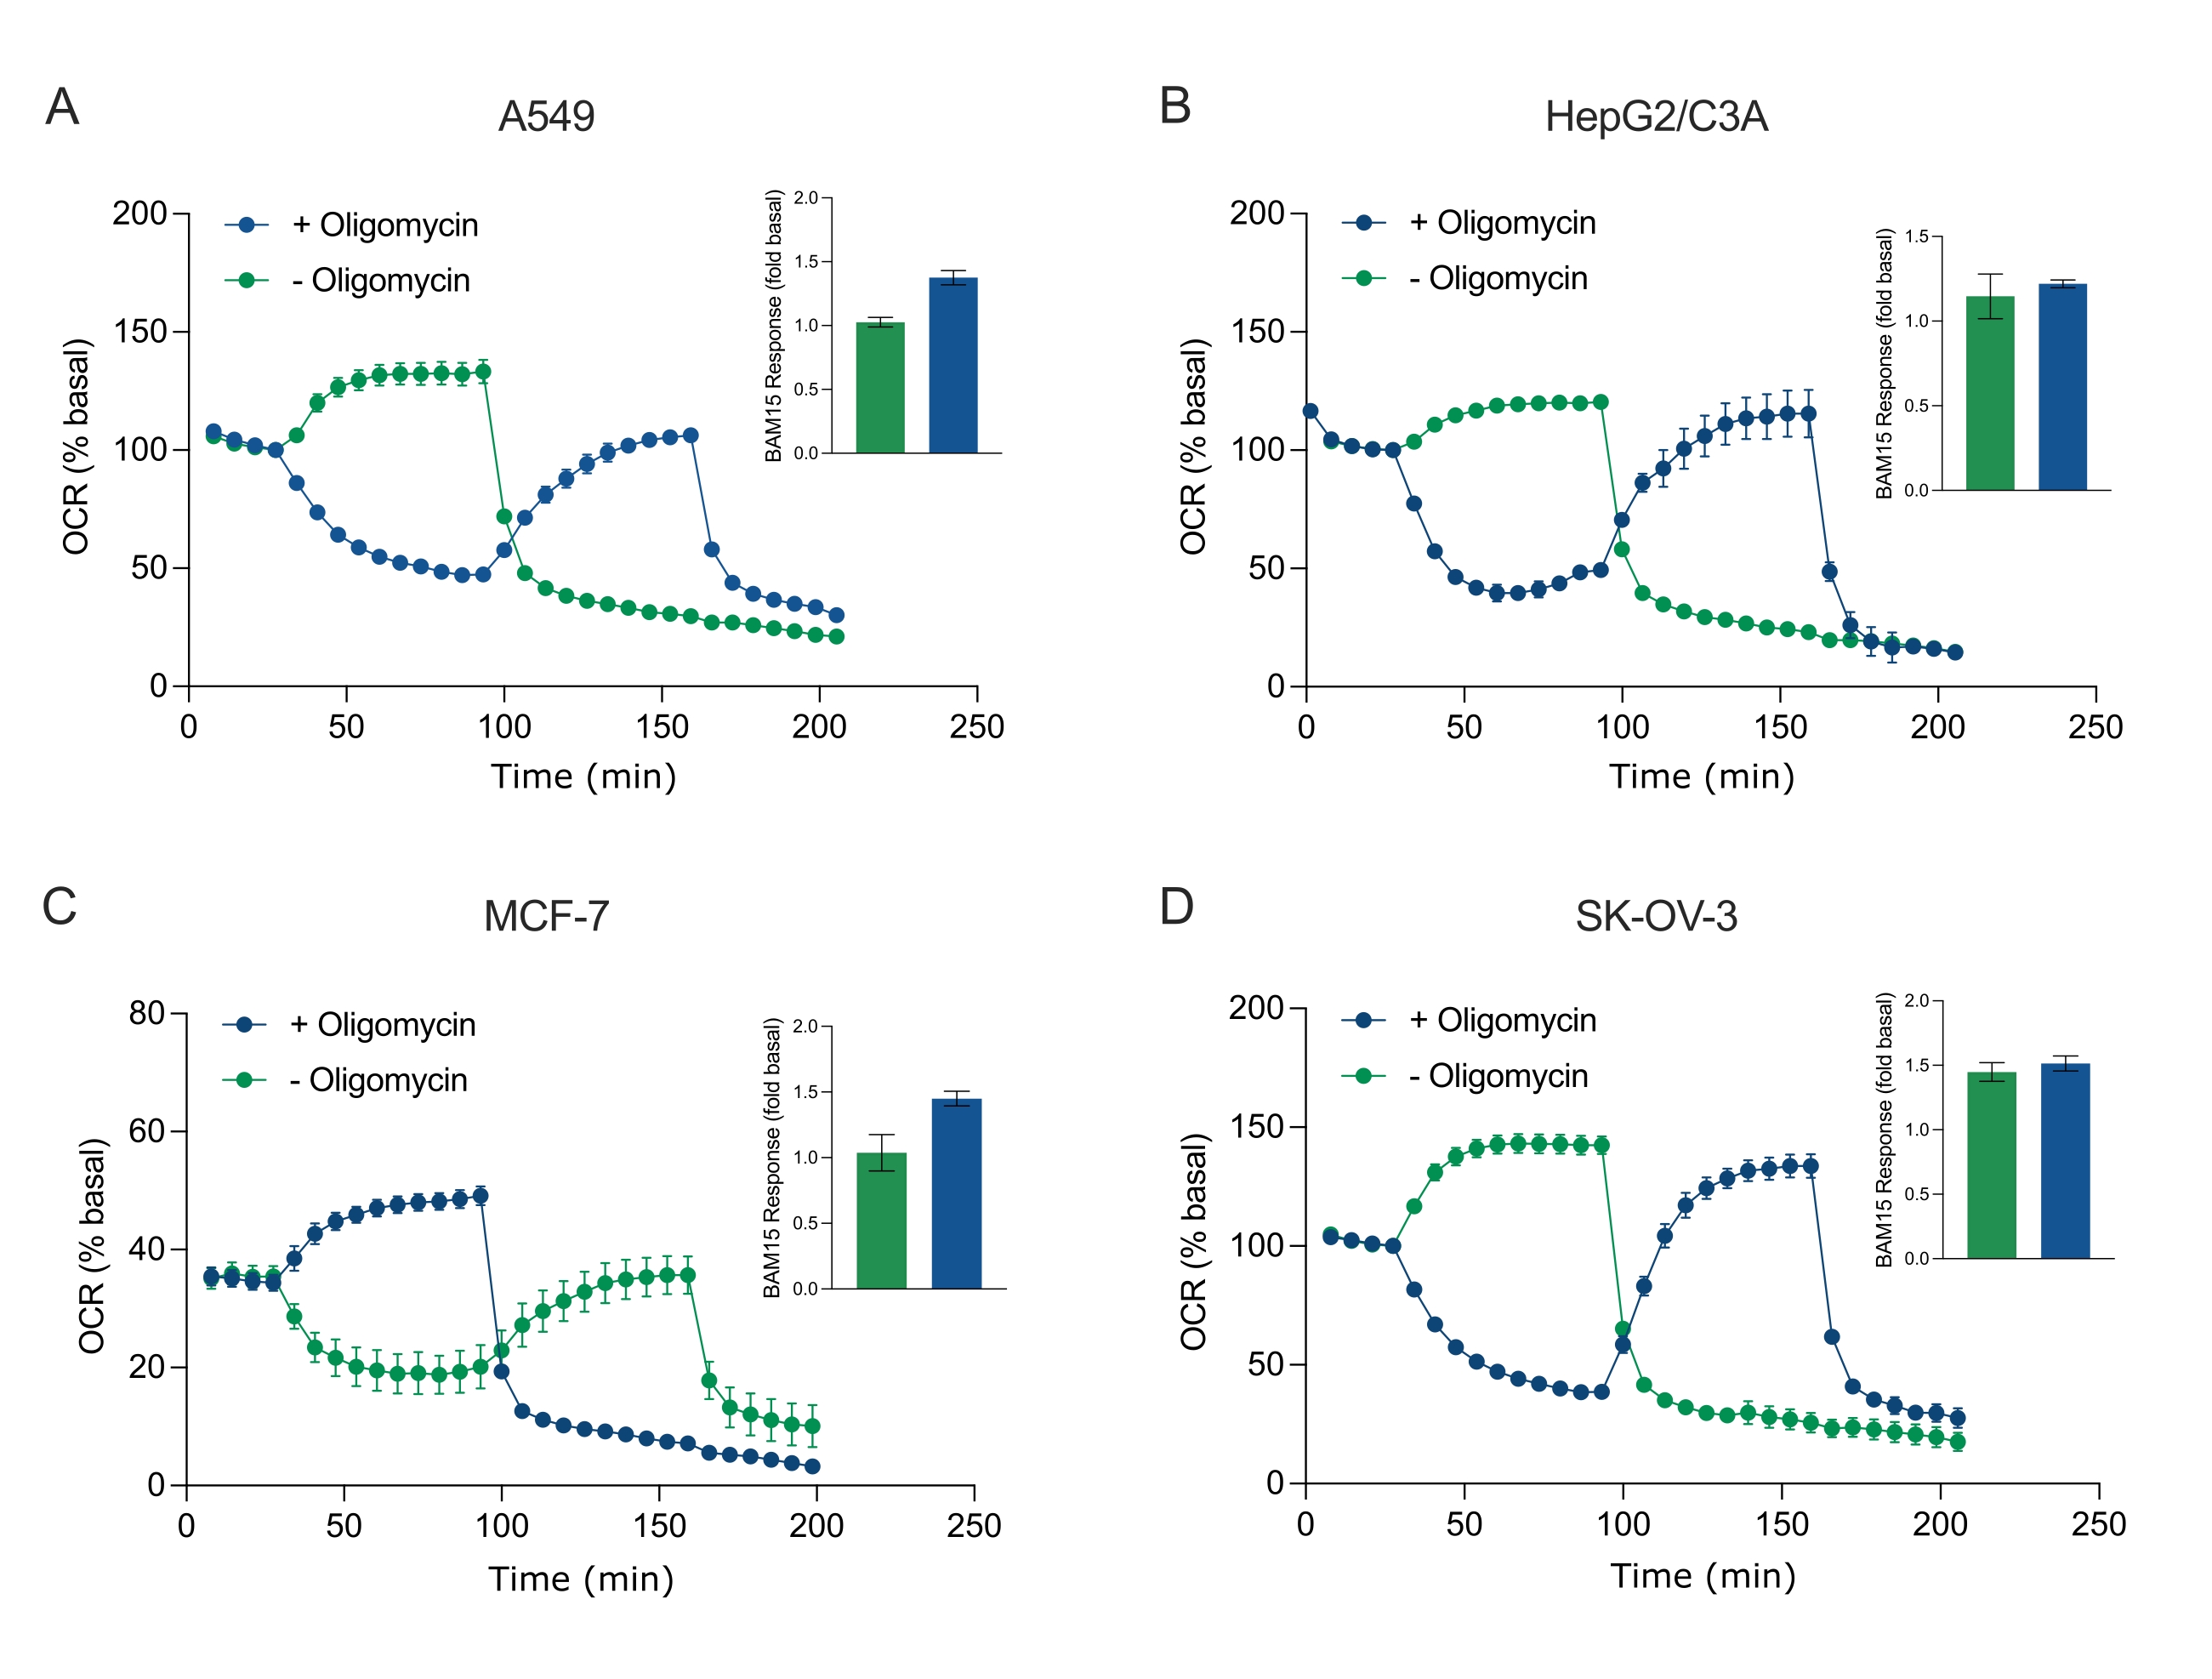
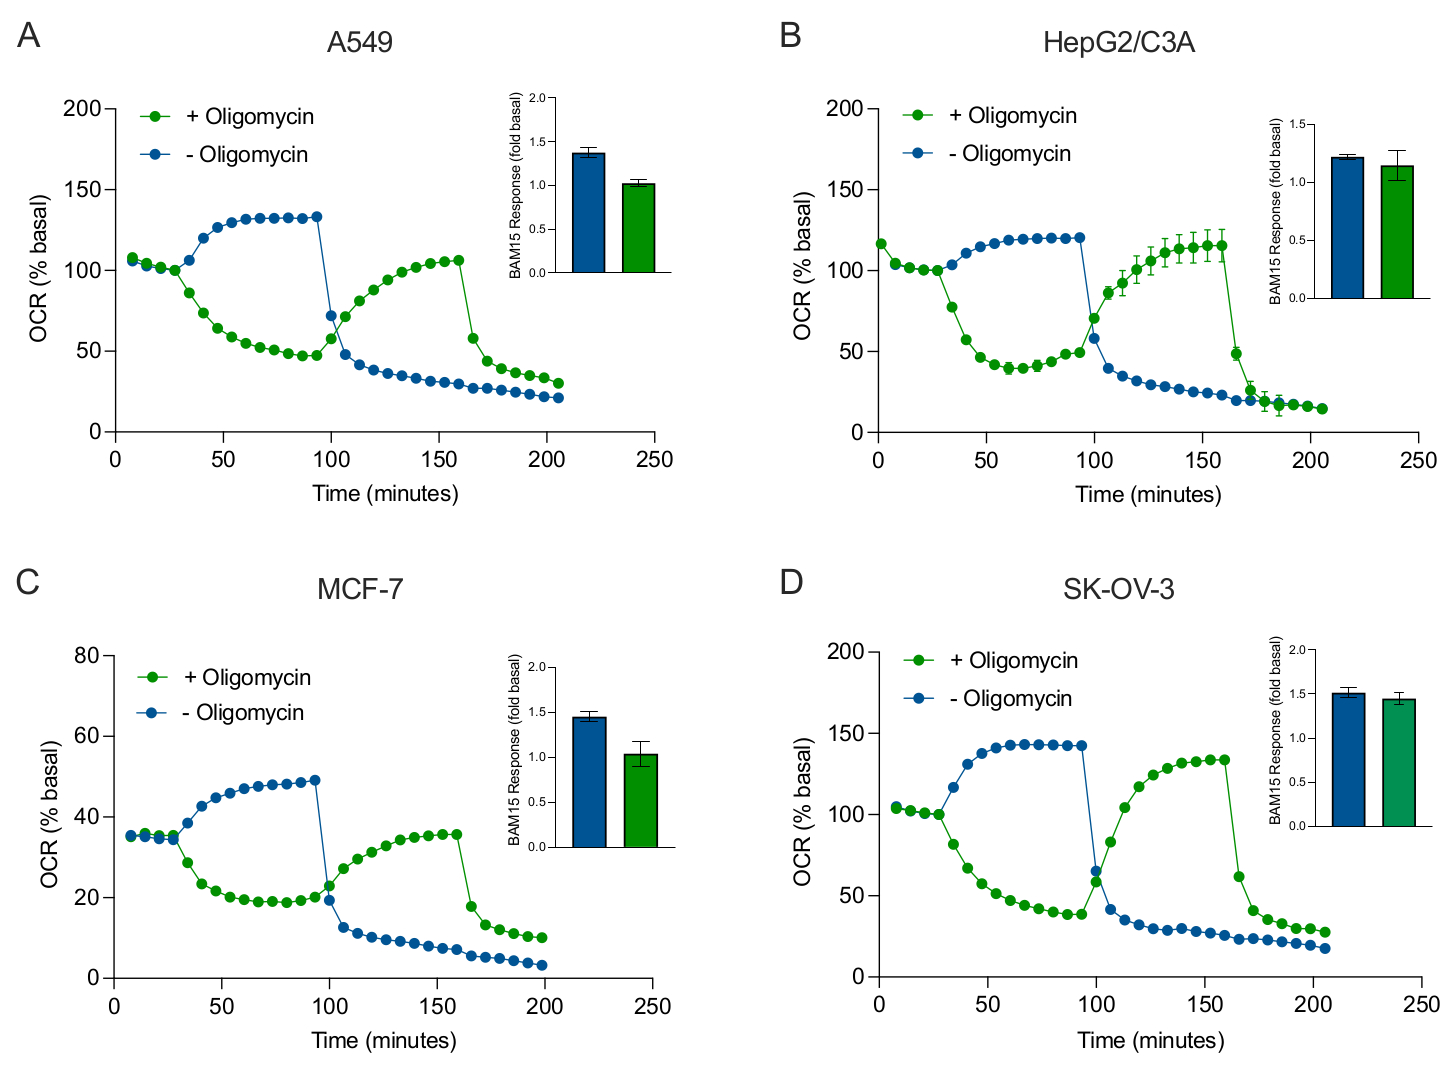
Figure 5: Single or sequential injection of mitochondrial respiratory compounds. Cancer-cell-derived spheroids of MCF-7, HEPG2/C3A, SK-OV-3, and A549 were placed into wells of an XFe96 spheroid microplate in XF RPMI and probed for OCR using the Agilent Seahorse XFe96 analyzer. OCR was measured 5x, after which 2 µg/mL oligomycin (injection Port A: green trace) or 5 µM BAM15 (injection Port A: blue trace or injection port B: green trace) to inhibit the mitochondrial ATP synthase and determine maximal respiratory capacity, respectively. Kinetic OCR data are expressed as % basal (A-D). Maximal respiratory capacity (OCRmax) was calculated as a factor of basal OCR by the equation: OCRmax = OCRBAM15 / OCRbasal. OCRmax was obtained from OCR averages across measurement cycles 8-10 post BAM15 injection with (green bars) and without (blue bars) oligomycin. Data are averages ± SEM from 3-8 individual well replicates across the spheroid assay microplate. Abbreviations: OCR = oxygen consumption rate. Please click here to view a larger version of this figure.
to:
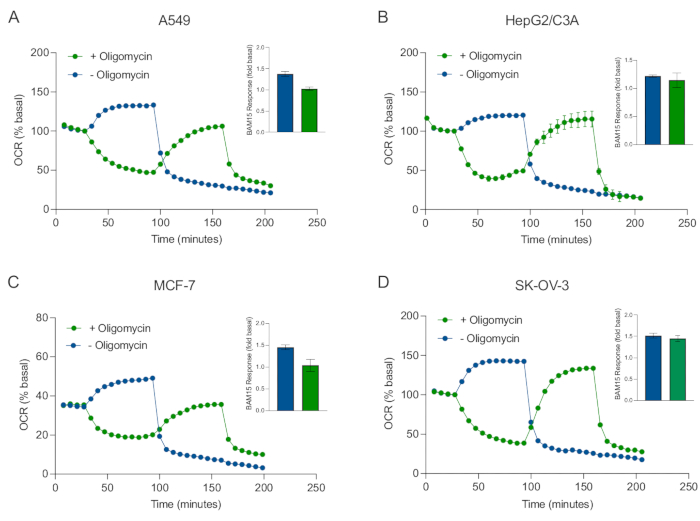
Figure 5: Single or sequential injection of mitochondrial respiratory compounds. Cancer-cell-derived spheroids of MCF-7, HEPG2/C3A, SK-OV-3, and A549 were placed into wells of an XFe96 spheroid microplate in XF RPMI and probed for OCR using the Agilent Seahorse XFe96 analyzer. OCR was measured 5x, after which 2 µg/mL oligomycin (injection Port A: green trace) or 5 µM BAM15 (injection Port A: blue trace or injection port B: green trace) to inhibit the mitochondrial ATP synthase and determine maximal respiratory capacity, respectively. Kinetic OCR data are expressed as % basal (A-D). Maximal respiratory capacity (OCRmax) was calculated as a factor of basal OCR by the equation: OCRmax = OCRBAM15 / OCRbasal. OCRmax was obtained from OCR averages across measurement cycles 8-10 post BAM15 injection with (green bars) and without (blue bars) oligomycin. Data are averages ± SEM from 3-8 individual well replicates across the spheroid assay microplate. Abbreviations: OCR = oxygen consumption rate. Please click here to view a larger version of this figure.
转载和许可
请求许可使用此 JoVE 文章的文本或图形
请求许可探索更多文章
This article has been published
Video Coming Soon
版权所属 © 2025 MyJoVE 公司版权所有,本公司不涉及任何医疗业务和医疗服务。