Method Article
종양 미세 환경의 임상 및 생물학적 평가를 위한 공간 이미지 분석과 결합된 Multiplex Immunofluorescence
요약
이 기사에서는 이미지 분석 및 공간 분석과 결합된 수동 티라마이드 신호 증폭(TSA) 다중 면역형광(mIF)을 위한 프로토콜에 대해 설명합니다. 이 프로토콜은 실험실에서 사용할 수 있는 슬라이드 스캐너에 따라 슬라이드당 2-6개의 항원을 염색하기 위해 포르말린 고정 파라핀 포매(FFPE) 섹션과 함께 사용할 수 있습니다.
초록
종양 미세환경(TME)은 세포독성 면역 세포 및 면역 조절 세포와 같은 다양한 세포 유형으로 구성됩니다. TME의 구성과 암세포와 종양주위 세포 사이의 상호 작용에 따라 TME는 암 진행에 영향을 미칠 수 있습니다. 종양과 복잡한 미세 환경의 특성화는 암 질환에 대한 이해를 향상시킬 수 있으며 과학자와 임상의가 새로운 바이오마커를 발견하는 데 도움이 될 수 있습니다.
우리는 최근 결장직장암, 두경부 편평 세포 암종, 흑색종 및 폐암에서 TME의 특성화를 위해 티라마이드 신호 증폭(TSA)을 기반으로 하는 여러 다중 면역형광(mIF) 패널을 개발했습니다. 해당 패널의 염색 및 스캔이 완료되면 이미지 분석 소프트웨어에서 샘플을 분석합니다. 그런 다음 각 세포의 공간적 위치와 염색을 이 정량화 소프트웨어에서 R로 내보냅니다. 우리는 여러 종양 구획(예: 종양의 중심, 종양의 가장자리 및 간질)에서 각 세포 유형의 밀도를 분석할 수 있을 뿐만 아니라 서로 다른 세포 유형 간의 거리 기반 분석을 수행할 수 있는 R 스크립트를 개발했습니다.
이 특정 워크플로우는 여러 마커에 대해 이미 일상적으로 수행되는 고전적인 밀도 분석에 공간적 차원을 추가합니다. mIF 분석을 통해 과학자들은 암세포와 TME 간의 복잡한 상호 작용을 더 잘 이해하고 면역 체크포인트 억제제 및 표적 요법과 같은 치료에 대한 반응의 새로운 예측 바이오마커를 발견할 수 있습니다.
서문
표적 치료법 및 면역 관문 억제제의 개발로 암세포와 종양 미세 환경 간의 상호 작용을 더 잘 특성화하는 것이 가장 중요해졌으며 이는 현재 중개 연구의 중요한 분야입니다. TME는 암세포를 표적으로 하는 면역 세포독성 세포와 종양 성장과 침습성을 촉진할 수 있는 면역 조절 세포의 균형을 이루는 다양한 세포 유형으로 구성되어 있습니다 1,2,3,4. 이 복잡한 환경의 특성화는 암 질환에 대한 이해를 향상시킬 수 있으며 과학자와 임상의가 향후 치료를 위해 환자를 더 잘 선택하기 위해 새로운 예측 및 예후 바이오마커를 발견하는 데 도움이 될 수 있습니다 5,6. 예를 들어, Galon과 그의 팀은 예측 바이오마커로 사용할 수 있는 재현 가능한 점수 방법인 Immunoscore를 개발했습니다. 면역 점수는 침습성 마진과 종양 중심 7,8에 있는 CD3+ 및 CD8+ T 세포의 밀도를 사용하여 계산됩니다.
지난 수십 년 동안 mIF에 대한 상용 솔루션이 개발되었지만 종종 비용이 많이 들고 특정 항원 패널을 위해 설계되었습니다. 학술 및 중개 연구에서 특정 항원 패널의 필요성을 극복하기 위해 우리는 FFPE 종양 절편에서 mIF를 수행하는 비용 효율적인 방법을 개발하여 인간 및 마우스 샘플에서 세포핵에 추가된 2-6개의 항원을 염색할 수 있습니다.
형광 슬라이드 스캐너로 전체 조직 절편을 염색하고 스캔하면 대형 피라미드 데이터 세트를 지원하는 여러 이미지 분석 소프트웨어로 샘플을 분석할 수 있습니다. 마지막으로, 원시 데이터는 밀도 및 공간 기반 분석을 수행하기 위해 R 소프트웨어 (v.4.0.2)와 같은 통계 컴퓨팅 및 그래픽 환경에서 사용할 수 있습니다.
5-마커 염색에 최적화된 프로토콜과 새로운 패널을 최적화하기 위한 요령 및 팁이 이 원고에 나와 있습니다. 또한 이미지 분석의 세부 단계와 통계 및 공간 분석에 사용되는 R 기능에 대해 설명합니다.
프로토콜
현재 프로토콜에 사용된 모든 샘플은 지역 윤리 위원회의 승인을 받고 관할 당국의 승인을 받은 연구에서 나왔습니다. 연구에 참여한 모든 참가자는 서면 동의서를 제공했습니다. 평가판은 ClinicalTrials.gov(NCT03608046)에 등록됩니다.
1. 멀티플렉스 면역형광
- FFPE 절편
- 조직을 4% 파라포름알데히드로 고정하고 고정 조직을 파라핀에 묻습니다.
- 5μm 섹션을 절단하여 접착 현미경 슬라이드에 놓습니다.
- 슬라이드를 실온(RT)에서 밤새 건조시킵니다.
- 탈파라핀화 및 내인성 과산화효소 억제
- 슬라이드를 톨루엔(각각 5분 동안 3회)과 메탄올(5분 동안 각각 3회)에 담가 조직을 흄 후드 아래에 담가 조직을 탈랍합니다.
- 슬라이드를 흄 후드 아래에서 20분 동안 메탄올에 희석된 3% 과산화수소에 담가 내인성 과산화효소를 억제합니다.
- 슬라이드를 증류된 (d)H2O(3분 동안 1x)로 헹굽니다.
- Multiplex immunofluorescence staining (멀티플렉스 면역형광 염색)
- 0.1% TritonX-100이 첨가된 10mM 구연산염(pH 6) 또는 EDTA(pH 9) 완충액이 들어 있는 300mL 염색 용기에 슬라이드를 담급니다.
참고: 사용된 완충액(pH 6 또는 pH 9)은 염색된 항원에 따라 다릅니다( 표 1 참조). - 완충액이 끓기 시작할 때까지 뚜껑을 닫은 염색 용기를 전자레인지에 최대 전력(예: 900W)으로 3-5분 동안 둡니다.
알림: 최적의 끓는 시간은 전자레인지와 버퍼의 부피에 따라 다릅니다. 완벽한 타이밍을 찾기 위해 조정이 필요할 수 있습니다. 일부 깨지기 쉬운 항원 또는 깨지기 쉽고 접착력이 낮은 표본(예: 오가노이드 및 스페로이드)의 경우 전자레인지 끓임이 너무 가혹할 수 있습니다. 이 경우 압력솥을 대신 사용할 수 있습니다. - 밀폐된 염색 용기를 전자레인지에 넣고 저전력(예: 90W)으로 15분 동안 버퍼를 거의 끓는 온도로 유지합니다.
- 전자레인지를 90초 동안 최대 전력으로 설정하여 가열의 마지막 단계를 수행합니다.
- 전자레인지에서 항아리를 꺼내고 버퍼를 RT에서 15분 동안 식힙니다.
- 슬라이드를dH2O중에서 각각 5분 동안 3x 헹구고, 0.1% 트윈 20 (TBS-T)을 함유하는 트리스-완충 식염수에서 5분 동안 1x 헹굽니다.
- 종이 타월로 슬라이드를 닦아 TBS-T를 제거합니다.
- 슬라이드(평평한)를 염색 챔버 트레이 또는 현미경 슬라이드 상자에 놓습니다( 재료 표 참조).
- 소수성 펜으로 조직을 둘러 쌉니다.
- TBS-T에 용해된 5% 소혈청알부민(BSA)으로 조직을 30분 동안 덮어 비특이적 결합 부위를 차단합니다.
- 종이 타월에 슬라이드를 닦아 차단 버퍼를 제거합니다.
알림: 차단 단계 후에 슬라이드를 헹구지 마십시오. - 약 300μL의 용액으로 조직을 덮음으로써 1% BSA TBS-T에 희석된 1차 항체( 표 1 참조)와 함께 60분 동안 조직을 배양합니다.
- TBS-T로 슬라이드를 각각 3분 동안 3번 헹굽니다.
- 약 300 μL의 용액으로 조직을 덮음으로써 poly-HRP 2차 항체( 표 1 참조)로 40분 동안 조직을 인큐베이션합니다.
- TBS-T로 슬라이드를 3분 동안 3번 헹굽니다.
- 0.003%H2O2로 즉석에서 보충된 붕산염 완충액(0.1 M borate, pH 7.8, 3 M NaCl)에 200배 희석된 형광색소 티라미드 시약(표 1 참조)으로 조직을 약 300 μL의 용액으로 덮음으로써 조직을 10분 동안 인큐베이션한다.
- TBS-T로 슬라이드를 3분 동안 3번 헹굽니다.
- 모든 TSA 염색이 수행될 때까지 1.3.1-1.3.16 단계를 반복합니다.
- 조직을 1% BSA TBS-T에 희석된 마지막 1차 항체( 표 1 참조)와 함께 4°C에서 밤새 인큐베이션한다.
참고: 배양은 하룻밤 사이에 이루어지기 때문에 염색 챔버 트레이 또는 현미경 슬라이드 상자를 덮고 상자 바닥(슬라이드 아래)의 종이 타월에 dH2O를 추가하여 배양 중에 조직이 건조하지 않도록 하는 것이 중요합니다. - TBS-T로 각각 5분 동안 티슈를 3번 헹굽니다.
- 1% BSA TBS-T에서 200배 희석된 2차 항체(형광색소와 직접 결합)로 120분 동안 조직을 배양합니다.
- TBS-T로 각각 5분 동안 티슈를 3번 헹굽니다.
- 조직을 10% BSA TBS-T에 1,000배 희석한 비스벤지미드(20mM)에서 5분 동안 배양하여 핵을 염색합니다.
알림: 비스벤지미드는 DAPI로 대체할 수 있지만 후자는 더 독성이 강하므로 흄 후드 아래에서 조심스럽게 다루어야 합니다. - 티슈를dH2O에서 각각 3분 동안 3회 헹굽니다.
- 형광 장착 매체와 붕규산 커버 유리를 사용하여 슬라이드를 장착합니다.
- 0.1% TritonX-100이 첨가된 10mM 구연산염(pH 6) 또는 EDTA(pH 9) 완충액이 들어 있는 300mL 염색 용기에 슬라이드를 담급니다.
2. 슬라이드 스캔
- 형광 슬라이드 스캐너에서 20x 배율로 슬라이드를 스캔하여 디지털화합니다(슬라이드 스캐너에 대한 자세한 내용은 재료 표에 나와 있음).
참고: 최적의 멀티플렉스의 대표적인 스캔이 그림 1에 나와 있습니다.
3. 이미지 분석
- 스캔을 이미지 분석 소프트웨어로 가져옵니다(파일 > 이미지 열기).
- 분류자 탭으로 이동하여 DenseNet AI V2 플러그인을 선택합니다.
- 하나의 이미지에서 약 500개의 핵을 둘러싸서 핵을 인식하도록 DenseNet AI V2 플러그인을 훈련시킵니다.
- 여러 슬라이드(약 10개)에서 여러 핵(50)을 둘러싸서 동일한 배치와 mIF 염색의 다른 배치에서 여러 슬라이드에 AI를 훈련합니다.
참고: AI 플러그인 사용 방법에 대한 자세한 지침은 소프트웨어 설명서에서 찾을 수 있습니다. 핵 검출에 AI를 사용하는 것은 선택 사항입니다. 핵을 검출하는 다른 방법은 사용되는 이미지 분석 소프트웨어에 따라 사용할 수 있습니다. - 학습된 AI를 저장합니다(분류자 작업 > 저장).
- 주석 탭으로 이동하고 펜 주석 도구를 사용하여 종양의 중심 및 종양의 가장자리와 같은 각 관심 영역(ROI)에 대한 주석을 만듭니다.
- 필요한 경우 제외 주석 도구를 사용하여 접힌 영역과 흐리게 나타나는 영역을 제거합니다.
참고: mIF에 사용된 섹션에 인접한 섹션의 헤마톡실린-에오신 염색은 mIF 염색 전에 수행하여 종양 세포가 표본에 존재하는지 확인하고 해부병리학자가 ROI를 결정하는 데 도움을 줄 수 있습니다. - 분석(Analysis) 탭으로 이동하여 HighPlex FL 알고리즘(HighPlex FL> 로드 > 설정 작업)을 선택합니다.
- 염료 선택 탭을 선택하고 원하는 염료를 선택합니다.
- Nuclear Detection(핵 탐지 ) 탭에서 Nuclear Segmentation Type(핵 분할 유형)으로 이동하고 AI custom(AI 사용자 지정)을 선택합니다.
- Nuclear Segmentation Classifier에서 3.5단계에서 저장한 AI를 선택합니다.
- Membrane and Cytoplasm Detection(막 및 세포질 검출) 탭에서 최대 세포질 반경(이 연구에서는 1.5가 사용됨)과 막 염료의 수를 선택했습니다.
- 각 염료에 대해 핵 양성 역치, 세포질 양성 역치 및 막 양성 역치를 선택합니다.
참고: 임계값은 각 염색마다 다르며 슬라이드의 각 배치와 염색된 각 항원에 대해 조정해야 합니다. 보기 설정 도구(보기 > 보기 설정)를 사용하면 강도 피크 끝(오른쪽)에 있는 강도 값을 사용하여 적절한 임계값을 선택하는 데 도움이 될 수 있습니다. - 각 염료에 대해 핵, 막 및 세포질 완전성 백분율 값을 선택합니다.
참고: 이 매개변수는 염색이 다른 두 세포가 서로 가까이 있을 때 위양성 검출을 방지하는 데 중요합니다(그림 2). - 알고리즘을 저장합니다(설정 작업 > 저장).
- ROI를 분석합니다(주석 레이어 분석>).
- 결과 탭으로 이동하여 개체 데이터(ctrl + A)의 모든 데이터를 선택합니다.
- 데이터를 .csv 형식으로 내보냅니다(마우스 오른쪽 버튼을 클릭하거나 > Object Data 내보내기> . Csv)입니다.
참고: 이 표에는 위치(Xmin, Xmax; Ymin, Ymax) 및 각 분석된 세포의 각 마커의 양성을 나타내었다.
4. R을 이용한 생물정보학
참고: 다음 단계에 대한 자세한 내용을 제공하는 R 스크립트는 GitHub(benidovskaya/Ring: Pipeline for the analysis of multiplex immunofluorescence stainings)에서 사용할 수 있습니다. [github.com])
- 내보낸 표를 사용하여 먼저 colocalization 염색을 기반으로 다양한 세포 유형을 정의합니다. 예를 들어, 이중 양성 CD3+/CD8+ 세포에 의한 세포독성 T 세포를 정의합니다.
- 그런 다음 이미지 분석 소프트웨어에서 내보낸 좌표와 ggplot2(그림 3). 이러한 데이터를 사용하여 다음과 같은 여러 유형의 분석을 수행할 수 있습니다.
- 밀도 분석
참고: 가장 간단한 분석은 밀도 분석입니다.- 생검을 위해 전체 슬라이드 또는 조직의 특정 영역을 사용하여 모든 세포 유형에 대한 밀도 분석을 수행합니다. 예를 들어, 종양의 중심과 종양의 가장자리에 있는 CD3+ 및 CD8+ T 세포의 밀도를 계산합니다(그림 4A-C).
- 이러한 밀도를 계산하려면 이미지 분석 소프트웨어를 사용하여 각 세포의 표현형과 좌표로 샘플당 특정 데이터 프레임을 생성합니다. R의 클러스터링 함수(k-최근접 이웃)를 통해 연구된 생검의 경계를 사용하여 다각형 객체를 만들고 그 안에 있는 관심 세포 유형의 밀도를 계산합니다.
참고: 이를 통해 생물학적 가설에 따라 다양한 조건(예: 다른 시점, 치료 유형, 조직 유형 및 치료에 대한 반응)과 국소화(종양 중심, 종양 가장자리, 간질 섬유증 및 괴사 영역) 간에 서로 다른 세포 유형의 밀도를 비교할 수 있습니다. 암세포, 종양주위 세포, 종양 침윤 세포 사이의 근접성이 높기 때문에 이미지 분석 소프트웨어는 이중 양성 세포를 면역과 암세포로 동시에 검출할 수 있습니다. 이 경우 이러한 이중 양성 세포가 무엇인지 언급하여 이 문제를 생물학적으로 수정해야 합니다. 이 경우 CD3+CD8+사이토케라틴+ 세포는 침윤 림프구를 둘러싼 종양 세포로 인해 사이토케라틴 양성이 발생했기 때문에 세포독성 세포로 태그되었습니다.
- 히트맵
- 서로 다른 패널의 각 세포 유형 밀도를 사용하고 정규화(예: 스케일링 센터링)를 적용하여 샘플 모집단의 세포 풍부도를 나타내는 히트맵(그림 5)을 그립니다.
- 세포 밀도를 기반으로 하는 계층적 비지도 클러스터링을 사용하여 유사한 TME 구성을 가진 환자를 클러스터링하고 이러한 클러스터를 치료 반응 및 생존과 같은 임상 매개변수와 연관시킵니다.
참고: 히트맵 및 클러스터화는 R ComplexHeatmap 패키지9를 사용하여 쉽게 수행할 수 있습니다.
- 공간 세포 분포
- 세포 사이의 거리를 생물정보학적으로 계산(예: 면역 및 종양 세포; 도 6A, B)는 이미지 분석에 의해 제공된 세포 좌표를 기반으로 한다. 관심 있는 세포 유형 간의 중위수 및 평균 거리를 사용하여 코호트의 모든 샘플에서 세포 근접성을 비교합니다.
- 공간 설명 함수
- R 스패스탯 패키지(10)를 통해 이용가능한 교차형 최근접 이웃 G-교차 함수를 사용하여, 관심 세포 X(예를 들어, 종양 세포)가 세포 X 주위의 특정 반경 내에서 가장 가까운 세포 Y(예를 들어, T 세포)를 만날 확률을 결정한다.
- 경험적 곡선 아래 면적을 계산하여 종양 세포 주위의 CD3+ T 세포의 종양 침윤을 나타내는 수치를 얻습니다(그림 6C). F-함수 또는 J-함수12와 같은 다른 공간 설명 함수를 사용합니다.
- 면역 점수 분석
- 종양 중앙과 종양의 침습성 가장자리에 있는 CD3+ 및 CD8+ T 세포의 밀도를 사용하여 Galon 7,8 팀이 개발한 Immunoscore(I)를 계산합니다.
참고: 점수 범위는 I0에서 I4까지입니다. 종양의 중앙과 가장자리에 있는 CD3+ 및 CD8+ T 세포의 낮은 밀도는 I0의 점수와 관련이 있는 반면, 두 영역 모두에서 CD3+ 및 CD8+ T 세포의 높은 밀도는 I4의 점수와 관련이 있습니다. 최근 면역코어의 예후 영향은 13개국 14개 센터에서 실시한 I-III기 대장암 환자 2,681명의 샘플을 대상으로 한 연구에서 검증되었다7. 그러나 계산하기 위해 Immunoscore는 종양의 중심과 가장자리를 모두 포함하는 외과적으로 절제된 표본이 필요합니다. 일반적으로 마진이 없는 생검의 경우, 생검 적응 면역점수(Immunoscore)가 최근 개발되었다13. - 생검 적응 면역 점수를 계산하려면 CD3+ 및 CD8+ T 세포 밀도 값을 백분위수로 변환한 다음 CD3+ 및 CD8+ T 세포의 평균 백분위수를 사용하여 세 가지 범주(즉, 낮음, 중간 및 높음) 중 하나로 점수를 매깁니다13.
- 종양 중앙과 종양의 침습성 가장자리에 있는 CD3+ 및 CD8+ T 세포의 밀도를 사용하여 Galon 7,8 팀이 개발한 Immunoscore(I)를 계산합니다.
- 핫스팟 분석
- quadratcount 함수(spatstat)10를 사용하여 핫스팟 분석을 사용하여 조직의 가장 침윤된 영역에서 다양한 세포 유형의 밀도를 비교합니다. 예를 들어, 조직의 가장 침윤된 사각형의 CD3 및 CD8 T 세포 밀도 값을 사용하여 "Immunoscore-like" 점수를 계산할 수 있습니다(그림 7). 조직 전체에 걸쳐 불균일한 분포를 가진 모든 세포 유형의 분석에 이 방법을 적용합니다.
- 밀도 분석
결과
이 프로토콜에 따라 조직이 올바르게 염색되었는지 확인하기 위해 몇 가지 매개변수를 조사해야 합니다. 첫째, TSA 염색은 스캐닝 과정에서 낮은 노출 시간(일반적으로 2-100ms)을 사용할 때 좋은 동적 범위를 표시해야 합니다. 노출 시간이 짧다는 것은 증폭이 HRP와 반응하는 동안 올바르게 수행되었음을 의미합니다. 형광색소와 직접 결합된 2차 항체로 염색된 항원의 경우 노출 시간이 훨씬 더 길어질 수 있으며, 이는 광표백(긴 노출 시간으로 인한 신호 강도 감소)으로 이어질 수 있습니다. 둘째, 각 염색이 높은 SNR을 나타내는지 확인하는 것이 중요합니다. 항원 신호가 낮은 높은 배경 신호는 1차 항체가 충분히 특이적이지 않거나, 내인성 과산화효소가 올바르게 비활성화되지 않았거나, 프로토콜의 한 단계가 적절하게 수행되지 않았음을 나타낼 수 있습니다. 셋째, 슬라이드 스캐너와 스캔에 사용된 필터 세트에 따라 두 가지 색상(예: AF555, AF594 및 AF647) 간의 겹침을 볼 수 있습니다. 스캐너에서 올바른 필터 세트와 올바른 1차 항체 희석을 선택하는 것은 교차 검출 가능성을 방지하는 데 매우 중요합니다. 품질 관리는 스캔된 파일의 각 마커에 대해 단일 염색된 세포를 검출하는 것으로 구성됩니다. 마지막으로, 각 염색 배치에 대해 양성 및 음성 대조군을 추가하는 것도 중요합니다. 면역 세포의 경우 편도선은 좋은 양성 대조군입니다. 최적 염색의 대표적인 결과가 도 1에 나타나 있다.
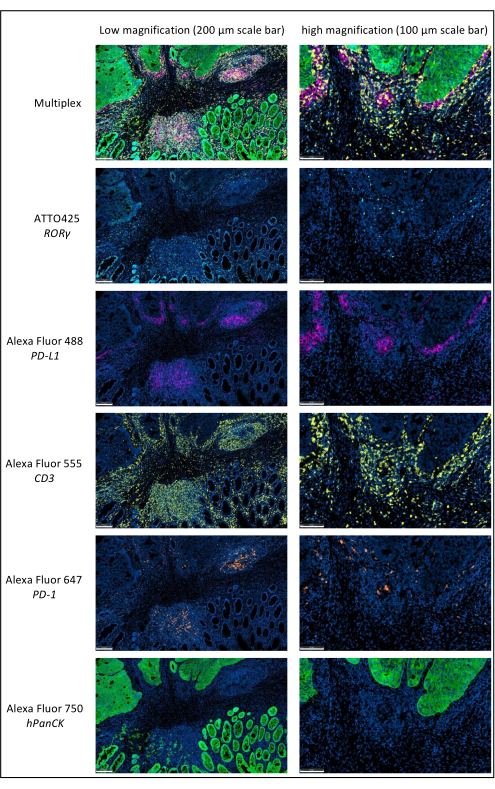
그림 1: 다중화 면역형광법으로 염색한 국소 진행성 직장암. 약어: PD-1 = 프로그래밍된 세포 사멸 단백질 1; PD-L1 = 프로그래밍된 사멸 리간드 1; ROR-γ = RAR 관련 고아 수용체 감마; CD3 = 분화 클러스터 3; hPanCK = 인간 범 사이토 케라틴. 각 항원 염색은 그레이스케일로 스캔되며 그림에 표시된 색상은 유사 색상입니다. 스케일 바 저배율: 200μm; 스케일 바 고배율: 100μm. 이 그림의 더 큰 버전을 보려면 여기를 클릭하십시오.
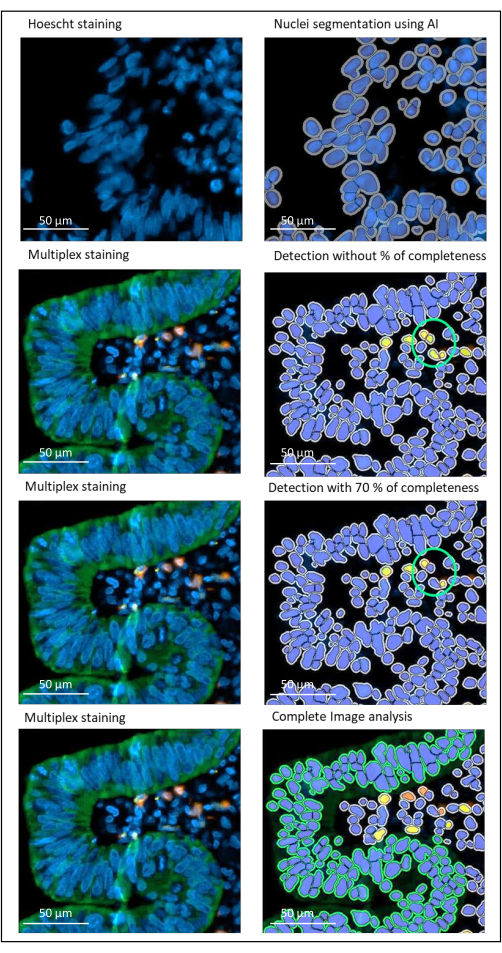
그림 2: 이미지 분석 소프트웨어를 사용한 국소 진행성 직장암의 핵 및 염색 검출. 완결성 백분율 매개변수가 올바르게 설정되지 않으면 소프트웨어는 두 개의 CD8+ 세포(녹색 원)가 서로 가깝기 때문에 감지하지만 하나의 세포만 염색됩니다. 70% 완전성을 사용하면 이러한 거짓 긍정 검색을 방지하는 데 도움이 됩니다. 녹색 = hPanCK; 노란색 = CD3; 주황색 = CD8. 스케일 바: 100 μm 이 그림의 더 큰 버전을 보려면 여기를 클릭하십시오.
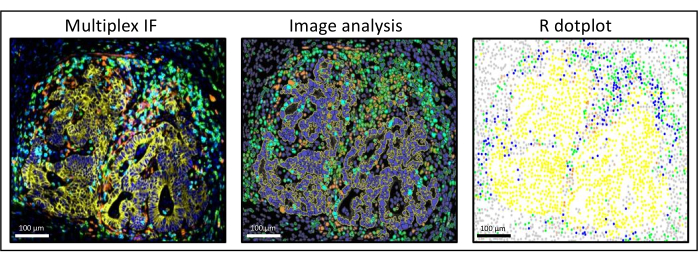
그림 3: 간 결장직장암 전이의 이미지 분석 및 R dot-plot 재구성. 멀티플렉스 염색(왼쪽)에서 인간 범사이토케라틴은 노란색, CD3는 녹색, CD8은 연한 파란색, IDO는 주황색입니다. 도트 플롯(오른쪽)에서 인간 범사이토케라틴+ 세포는 노란색, CD3+CD8- 세포는 녹색, CD3+CD8+ 세포는 파란색, IDO+ 세포는 주황색입니다. 이 그림의 더 큰 버전을 보려면 여기를 클릭하십시오.
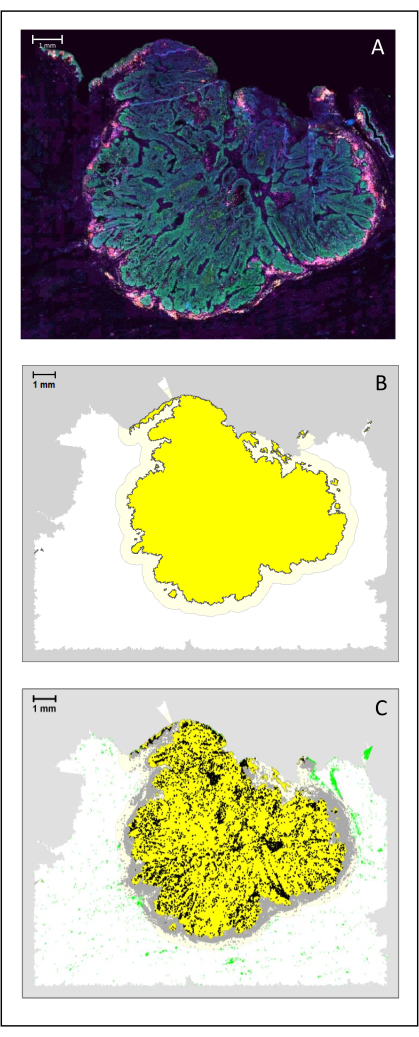
그림 4: HNSCC의 수술 섹션 분석. (A) HNSCC의 수술 섹션. 암세포는 녹색으로 보입니다. 종양 주위 세포는 종양 섬 주변에서 시각화됩니다 (CD3는 노란색, CD8은 보라색). (B) 종양의 중심(검은색 테두리가 있는 노란색)은 단일 영역에서 종양 섬 사이의 거리를 기반으로 k-가장 가까운 이웃 알고리즘에 의해 생물정보학적으로 계산됩니다. 이 영역 주변에서 침습적 마진(회색 테두리가 있는 밝은 노란색)이 임의의 500μm 기준으로 계산됩니다. (C) 침습성 T 세포는 종양 중앙에 검은색 점으로 강조 표시되고 침습성 가장자리에 회색 점으로 강조 표시됩니다. 다른 T 세포는 연한 녹색 점으로 강조 표시됩니다. 스케일 바: 1mm. 이 그림의 더 큰 버전을 보려면 여기를 클릭하십시오.
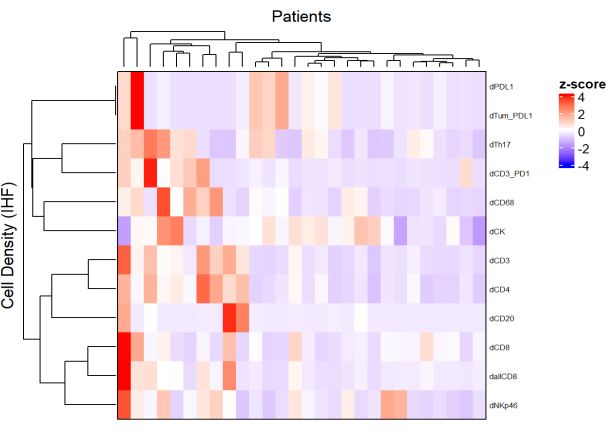
그림 5: 국소 진행성 직장암 생검의 다양한 세포 유형 밀도에 대한 히트맵. 히트맵은 ComplexHeatmap 패키지와 함께 서로 다른 멀티플렉스 패널에서 서로 다른 셀 유형의 밀도를 감독되지 않은 클러스터링으로 사용하여 그려졌습니다. 스케일링과 센터링은 정규화에 사용되었습니다. 이 그림의 더 큰 버전을 보려면 여기를 클릭하십시오.

그림 6: 각 IDO+ 또는 종양 세포에 대한 CD4+ 및 CD8+ 세포의 거리. 인간 범 사이토케라틴+ 세포는 노란색, CD3+CD8- 세포는 녹색, CD3+CD8+ 세포는 파란색, IDO+ 세포는 주황색입니다. (A) 종양 세포와 각 CD8+ T 세포 사이의 가장 가까운 거리. (B) IDO+ 세포와 각 CD8+ T 세포(파란색) 또는 CD4+ T 세포(녹색) 사이의 거리 막대 플롯. (C) G-크로스 함수로 분석한 샘플의 예. y축은 종양 세포가 종양 세포 주위의 0-200μm 범위의 반경에서 CD3+ 림프구와 만날 확률을 보여줍니다. 세 개의 곡선이 표시됩니다. 이론적 곡선은 녹색 점선(포아송 분포), km 보정이 있는 수정된 경험적 곡선은 검은색, 경계 보정이 있는 수정된 경험적 곡선은 빨간색 점선입니다. 이 그림의 더 큰 버전을 보려면 여기를 클릭하십시오.
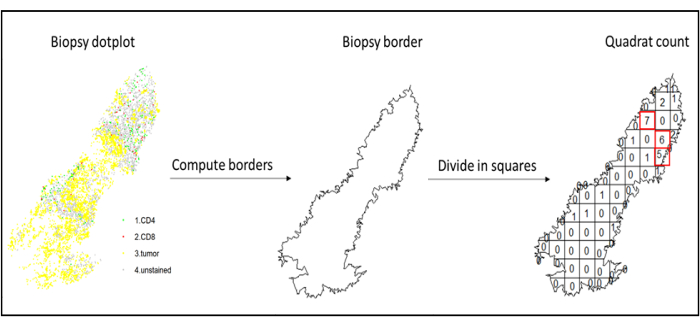
그림 7: Quadratcount의 그림. border 계산 및 quadratcount는 spatstats 패키지를 사용하여 수행되었습니다. 가장 많이 침투한 사각형(핫스팟)을 다운스트림 통계에 사용할 수 있습니다. CD4는 녹색, CD8은 빨간색, 종양 세포는 노란색입니다. 이 그림의 더 큰 버전을 보려면 여기를 클릭하십시오.
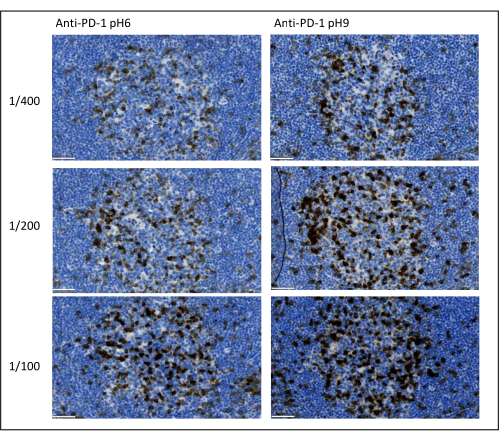
그림 8: 항체 희석 및 항원 검색 최적화. 1차 항체(구연산염 pH 6 및 EDTA pH 9)의 3가지 다른 희석액 및 2가지 다른 항원 검색 용액을 사용한 PD-1의 발색 검출. 스케일 바: 50μm. 이 그림의 더 큰 버전을 보려면 여기를 클릭하십시오.
| 1 차 항체 | 희석 | 항원 검색 | 2 차 항체 | 형광 색소 | 위치 |
| PD-1 (영어) | 1/100 | EDTA (pH 9) | 안티 래빗 | AF647 시리즈 | 1 |
| PD-L1 시리즈 | 1/1000 | EDTA (pH 9) | 안티 래빗 | AF488 시리즈 | 2 |
| ROR-γ | 1/200 | EDTA (pH 9) | 안티 마우스 | ATT0-425 | 3 |
| CD3 (영어) | 1/100 | 구연산염 (pH 6) | 안티 래빗 | AF555 시리즈 | 4 |
| h팬크 | 1/50 | 구연산염 (pH 6) | AF750과 결합된 안티 마우스 | 5 | |
표 1: 최적화된 멀티플렉스 패널의 예. 약어: PD-1 = 프로그래밍된 세포 사멸 단백질 1; PD-L1 = 프로그래밍된 사멸 리간드 1; ROR-γ = RAR 관련 고아 수용체 감마; CD3 = 분화 클러스터 3; hPanCK = 인간 범-사이토케라틴; AF = 알렉사플루오르; EDTA = 에틸렌 디아민 테트라 아세트산. CD3는 T 림프구를 검출하는데 사용된다; PD-1은 소진 된 림프구를 검출하는 데 사용됩니다. ROR-γ는 Th-17을 검출하는 데 사용됩니다. hPanCK는 종양 세포를 검출하는 데 사용됩니다. 위치 열은 순차적 멀티플렉스를 수행해야 하는 순서를 나타냅니다.
토론
멀티플렉스 염색을 최적화하기 위해 고려해야 할 가장 중요한 파라미터는 각 1차 항체에 사용되는 희석, 특이성 및 항원 검색입니다. 멀티플렉스 프로토콜을 시작하기 전에 각 1차 항체의 최적 희석 및 최적 에피토프 검색(pH 6 또는 pH 9)을 발색 염색(DAB)을 사용하여 테스트해야 합니다. 각 항원 검색 완충액에 대해 세 가지 희석액을 테스트하는 것이 좋습니다: 일반적으로 항체를 상용화하는 브랜드에서 지정하는 희석액, 동일한 희석액을 2배로 나누고, 동일한 희석액을 2배로 나누는 것입니다(그림 8). 올바른 희석액을 선택하는 것은 항체 특이성을 검증하고 염색의 신호 대 잡음비(SNR)를 최적화하는 데 매우 중요한 단계입니다. DAB에서 올바른 희석액을 선택한 후 uniplex TSA를 사용하여 각 1차 항체에 대해 동일한 희석액을 테스트해야 합니다. 희석 및 에피토프 검색 완충액이 각 항원 염색에 대해 선택되면 멀티플렉스의 서열을 올바르게 설정하는 것도 중요합니다. 특히, 일부 항원은 첫 번째 위치에서 더 잘 염색되고 다른 항원은 마지막 위치에서 더 잘 염색됩니다. 가능한 모든 순서 순열을 사용하여 다중 라벨링을 테스트하여 어떤 항원 염색이 첫 번째, 두 번째 등으로 이루어져야 하는지 선택하는 것이 좋습니다. 일부 취약한 항원은 여러 라운드의 에피토프 회수 후에 분해될 수 있고 일부 항원은 여러 라운드의 에피토프 회수 후에 더 잘 염색되기 때문에 이것은 또한 매우 중요한 단계입니다. 예를 들어, SNR은 CD3의 마지막 위치 및 PD-1 염색의 첫 번째 위치에서 항상 더 높습니다. 더욱이, 몇몇 공동-국소화된 항원의 염색은 우산 효과(티라마이드 반응 부위의 포화)에 의해 방해될 수 있다. 이것은 티라마이드 농도를 감소시킴으로써 약화될 수 있습니다. 한 항원의 발현이 다른 항원의 발현에 의해 조절되는 경우(CD8은 CD3 발현 T 세포에만 존재), 다른 항원 다음에 가장 넓은 발현(이 경우 CD3)으로 항원을 염색하는 것이 좋습니다. 마지막으로, 스캐너 특이성에 따라 각 항원 염색에 적합한 형광색소를 선택하는 것도 교차 검출을 피하기 위한 중요한 단계입니다.
이 기술의 주요 장점은 증폭 및 신호 대 잡음비입니다. 그러나 이 기술은 염색이 순차적이고 형광색소가 조직에 공유 결합되어 있다는 한계가 있습니다. 그럼에도 불구하고, 모든 티라마이드 신호 증폭 라운드를 수행한 후, 형광색소와 직접 결합된 2차 항체(TSA 없음)로 마지막 염색을 추가할 수도 있습니다. 일부 패널에서는 이 방법을 사용하여 750 채널에 염색을 추가했습니다. 그 당시에는 티라미드-AF750이 상업적으로 이용 가능하지 않았기 때문에 이것은 필요했습니다. 참고로, AF750으로 염색된 항원의 노출 시간(스캔 중)은 TSA로 염색된 다른 항원보다 훨씬 더 깁니다. 이 경우 사이토케라틴과 같이 고도로 발현된 단백질을 염색하거나 1차 항체의 농도를 높이는 것이 좋습니다. 이를 통해 형광 스캐너에 따라 슬라이드당 최대 5-6개의 항원을 한 배치로 염색할 수 있습니다.
반대로, 상업적으로 이용 가능한 여러 기술은 하나의 단일 조직 섹션에서 염색할 수 있는 항원의 수를 개선하기 위해 여러 라운드의 염색, 스캐닝, 스트리핑 또는 광표백을 통한 연속 염색을 사용합니다. 그러나 이러한 기술은 종종 시간이 많이 걸리고 비용이 많이 들며 신호 증폭이 없으며 직렬 스캔을 올바르게 병합하기 위해 고급 계산 단계가 필요하며 경험상 수많은 절차 단계로 인해 돌이킬 수 없는 조직 손상을 유발할 수 있습니다. 그럼에도 불구하고, 이 방법을 사용하여 하나의 단일 조직에서 최대 30개의 항원을 염색할 수 있다고 보고되었다14.
결론적으로, 당사의 방법은 형광 슬라이드 스캐너를 보유한 모든 실험실에서 사용할 수 있는 강력하고 재현 가능하며 사용하기 쉽고 비용 효율적인 면역조직형광 기술입니다. IHC에 적합한 임의의 상업화된 1차 항체가 사용될 수 있고, 패널은 임의의 상업적 키트에 특이적이지 않다. 이미지 분석은 QuPath 및 R과 같은 오픈 소스 프로그램을 포함하여 여러 프로그램에서 수행할 수 있습니다. 그러나 우리는 이 방법이 향후 대형 항원 패널의 경우 개선될 수 있다고 생각하며, 이를 통해 다른 항원 패널과 신호 증폭의 이점을 통해 동일한 슬라이드의 연속 염색/스캐닝을 수행할 수 있습니다.
공개
저자는 선언할 이해 상충이 없습니다.
감사의 말
저자는 그녀의 도움과 지원에 대해 Dr. Derouane F에게 감사의 말을 전합니다. Nicolas Huyghe는 벨기에 국립 과학 연구 기금(Télévie/FNRS 7460918F)의 보조금을 받는 연구원입니다.
자료
| Name | Company | Catalog Number | Comments |
| anti-CD3 primary antibody | Abcam | ab16669 | rabbit monocolonal |
| anti-CD8 primary antibody | DAKO | M710301 | mouse monoclonal |
| anti-hPanCK primary antibody | DAKO | M3515 | mouse monoclonal |
| anti-PD-1 primary antibody | Cell Signalling | D4W2J | rabbit monocolonal |
| anti-PD-L1 primary antibody | Cell Signalling | 13684 | rabbit monocolonal |
| anti-RORC primary antibody | Sigma | MABF81 | mouse monoclonal |
| ATTO-425 | ATTOtec | ||
| Axioscan Z1 | Zeiss | Light source: Colibri 7 (385, 430, 475, 555, 590, 630, 735 nm) Filtersets: Excitation 379/34 – beam splitter 409 – emission 440/40; Excitation 438/24 – beam splitter 458 – emission 483/32; Excitation 490/20 – beam splitter 505 – emission 525/20; Excitation 546/10 – beam splitter 556 – emission 572/23; Excitation 592/21 – beam splitter 610 – emission 630/30; Excitation 635/18 – beam splitter 652 – emission 680/42; Excitation 735/40 – beam splitter QBS 405 + 493 + 611 + 762 - emission QBP 425/30 + 524/51 + 634/38 + 785/38; Objective: Plan-Apochromat 20x/0.8; Camera : Orca Flash 4.0 V3 | |
| Borosilicate Cover Glass | VWR | 631-0146 | |
| Envision+ anti-mouse | DAKO | K4001 | |
| Envision+ anti-rabbit | DAKO | K4003 | |
| Fluorescence mounting medium | DAKO | S3023 | |
| Goat anti-Mouse IgG (H+L) Cross-Adsorbed Secondary Antibody, Alexa Fluor 750 | ThermoFischer | A-21037 | |
| HALO software | Indicalabs | ||
| Hoescht | Sigma | 14533 | |
| Superfrost plus microscope slides | Fisherscientific/Epredia | 10149870 | |
| Tyramide-AF488 | ThermoFischer | B40953 | |
| Tyramide-AF555 | ThermoFischer | B04955 | |
| Tyramide-AF647 | ThermoFischer | B04958 |
참고문헌
- Ge, P., et al. Profiles of immune cell infiltration and immune-related genes in the tumor microenvironment of colorectal cancer. Biomedicine & Pharmacotherapy. 118, 109228 (2019).
- Fridman, W. H. The immune microenvironment as a guide for cancer therapies. Oncoimmunology. 1 (3), 261-262 (2012).
- Fridman, W. H., Pages, F., Sautes-Fridman, C., Galon, J. The immune contexture in human tumours: Impact on clinical outcome. in Nature Reviews. Cancer. 12 (4), 298-306 (2012).
- Hanahan, D., Weinberg, R. A. Hallmarks of cancer: The next generation. Cell. 144 (5), 646-674 (2011).
- Calu, V., et al. Key biomarkers within the colorectal cancer related inflammatory microenvironment. Scientific Reports. 11 (1), 7940 (2021).
- Havel, J. J., Chowell, D., Chan, T. A. The evolving landscape of biomarkers for checkpoint inhibitor immunotherapy. Nature Reviews. Cancer. 19 (3), 133-150 (2019).
- Pages, F., et al. International validation of the consensus Immunoscore for the classification of colon cancer: a prognostic and accuracy study. Lancet. 391 (10135), 2128-2139 (2018).
- Mlecnik, B., et al. Integrative analyses of colorectal cancer show immunoscore is a stronger predictor of patient survival than microsatellite instability. Immunity. 44 (3), 698-711 (2016).
- Gu, Z., Eils, R., Schlesner, M. Complex heatmaps reveal patterns and correlations in multidimensional genomic data. Bioinformatics. 32 (18), 2847-2849 (2016).
- Baddeley, A., Rubak, E., Turner, R. . Spatial Point Patterns: Methodology and Applications with R. , (2022).
- Barua, S., et al. Spatial interaction of tumor cells and regulatory T cells correlates with survival in non-small cell lung cancer. Lung Cancer. 117, 73-79 (2018).
- Parra, E. R. Methods to determine and analyze the cellular spatial distribution extracted from multiplex immunofluorescence data to understand the tumor microenvironment. Frontiers in Molecular Biosciences. 8, 668340 (2021).
- El Sissy, C., et al. A diagnostic biopsy-adapted immunoscore predicts response to neoadjuvant treatment and selects patients with rectal cancer eligible for a watch-and-wait strategy. Clinical Cancer Research. 26 (19), 5198-5207 (2020).
- Bolognesi, M. M., et al. Multiplex staining by sequential immunostaining and antibody removal on routine tissue sections. The Journal of Histochemistry and Cytochemistry. 65 (8), 431-444 (2017).
재인쇄 및 허가
JoVE'article의 텍스트 или 그림을 다시 사용하시려면 허가 살펴보기
허가 살펴보기더 많은 기사 탐색
This article has been published
Video Coming Soon
Copyright © 2025 MyJoVE Corporation. 판권 소유