Method Article
LipidUNet-iPSC 유래 망막 색소 상피를 이용한 지질 침전물의 특성화 및 정량화의 기계 학습 기반 방법
요약
눈의 망막 색소 상피층에 영향을 미치는 퇴행성 안구 질환은 단일 유전자 및 다유전자 기원을 가지고 있습니다. 여러 질병 모델과 소프트웨어 응용 프로그램인 LipidUNet이 질병의 메커니즘과 잠재적인 치료 개입을 연구하기 위해 개발되었습니다.
초록
망막 색소 상피(RPE)는 눈 뒤쪽에 위치한 육각형 세포의 단층입니다. 광수용체와 맥락막 모세혈관에 영양과 지원을 제공하고, 광수용체 외분절(POS)의 식균작용을 수행하며, 외망막의 항상성을 유지하기 위해 분극화된 방식으로 사이토카인을 분비합니다. 돌연변이, 노화 및 환경적 요인으로 인한 기능 장애 RPE는 다른 망막층의 퇴행을 초래하고 시력 상실을 유발합니다. 퇴행성 RPE의 특징적인 표현형 특징은 세포 내 및 세포 내 지질이 풍부한 침전물입니다. 이러한 침전물은 다양한 망막 퇴행성 질환에 걸쳐 공통적인 표현형입니다. 시험관 내에서 단일 유전자 망막 변성의 지질 침착 표현형을 재현하기 위해 환자의 섬유아세포에서 유도 만능 줄기 세포 유래 RPE(iRPE)를 생성했습니다. Stargardt 및 후기 발병 망막 변성(L-ORD) 질환 환자에서 생성된 세포주를 7일 동안 POS를 공급하여 RPE 생리 기능을 복제하여 이러한 질병에서 POS 식균 작용 유발 병리를 유발했습니다. 대체 보체 활성화와 관련된 다원성 질환인 연령 관련 황반변성(AMD)에 대한 모델을 생성하기 위해 iRPE는 대체 보체 아나필라톡신에 도전했습니다. 세포 내 및 세포 내 지질 침전물은 나일 레드, 붕소-디피로메텐(BODIPY) 및 아포지단백 E(APOE)를 사용하여 특성화되었습니다. 지질 침전물의 밀도를 정량화하기 위해 기계 학습 기반 소프트웨어인 LipidUNet이 개발되었습니다. 이 소프트웨어는 배양 표면에서 iRPE의 최대 강도 투영 이미지에 대해 훈련되었습니다. 앞으로는 3차원(3D) 이미지를 분석하고 지질 방울의 부피를 정량화하는 훈련을 받을 예정입니다. LipidUNet 소프트웨어는 질병 모델에서 지질 축적을 감소시키는 약물을 발견하는 데 유용한 리소스가 될 것입니다.
서문
망막 색소 상피(RPE)는 망막 광수용체에 인접한 눈 뒤쪽에 위치한 세포의 단층입니다. RPE는 광수용체에 대사 및 구조적 지원을 제공하여 적절한 시력을 유지하는 데 중요한 역할을 합니다. 건강한 RPE 세포는 뚜렷한 육각형 형태가 특징입니다. 그것들은 긴밀한 접합부로 연결되어 RPE가 기저부에 위치한 융모막 모세 혈관과 정점에 위치한 광 수용체 사이의 장벽 역할을 할 수 있습니다. 망막 생태계를 유지하기 위해 RPE는 RPE1에서 포도당 소비를 최소화하는 방식으로 포도당과 같은 주요 대사 산물을 광수용체로 셔틀합니다. 이러한 제한으로 인해 RPE는 지방산을 포함한 대사 요구를 유지하기 위해 다른 대사 산물에 의존하며, RPE는 β 산화를 통해 케톤으로 전환됩니다2. 광수용체 외분절(POS) 소화에서 재활용될 가능성이 있는 지방산을 에너지원으로 활용하는 RPE의 성향을 감안할 때, RPE의 지질 처리 경로에 대한 해로운 변화는 종종 단일 유전자 및 다유전자 퇴행성 망막 질환을 유발하거나 연루됩니다3.
RPE 변성을 유발하는 다유전자성 퇴행성 안구 질환인 연령 관련 황반변성(AMD)도 RPE 단층의 비정상적인 자가포식 및 지질 대사와 관련이 있습니다. 기능 장애가 있는 RPE 단층이 POS를 처리하고 다른 중요한 기능을 수행하지 못하면 RPE와 Bruch 막 사이에 위치한 기저 선형 침전물(BLinD)이라고 하는 세포외(하위 RPE) 침전물이 발생하며, 이는 AMD 병리의 특징입니다. BLinD의 주요 성분에는 지단백질이 포함되며, 그 중 가장 풍부한 것은 아포지단백 E(APOE)4입니다. BLinD의 얇은 층이 축적되면 AMD 5,6의 임상 증상으로 인식되는 부드러운 드루젠이 발생할 수 있습니다.
몇몇 그룹은 RPE 기능장애를 유발하는 줄기 세포 유래 시험관내 질환 모델이 서브-RPE 지질 축적을 특징으로 한다는 것을 보여주었다 7,8,9. Hallam et al. (2017)은 CFH 유전자의 다형성으로 인해 AMD 위험이 높은 환자로부터 유도 만능 줄기 세포 유래 RPE(iRPE)를 생성했습니다. iRPE는 APOE에 의해 표시된 바와 같이 드루젠 축적을 보였고, 고위험 RPE는 저위험 환자로부터 생성된 iRPE보다 더 많은 침전물을 축적했다10.
지질 방울 및 드루젠 침착과 같은 AMD의 세포 특징을 요약하는 시험관 내 모델을 만들기 위해 이전에 발표된 발달 유도 프로토콜11을 사용하여 환자 혈액 샘플에서 생성된 iRPE 라인을 설정했습니다. iRPE는 AMD의 가능한 원인 중 하나를 모방하는 아나필라톡신을 함유한 용액인 보체 적격 인간 혈청(CC-HS)에 노출되었다: 증가된 대체 보체 신호 전달8. 지질 침전물의 결과적인 세포 및 세포 내 침착은 일반적으로 사용되는 지질 및 지단백질 마커인 APOE, Nile Red 및 BODIPY를 사용하여 측정되었습니다. 이들 마커를 통해, CC-HS를 통한 활성화된 보체 신호전달이 iRPE 세포에서 지질 축적을 악화시킨다는 것을 보여주었다8.
단일 유전자 망막 퇴행성 질환에 대한 질병 모델을 개발하기 위해 RPE의 ABCA4 유전자 돌연변이로 인해 발생하는 질병인 스타가르트병 환자로부터 iRPE 라인을 개발했습니다. ABCA4 가 녹아웃되면 높은 수준의 인지질과 광 의존성 지질 과산화 생성물을 포함하는 것으로 알려진 세포 내 침전물인 A2E 리포푸신이 RPE12 내부에 축적되는 것으로 나타났습니다. ABCA4 녹아웃 라인은 환자 라인과 함께 개발되었으며 둘 다 POS 공급을 받았습니다. Stargardt iRPE는 BODIPY 염색으로 정량화된 증가된 지질 축적을 나타내는 POS 식균 작용 유발 병리를 입증했습니다. ABCA4 KO iPSC에서 유래한 RPE는 CC-HS 처리를 받았습니다. BODIPY 신호의 정량화는 스타가르트병 모델에서도 지질 처리에 결함이 있는 것으로 나타났다9.
이러한 질병의 유병률과 효과적인 치료법의 필요성을 감안할 때, 위에서 설명한 관련 질병 모델과 함께 잠재적 치료법의 효능을 정량화하기 위한 강력한 방법을 확립할 필요가 있습니다. 객관적이고 자동화되고 표준화된 방식으로 지질 침전물을 정량화하기 위해 머신 러닝 기반 소프트웨어인 LipidUNet이 만들어져 마스크 분석 도구와 함께 사용할 때 일반적인 마커인 Nile Red, BODIPY 및 APOE를 사용하여 지질 침착을 빠르고 효과적으로 식별할 수 있습니다. 그런 다음 이 분석 파이프라인을 사용하여 얻은 요약 통계를 분석하고 그래픽으로 표시하여 치료 조건을 쉽게 비교할 수 있습니다. 프로토콜의 회로도는 그림 1에 나와 있습니다.
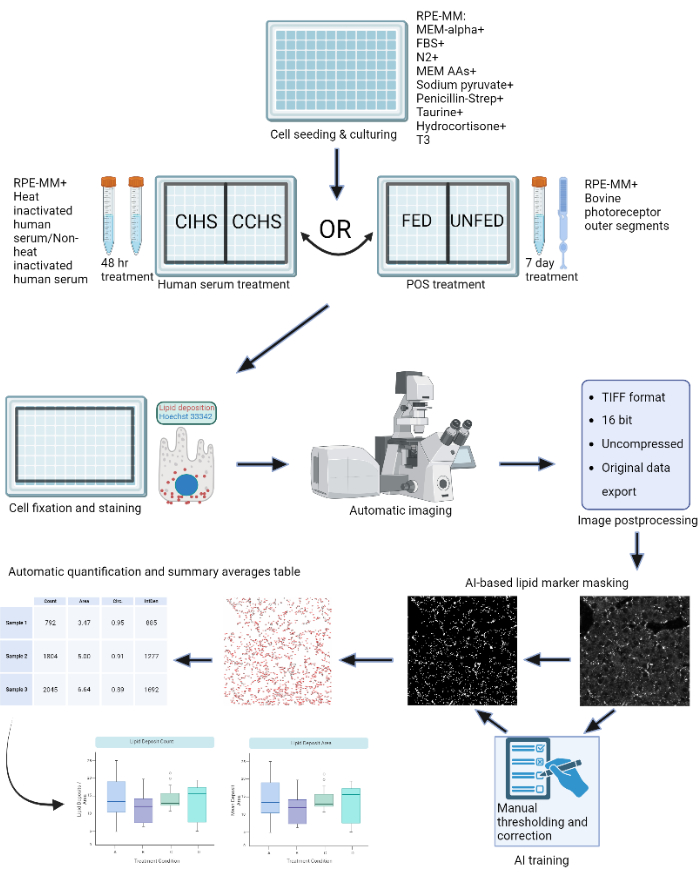
그림 1: 프로토콜 개략도: RPE 세포는 96웰 플레이트에서 성장되고 활성 인간 혈청 또는 정제된 소 외부 세그먼트로 챌린지되어 시험관 내에서 다양한 유형의 망막 변성을 모델링합니다. RPE 세포는 Nile Red, BODIPY 및 APOE를 사용하여 지단백질 침전물을 위해 고정되고 염색됩니다. 컨포칼 현미경은 형광 표지된 지질 입자의 Z 스택을 획득하는 데 사용되며, 이후 2D 최대 강도 투영으로 처리됩니다. 기계 학습 알고리즘은 지단백질 입자를 인식하고 정확하게 분할하도록 훈련되었습니다. 입자 수 및 다양한 형상 메트릭이 포함된 요약 테이블이 생성되며 후속 플로팅 및 통계 분석에 사용할 수 있습니다. 이 그림의 더 큰 버전을 보려면 여기를 클릭하십시오.
프로토콜
모든 프로토콜 단계는 NIH의 인간 연구 윤리 위원회에서 정한 지침을 준수합니다. 줄기 세포 작업 및 환자 샘플 수집은 미국 정부의 45 CFR 46 지침에 따라 NIH OHRP(Office of Human Research Protection) 산하 CNS IRB(Combined NeuroScience Institutional Review Board)의 승인을 받았습니다. 환자 샘플은 프로토콜 번호 NCT01432847(https://clinicaltrials.gov/ct2/show/NCT01432847?cond=NCT01432847&draw=2&rank=1)에 따라 헬싱키 선언에 의해 설정된 기준에 따라 CNS IRB 승인 동의서를 사용하여 수집되었습니다.
1. iRPE 생성
- Sharma et al., 202211 (그림 2 및 그림 3)이 발표한 프로토콜에 따라 환자 혈액 유래 iPSC에서 iRPE를 생성합니다.

그림 2: iRPE 분화 및 성숙 개략도. iRPE를 생성하기 위해, 확립된 분화 프로토콜을 따랐고, 세포를 5주 동안 성숙시켰다. 그 결과 세포 배양은 AMD 및 스타가르트병과 같은 질병에서 RPE 기능 장애를 모방하기 위해 다양한 치료법으로 조작할 수 있는 시험관 내 모델로 작용합니다. 이 그림의 더 큰 버전을 보려면 여기를 클릭하십시오.
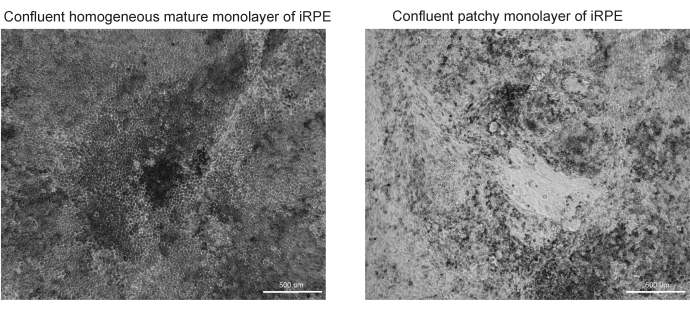
그림 3: RPE 차별화 및 성숙의 성공 및 실패의 대표 이미지. TJP1 RPE의 10배 배율에서 두 개의 명시야 이미지가 iRPE 프로토콜의 42일차에 표시됩니다. (A) 성공적인 분화 및 성숙은 색소 침착 및 다각형 형태와 함께 합류 RPE를 보여줍니다. (B) 실패한 분화 및 성숙은 여기에 표시된 바와 같이 죽어가는 세포의 클러스터를 보여줍니다. 이 그림의 더 큰 버전을 보려면 여기를 클릭하십시오.
2. RPE 유지보수 매체(RPE-MM) 준비
- N2 보충제를 4°C에서 밤새 해동합니다. 다른 모든 시약을 실온(RT)에서 해동합니다.
- 멸균 조건에서 Sharma et al., 2022 11에 의해 설정된 프로토콜에 따라 나열된 희석 계수에 표 1에 나열된 시약을 추가합니다.
- 매체를 잘 혼합하고 0.22μm 여과 장치를 사용하여 여과합니다.
알림: 미디어는 2°C에서 보관할 경우 4주 이내에 사용하기에 적합합니다.
3. 96웰 플레이트 파종
- RT에서 비트로넥틴 분취량을 3-5분 동안 또는 얼음이 완전히 녹을 때까지 해동합니다.
- 비트로넥틴을 1x 둘베코 인산염 완충 식염수(DPBS)로 희석하여 1:200 희석(비트로넥틴: DPBS)을 사용하여 원하는 작업 용액을 얻습니다. 96웰 플레이트의 경우 각 웰에 200μL의 작업 용액을 코팅합니다.
- 해동된 ROCK 억제제(Y-27632 디하이드로클로라이드)를 RPE-MM과 1:1000 희석하여 최종 농도 10μM를 달성합니다. 이것은 RPE 셀용 도금 매체입니다.
- 자동 세포 해동 시스템을 사용하여 iRPE 바이알을 해동하고 iRPE 세포 현탁액을 50mL 튜브로 옮깁니다.
- 세포 현탁액을 도금 매체로 1:10 희석으로 희석합니다. 튜브를 400 x g 에서 5분 동안 원심분리합니다.
- 상층액을 조심스럽게 흡인하고 10mL의 도금 배지에 세포를 재현탁합니다.
- 세포 계수를 위해 400 μL의 도금 매체와 100 μL의 재현탁 세포 용액을 혼합합니다. 이 분취액을 사용하여 세포 생존율 계수기를 사용하여 세포 현탁액의 생존 세포 농도를 결정합니다.
- 도금 매체로 세포 현탁액을 최종 농도 60,000 cells/mL로 희석합니다.
- 96웰 플레이트에서 비트로넥틴 코팅 용액을 완전히 흡인하고 세포 현탁액 200μL를 각 웰에 분주합니다. 대략 12,000 세포 / 웰 또는 ~ 200 세포 / mm2가 있습니다.
- 시딩된 세포 플레이트를 37°C 및 5%CO2에서 48시간 동안 인큐베이션한다. 48시간 후, 배지를 ROCK 억제제 보충 없이 RPE-MM으로 변경합니다. 5 주간의 성숙 기간 동안 2-3 일마다 미디어를 교체하십시오.
4. 체외 질환 모델
- 보체 유능한 인간 혈청(CC-HS) 치료
- Human Complement 컴피턴트 세럼을 4°C에서 하룻밤 동안 해동합니다.
- CC-HS를 준비하고 무능한 인간 혈청(CI-HS) 배지를 보완합니다.
- 5% CC-HS 배지를 준비하려면 해동된 보체 유능한 인간 혈청을 RPE-MM과 1:20 희석으로 혼합합니다. 사용하기 전에 0.22μm 매체 필터를 통해 용액을 여과합니다.
- 5% 보체 무능 인간 혈청(CI-HS) 배지를 준비하기 위해 먼저 CC-HS를 57°C 수조에서 30분 동안 가열 비활성화한 다음 배양 배지와 1:20 희석하여 혼합합니다. 사용하기 전에 0.22μm 매체 필터를 통해 용액을 여과합니다.
- 혈청은 48시간의 총 배양 시간 동안 200μL의 5% CC-HS 또는 5% CI-HS 배지로 세포를 처리하고 24시간 후에 배지를 새로 고칩니다.
- 세포를 1x DPBS로 세척하고 RT에서 20분 동안 4% 파라포름알데히드로 고정하고, 1x DPBS로 한 번 더 세척하고, 샘플을 4°C에서 저장하고, 200 μL의 DPBS에 담근다.
- 선택 사항: 원하는 경우 플레이트에서 세포를 용해하여 하위 RPE 지질 증착만 표시합니다.
- 세포를 용해하고 지질 침전물만 남기려면 배지를 제거하고 각 웰에 200μL의 탈이온수를 추가합니다.
- 10-15분 동안 배양하고 세포가 제거될 때까지 위아래로 피펫을 사용합니다. 200 μL의 탈이온수로 한 번 더 세척하고 즉시 4% 파라포름알데히드로 세포를 고정합니다.
- Hoechst를 이용한 핵 염색법으로 세포 제거 효능을 확인하였다. 1% 소 혈청 알부민(BSA), 1% 트윈 20 및 0.5% Triton-X 0.5을 포함하는 1x DPBS 용액에 2000:0.5 희석의 Hoechst를 추가합니다. 어둠 속에서 1 시간 동안 RT에서 배양하십시오. 그런 다음 1x DPBS로 세척하십시오.
- iRPE에서 광수용체 외부 세그먼트(POS) 처리
- POS 준비
- POS 펠릿 튜브를 -80°C 보관에서 제거하고 덮개가 있는 얼음 양동이에서 4°C에서 밤새 해동합니다.
- 이중 탈이온화된H2O(ddH2O) 40 mL에 자당 10 g을 혼합하여 POS 세척 완충액을 준비한다.
- 혼합물을 40-50°C에서 15분 동안 부드럽게 교반하면서 가열합니다. 혼합물에 중탄산나트륨 840mg을 넣고 10분 동안 가열하면서 저어줍니다.
- POS 세척 완충액의 총 부피를 ddH2O를 사용하여 100mL로 조정하고 필요에 따라 1N HCl 또는 1N NaOH를 사용하여 용액의 pH를 8.3으로 조정합니다. 세척 용액을 0.22 μm 필터를 이용하여 여과한다.
참고: 여기에서 프로토콜을 일시 중지할 수 있습니다. POS 세척 버퍼는 4°C에서 하룻밤 동안 보관할 수 있습니다. - 해동되면 펠릿을 POS 세척 버퍼 15mL에 현탁합니다. POS 무결성을 보장하기 위해 펠릿 서스펜션 중에 부드럽게 하십시오. POS 현탁액을 4°C에서 600 x g 에서 20분 동안 원심분리한 다음 상층액을 흡인합니다.
- POS 세척 버퍼 10mL에 POS 펠릿을 다시 일시 중단합니다.
- POS + POS 세척 완충액(POS 용액)의 100μL 분취량을 제거하고 400μL의 1x DPBS로 희석합니다. 희석된 POS 용액 50μL를 혈액 한천 플레이트와 아가로스 플레이트에 펴 바서 박테리아 및 곰팡이 오염 물질을 확인합니다. 각각에 대해 양성 대조군을 준비하고 모든 플레이트를 37°C에서 48시간 동안 배양합니다.
- 마이코플라스마를 테스트하기 위해 검출 웰에 POS 용액 1μL를 추가하여 qPCR 분석을 수행합니다. DNA 단편을 증폭하려면 변성(95°C, 15초)과 어닐링 및 신장(60°C, 1분)의 40주기를 수행합니다. POS 샘플에서 마이코플라스마를 검출하기 위한 정방향 및 역방향 프라이머는 다음과 같습니다.
전방 프라이머: GGA TTA GAT ACC CTG GTA GTC CAC G
역방향 프라이머: CGT CAA TTC CTT TAA GTT TCA CTC TTG GC - 필요에 따라 세포 분석기와 분취량을 사용하여 POS 농도를 측정합니다. RPE 셀이 있는 96웰 플레이트 1웰의 경우 3 x 10⁶ POS로 충분합니다. 원하는 비율은 10 POS/RPE 셀입니다. 나중에 사용할 수 있도록 분취량을 80°C에서 보관하십시오.
- 셀에 POS 추가
- 얼음 욕조에서 POS 바이알을 해동합니다.
- 계산된 양만큼 준비된 POS를 RPE-MM과 혼합하고 POS로 세포를 7일 동안 1일 1회 처리합니다.
알림: POS 용액을 매일 신선하게 준비하십시오. - 세포를 1x DPBS로 세척한 다음 RT에서 20분 동안 4% 파라포름알데히드로 고정합니다. DPBS로 한 번 더 세척하고 샘플을 4°C에서 보관하고 200μL의 DPBS에 담근다.
- POS 준비
5. 하위 RPE 침전물에 대한 염색
- 나일강 적색 염색 프로토콜
- PFA 고정 후 샘플을 1x DPBS로 3회 세척합니다.
알림: 즉시 사용하지 않으면 여기에서 프로토콜을 일시 중지할 수 있지만 samples는 1°C에서 0.02x DPBS + 4% 아지드화나트륨 용액에 보관해야 합니다. - 나일 레드 원액을 준비하려면 나일 레드 분말을 3mg/mL 농도의 아세톤에 녹입니다. 주기적인 혼합과 함께 RT에서 15분 동안 배양합니다. 용액에 남아 있는 침전물의 정도에 따라 0.22 μm 필터로 용액을 한두 번 여과한다.
알림: 원액을 빛으로부터 보호하십시오. - 작업 용액을 준비하려면 1x DPBS에 500:1의 비율로 원액을 희석합니다. 200 μL의 작업 용액을 쉐이커의 RT에서 30분 동안 샘플에 추가하고 빛으로부터 보호합니다.
- 1x PBS로 3회 세척하고, 샘플을 4°C에서 저장하고, DPBS의 200 μL에 침지시켰다.
참고: 96웰 플레이트 대신 트랜스웰에서 실험을 수행하는 경우 샘플을 마운팅 미디어가 있는 슬라이드에 장착하고 유리 커버슬립으로 덮고 투명 매니큐어로 밀봉할 수 있습니다. 셀이 위를 향하도록 샘플을 장착할 때 주의해야 합니다.
- PFA 고정 후 샘플을 1x DPBS로 3회 세척합니다.
- BODIPY 염색 프로토콜
- 원액의 경우 BODIPY를 무수 디메틸 설폭사이드(DMSO)에 용해시켜 3.8mM의 원액 농도를 얻습니다.
- PFA 고정 샘플의 경우 BODIPY 스톡을 1x DPBS에서 300:1로 희석합니다. 세포에 200 μL를 첨가하고 RT의 로커에서 밤새 배양합니다.
- 1x DPBS로 3회 세척하고 샘플을 4°C에서 보관하고 200μL의 DPBS에 담근다.
참고: 96웰 플레이트 대신 트랜스웰에서 실험을 수행하는 경우 샘플을 마운팅 미디어가 있는 슬라이드에 장착하고 유리 커버슬립으로 덮고 투명 매니큐어로 밀봉할 수 있습니다. 셀이 위를 향하도록 샘플을 장착할 때 주의해야 합니다.
- APOE 면역염색 프로토콜
- 1x DPBS를 1% 소 혈청 알부민(BSA), 0.5% 트윈 20 및 0.5% Triton-X 100과 결합하여 완충 용액을 만듭니다.
- PFA 고정 샘플의 경우ampRT에서 1시간 동안 버퍼 용액 200μL에서 샘플을 차단하고 투과화합니다.
- 완충액에 1:100으로 희석된 APOE 1차 항체를 첨가하고 RT에서 하룻밤 동안 배양합니다.
- 다음날 샘플을 1x DPBS로 3회 세척합니다.
- 완충액에 1:1000 희석으로 2차 항체를 추가하고 RT에서 1시간 동안 200μL의 용액을 세포에 추가합니다.
- 1x DPBS로 3회 세척하고 샘플을 4°C에서 보관하고 200μL의 DPBS에 담근다.
참고: 96웰 플레이트 대신 트랜스웰에서 실험을 수행하는 경우 샘플을 장착 매체(Fluoromount)가 있는 슬라이드에 장착하고 유리 커버슬립으로 덮고 투명 매니큐어로 밀봉할 수 있습니다. 셀이 위를 향하도록 샘플을 장착할 때 주의해야 합니다.
6. 이미지 자동화 및 처리
- 자동 이미지 스캔
참고: 이 연구에서는 Zeiss LSM 800 도립 컨포칼 스캐닝 현미경과 ZEN 3.2(블루 에디션) 소프트웨어를 사용했습니다. 온도 변화에 따른 매체의 굴절률 변화로 인한 스캔 중 초점면 드리프트를 방지하기 위해 이미징하기 전에 96웰 플레이트를 최소 60분 동안 RT로 예열해야 합니다.- 컨포칼 현미경과 40x 대물렌즈를 사용하여 사용된 지질 마커 및 추가 항체에 적합한 형광 채널이 있는 스캔 프로파일을 생성합니다.
- 타일 체크상자를 사용하여 이미지 자동화를 설정합니다. 96웰 플레이트를 교정하려면 올바른 샘플 캐리어 측정값을 입력하고 선택해야 합니다. 그런 다음 보정 버튼을 클릭하여 지침에 따라 플레이트를 보정하며, 이를 위해서는 10x 대물렌즈를 사용해야 합니다.
- 고급 설정 보기를 선택하여 적절한 웰을 선택하고 위치 기능을 사용하여 웰 중앙 근처에 3개의 다른 이미징 포인트를 추가합니다. 이 작업은 Position 하위 탭에서 수동으로 수행하거나 Position Setup 탭을 사용하여 임의로 수행하고 Setup by Carrier를 선택할 수 있습니다. 동일한 염색의 모든 웰에 대해 반복하십시오.
- 자동화 중에 최적의 초점 조정 및 Z 스택 위치를 지정하려면 초점 전략(Focus Strategy ) 탭으로 이동하여 타일 설정에서 정의한 초점 표면/Z 값 사용(Use Focus Surface/Z values Defined by Tiles Setup)을 선택합니다. 다른 방법은 다른 포커스 전략을 사용할 수 있지만 가장 일관된 결과를 얻으려면 이 설정을 사용하는 것이 좋습니다.
- 타일(Tiles) 탭에서 위치 확인(Verify Positions)을 클릭하고 각 위치에 대한 중앙 Z 평면을 수동으로 설정합니다. 옵션 하위 탭의 설정은 이미지 획득 순서를 지정하므로 이미지를 시작하기 전에 이를 확인하십시오. 위치가 선택된 순서대로 이미지를 가져오려면 타일 영역/위치 및 캐리어 웰/컨테이너 확인란을 선택 취소합니다. 이미지 처리를 용이하게 하기 위해 장면을 개별 파일로 분할을 선택합니다.
- Z-스택 탭이 중앙으로 설정되어 있고, 사용자의 기본 설정에 따라 범위가 입력되고, 최적 버튼이 선택되어 슬라이스 간격을 설정했는지 확인합니다.
- 획득 모드, 채널, 포커스 전략, Z-스택 및 타일 탭을 최적화한 후 실험을 시작합니다.
- 이미지 처리
- 배치 이미지 처리 방법을 사용하여 Extended Depth of Focus 방법으로 각 Z 스택의 최대 투영을 만듭니다.
- 일괄 처리 이미지 처리 방법을 사용하여 최대 투영 파일을 16비트 TIFF 이미지로 내보냅니다. 압축을 없음 으로 설정하고 원본 데이터가 선택되어 있는지 확인합니다. 결과 이미지는 지질 마커가 발현되는 형광 채널만의 최대 프로젝션 그레이스케일 TIFF여야 합니다.
7. 세분화 및 정량화
참고: LipidUNet 프로그램은 96웰 플레이트의 40x 이미지에 대해 훈련되었습니다. 40x 대물렌즈를 사용하여 얻은 이미지를 사용하는 것이 좋습니다.
- LipidUNet 소프트웨어를 설치합니다. LipidUNet은 다음 GitHub 리포지토리에서 다운로드할 수 있습니다 https://github.com/RPEGoogleMap/LipidUNet
- Nile Red, Bodipy 또는 APOE를 나타내는 TIFF 이미지를 식별하고 사용 중인 방법에 따라 Nile_Red, Bodipy 또는 APOE라는 디렉토리 내의 imgs라는 폴더로 이동합니다.
참고: LipidUNet 프로그램이 디렉토리를 인식하려면 정확한 명명 규칙을 사용해야 합니다. - LipidUNet 소프트웨어를 엽니다(그림 4).
- 소프트웨어의 예측 탭에서 줄임표를 클릭하고 명명된 디렉터리로 이동하여 관련 디렉터리(Nile_Red, Bodipy 또는 APOE)를 선택합니다. Class 항목을 확인하여 LipidUNet 프로그램이 이미지를 올바르게 식별했는지 확인합니다.
- 알고리즘에 대한 확률 임계값을 0.01과 0.99 사이에서 선택합니다. 값이 높을수록 더 많은 거짓 긍정이 제거되지만 더 많은 거짓 부정이 발생할 수 있으며, 값이 낮을수록 더 많은 거짓 부정이 제거되면서 더 많은 거짓 긍정이 발생할 수 있습니다. 기본값은 0.65이며 권장됩니다.
- 예측을 클릭합니다.
참고: 소프트웨어는 모든 이미지를 자동으로 반복하고 선택한 디렉토리에 predicted_masks라는 새 폴더를 만듭니다. - 마스크 분석 도구를 사용하여 생성된 마스크를 반복하고 마스크 이미지에서 임계값이 지정된 지질 침전물의 정량적 개수를 제공합니다.
- 생성된 카운트 데이터를 분석하여 치료 조건을 비교합니다.
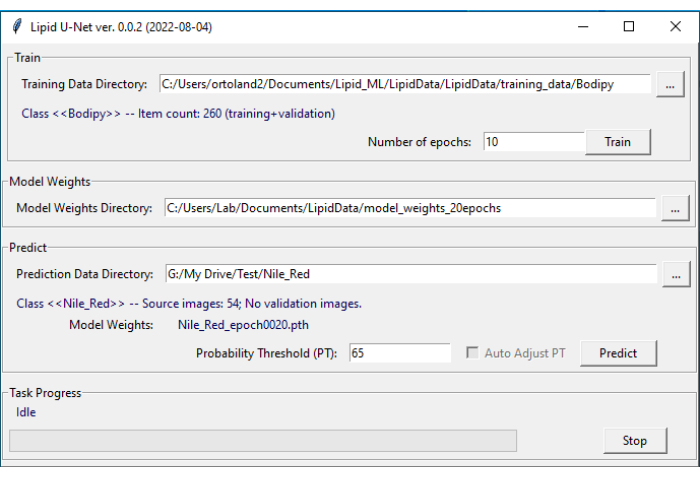
그림 4: LipidUNet 사용자 인터페이스. LipidUNet 소프트웨어에는 지질 침전물 이미지가 올바르게 식별된 훈련 데이터 디렉토리에 대해 선택할 수 있는 다양한 섹션이 있습니다. 학습 데이터에서 생성된 모델 가중치 디렉터리; 사용자가 세분화를 위해 이미지를 입력하는 예측 데이터 디렉터리입니다. 이 그림의 더 큰 버전을 보려면 여기를 클릭하십시오.
결과
이 프로토콜은 나일 레드, BODIPY 및 APOE로 염색된 지질 침전물을 식별하는 워크플로우를 제공합니다. 개발된 소프트웨어는 지질 침전물을 자동으로 식별하고 정량화할 수 있으며 요약된 프로토콜이 최적화될 때 최상의 성능을 발휘합니다. 셀 모델의 품질이 적절한 이미지 분할의 품질에 큰 영향을 미치기 때문에 성공적으로 차별화된 RPE(그림 3A)와 제대로 분화되지 않은 RPE(그림 3B)의 예가 포함됩니다.
프로토콜에 설명된 세 가지 마커 중 두 가지인 Nile Red와 BODIPY는 형광 이미지에서 뚜렷하게 밝은 작은 원형 점으로 식별됩니다(그림 5 및 그림 6). 프로토콜의 "긍정적인" 이미지는 이러한 별개의 퇴적물의 적절한 식별이 될 것입니다(그림 5A-D 및 그림 5E-H). "부정적인" 결과는 약한 염색(그림 6A-C 및 그림 6D-F) 또는 높은 배경 강도(그림 6G-I)로 인해 배경 형광을 침전물로 착각하여 이미지의 잘못된 분할을 보여줍니다.
APOE 퇴적물은 다양한 크기와 모양을 가지고 있으며, 나일 레드와 BODIPY의 원형 퇴적물보다는 타원형 또는 불규칙하게 보입니다. 이러한 침전물은 또한 덜 점착적이며, 신호 강도는 샘플의 투과화의 변화로 인해 침전물 간에 다를 수 있습니다. 정확한 식별은 덜 포화된 퇴적물을 포함하여 각 퇴적물을 식별하지만(그림 5I-L), 잘못된 분할은 이러한 퇴적물을 포착하지 않습니다(그림 6J-L). 따라서 급격한 변화를 피하기 위해 염색 및 이미징 방법을 최적화하는 것이 중요합니다. 이를 수행하는 한 가지 방법은 면역염색을 하는 동안 샘플 투과화 단계에 주의를 기울이는 것입니다. 형광 신호를 최적화하기 위해 APOE에 대한 고정 및 면역염색 전에 세포를 용해할 수 있으며, 그 결과 APOE 침전물이 균일하게 포화되고 더 잘 분할됩니다.
또한 96 웰 플레이트 이외의 배양 플랫폼 상에서 성숙된 세포의 분할된 이미지도 제공된다. LipidUNet 소프트웨어는 트랜스웰에서 배양된 세포의 이미지에서 실행되었으며, 지질 침전물이 임계값이 되는 동안 트랜스웰 멤브레인의 기공도 임계값이 됩니다(그림 6M-O). 모양과 크기의 유사성으로 인해 현재 형태의 LipidUNet 소프트웨어는 지질 침전물과 트랜스웰 기공을 무차별적으로 마스킹합니다.
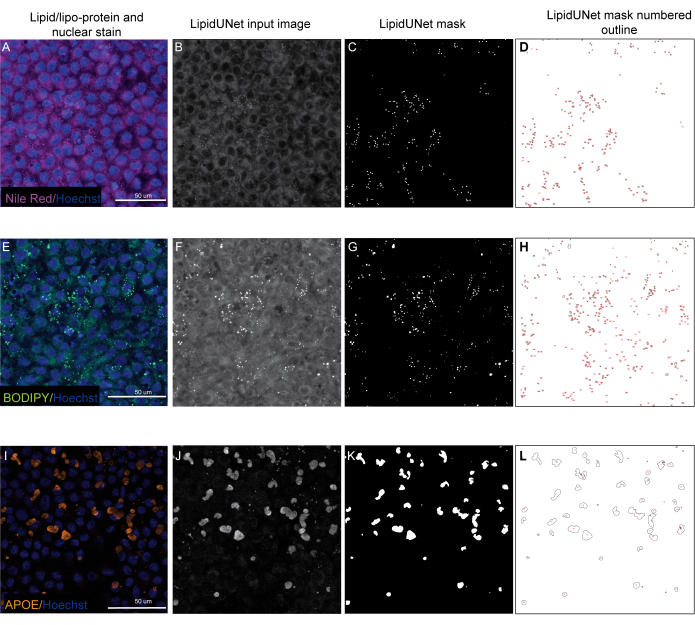
그림 5: 대표 결과. (A,E,I) 96웰 도금 RPE는 Hoechst 핵 염색(파란색)과 나일 레드(자홍색), BODIPY(녹색) 또는 APOE(주황색)로 염색되며 Z-스택의 최대 강도 투영입니다. (비, 에프, 제) 이미지 처리 후 LipidUNet 소프트웨어에 대한 그레이스케일 입력 이미지입니다. (씨, 지, 케이) 모든 침전물이 올바르게 식별되는 LipidUNet에 의해 생성된 마스크입니다. (D, H, L) 마스킹된 각 파티클의 윤곽선에는 번호가 매겨져 있습니다. 이 레이블을 사용하면 이미지의 각 입자를 원시 데이터가 있는 스프레드 히트의 항목에 연결할 수 있습니다. (A-D)는 나일 레드 염색을 보여주며, 소프트웨어는 약한 신호에도 불구하고 배경에 대한 침전물을 정확하게 인식할 수 있습니다. (EH)는 BODIPY 신호와 배경 사이에 강한 대비를 보여 이상적입니다. LipidUNet은 이미지의 모든 침전물을 정확하게 식별합니다. (I-L)은 강한 APOE 신호를 나타내며 이 염색에서 종종 볼 수 있는 신호 포화의 가변성을 나타냅니다. 그럼에도 불구하고 이미지 분할은 각 APOE 퇴적물의 경계를 식별할 수 있습니다. 이 그림의 더 큰 버전을 보려면 여기를 클릭하십시오.
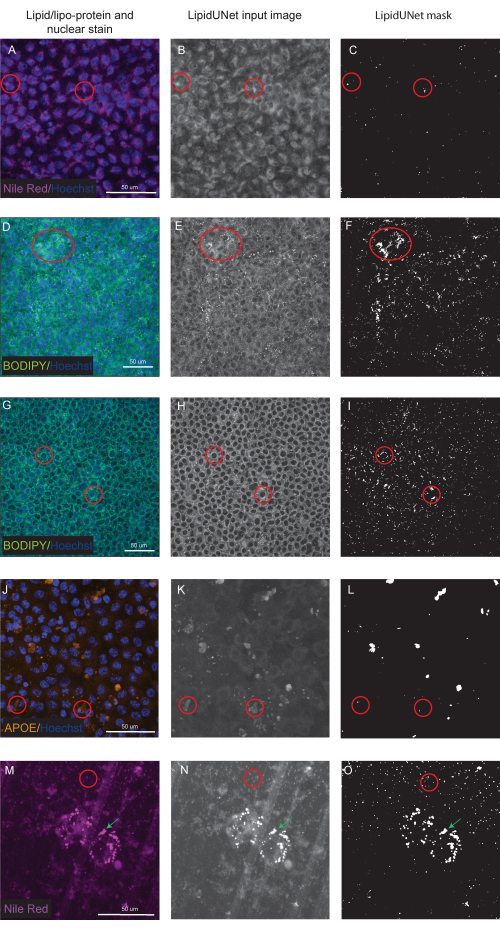
그림 6: 최적이 아닌 결과. (A,D,G,J,M) 96웰 도금 RPE는 Hoechst 핵 염색(파란색)과 나일 레드(자홍색), BODIPY(녹색) 또는 APOE(주황색)로 염색되며 Z-스택의 최대 강도 투영입니다. (비, E, H, K, N) 이미지 처리 후 LipidUNet 소프트웨어에 대한 그레이스케일 입력 이미지입니다. (씨, 에프, 나, 리, 오) LipidUNet에 의해 생성된 잘못된 마스크입니다. 빨간색 원은 소프트웨어가 지질 침전물을 잘못 식별한 위치를 나타냅니다. (ᄀ씨) Nile Red 처리는 소프트웨어가 배경 염색을 침전물로 식별했기 때문에 올바르지 않습니다. 이것은 배경이 높지만 이미지에 지질 침전물이 거의 없을 때 더 자주 발생할 수 있습니다. BODIPY 염색의 두 가지 예가 표시됩니다: (D-F) 약한 BODIPY 염색으로 인한 저품질 이미지 및 (G - I) 높은 배경의 강한 BODIPY 신호. 두 경우 모두 소프트웨어는 핵을 둘러싼 배경 원형 고리와 작은 원형 지질 침전물을 구별할 수 없습니다. 이러한 오류를 방지하기 위해 염색 및 이미징을 최적화해야 하지만 최신 버전의 LipidUNet은 이러한 이미지에 대해 크게 개선되었습니다. (J-L) APOE 세그멘테이션이 잘못되었습니다. 침전물은 신호의 크기와 포화도가 더 다양하기 때문에 소프트웨어는 일부 침전물을 인식하는 데 어려움이 있습니다. (모) RPE는 트랜스웰에 씨를 뿌리고 나일 레드로 염색했습니다. Z 스택의 한 조각은 나일 레드 지질 침전물과 트랜스웰 기공과 함께 여기에 표시됩니다. 소프트웨어는 트랜스웰 기공을 포함하는 빨간색 원과 나일강 적색 퇴적물을 가리키는 녹색 화살표로 표시된 것처럼 둘을 구별할 수 없습니다. 이 그림의 더 큰 버전을 보려면 여기를 클릭하십시오.
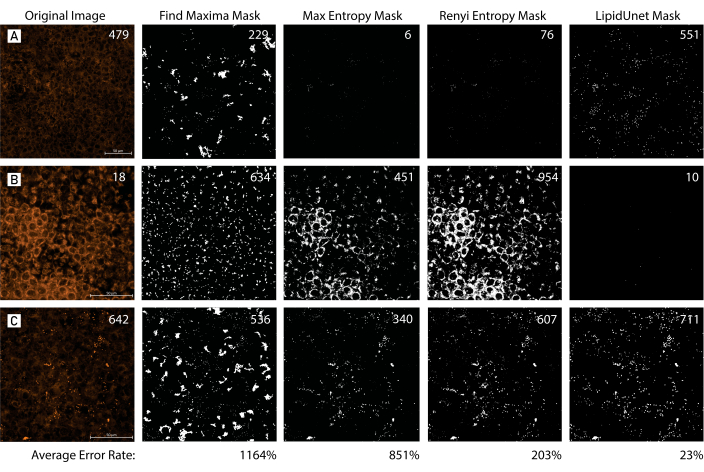
그림 7: 마스크 도구 비교. (A,B,C) 다양한 양의 지질 침착이 있는 96웰 도금 RPE는 나일 레드(빨간색)로 식별됩니다. 이미지는 세 가지 일반적인 마스킹 방법인 Find Maxima, Max Entropy 및 Renyi Entropy를 사용하여 마스킹되고 LipidUNet 생성 마스크와 비교됩니다. 원본 이미지에는 지질 침전물의 수동 카운트가 수반되는 반면, 마스크는 각 분할 방법에 따라 예측된 카운트를 표시합니다. 평균 오류율은 다음 공식을 사용하여 각 분할 방법에 대해 계산되었습니다: mean[(|예측 카운트 - 수동 카운트|/수동 카운트) x 100]. LipidUNet 생성 마스크는 다른 마스킹 방법과 비교할 때 가변 증착을 사용하여 이미지에서 지질 침전물을 보다 정확하게 식별합니다(평균 오류율: 23% LipidUnet, 1164% Find Maxima, 851% Max Entropy, 203% Renyi Entropy). 이 그림의 더 큰 버전을 보려면 여기를 클릭하십시오.
| 구성 요소 | 고양이 번호 | 주식 Conc. | 최종 결론. | mL |
| MEM 알파 | 12571-063 | 해당 없음 | 500 | |
| N2 보충제 | 17502-048 | 해당 없음 | 1% | 5 |
| 열 비활성화 FBS | SH30071.03 | 해당 없음 | 5% | 25 |
| NMEM NEAA | 11140-050 | 10m엠 | 0.01 밀리엠 | 5 |
| 소듐 피루브산 | 11360-070 | 100mM | 1mM | 5 |
| 페니실린-스트렙토마이신 | 15140-122 | 10000u/mL | 100U/mL | 5 |
| 황소자리 | T4571 시리즈 | 50mg/mL | 250ug/mL | 2.5 |
| 하이드로코르티손 | H6909 시리즈 | 18.1mg/리터 | 20ug/리터 | 0.553 |
| T3 | T5516 시리즈 | 20ug/리터 | 0.013ug/L | 0.33 |
| 총 부피, mL | 548.383 | |||
표 1: RPE-MM 시약 조성. RPE-MM에 대한 시약 및 최적 농도 목록.
토론
이 프로토콜은 퇴행성 안구 질환에 대한 단일 유전자 및 다유전자 체외 질환 모델에서 지질 침착물을 효율적으로 라벨링, 이미지 및 정량화하는 방법을 제공합니다. AI 기반 소프트웨어인 LipidUNet은 세 가지 일반적인 지질 마커인 APOE, Nile Red 및 BODIPY에 적용할 수 있으며, 정량화를 표준화하고 편향되지 않은 빠른 자동 분석 방법을 제공합니다.
LipidUNet의 주요 한계는 AI에 대한 훈련 데이터 세트가 96웰 플레이트에서 배양된 세포의 40배 배율 이미지로 제한되었다는 사실입니다. 훈련 이미지 세트의 결과로, 현재 형태의 LipidUNet은 40x 배율 이미지 분석으로 제한됩니다. 이 소프트웨어는 96웰 플레이트 이외의 다른 배양 표면에서 배양된 세포의 40x 이미지를 분석하는 데 사용할 수 있지만, 소프트웨어에 의한 정확한 임계값을 확인하기 위해 생성된 출력 마스크를 검사하는 데 주의를 기울여야 합니다. 분석할 수 있는 샘플/이미지의 범위를 확장하려면 더 많은 이미지 세트(다른 배율)가 필요합니다.
프로토콜에는 몇 가지 중요한 단계가 있습니다. 지질 마커 단계에서 사용자는 선택한 라벨링 컴파운드(BODIPY, APOE, Nile Red)가 샘플을 효과적으로 라벨링했는지 확인해야 합니다. 성숙한 RPE 세포는 종종 심하게 착색되어 항체 면역염색의 형광 신호를 손상시킬 수 있습니다. 형광 신호가 약하거나 배경 염색이 너무 많으면 LipidUNet은 지질 방울을 정확하게 식별할 수 없습니다. 유사한 이유로, 프로토콜의 자동 이미징 단계를 위해 적절하게 선택된 획득 설정이 사용되어야 한다. 획득한 이미지의 품질이 좋지 않으면 LipidUNet이 이미지를 적절하게 마스킹하는 데 어려움을 겪을 수 있으므로 정량화가 부정확합니다(그림 6A-L). 마지막으로, LipidUNet은 소프트웨어가 작동하기 위한 특정 요구 사항을 가지고 있기 때문에 이미지의 후처리는 중요한 단계입니다.
수동 임계값 지정을 사용하는 지질 분석 워크플로우 또는 Fiji와 같은 소프트웨어에서 자동 임계값 설정을 포함하는 기술과 비교할 때, LipidUNet은 지질 입자 식별 시 작은 오류율로 반영되는 가변 지질 증착을 사용하여 이미지 전반에 걸쳐 편향되지 않고 신뢰할 수 있는 분할을 제공합니다(그림 7). 이 소프트웨어를 사용하면 사용자가 추가 훈련 이미지를 입력할 수 있으므로 프로토콜에 설명된 대로 40배 배율 대물렌즈를 사용하는 이미지 세트 또는 다른 지질 마커를 사용하는 이미지 세트를 넘어 분석할 수 있습니다. 앞으로 이 소프트웨어는 지질 침전물의 정량화가 가능하도록 3D 이미지를 분석하도록 훈련될 것입니다. 병리학의 주요 원인으로 지질 침착을 수반하는 퇴행성 안질환이 만연하고 있으며, 노인 인구가 증가함에 따라 사례가 증가할 것으로 예상된다13. 이 프로토콜에 설명된 대로 정확한 질병 모델과 효율적인 분석 도구를 사용하면 새로운 치료 개입을 개발할 수 있습니다.
공개
공개가 없습니다.
감사의 말
Zeiss 컨포칼 시스템을 사용해 주신 NEI(National Eye Institute) 조직학 핵심에 감사드립니다. 이 작업은 NEI IRP 기금(보조금 번호 ZIA EY000533-04)의 지원을 받았습니다.
자료
| Name | Company | Catalog Number | Comments |
| 0.22 µm Steriflip filter system | EMD Millipore | SCGP00525 | |
| 1x Dulbecco's Phosphate Buffered Saline | Gibco | 14190-144 | |
| 3,3',5-Triiodo-L-thyronine | Sigma | T5516 | |
| Albumin Bovine, Fraction V | MP Biomedical | 160069 | |
| Alexa Fluor 555 rabbit anti-goat IgG (H+L) | Invitrogen | A21431 | APOE secondary antibody |
| APOE primary antibody | Millipore Sigma | AB947 | |
| BODIPY 493/503 | Invitrogen | D3922 | Protect from light |
| Complement competent human serum | Millipore Sigma | S1-LITER | |
| CTS N2 Supplement | Life Technologies | A13707-01 | |
| Fetal Bovine Serum | Hyclone | SH30071.03 | |
| Fluoromount-G | SouthernBiotech | 0100-01 | Slide mounting media |
| Glass Cover Slips #1 1/2 22 mm x 22 mm | Electron Microscopy Sciences | 72204-01 | |
| Glass Microscope Slide 25 mm x 75 mm- 1.2 mm Thick | Electron Microscopy Sciences | 71870-01 | |
| Hydrocortisone | Sigma | H0396 | |
| MEM Alpha | Life Technologies | 12571-063 | |
| MEM non-essential Amino Acids | Life Technologies | 11140 | |
| Nile Red | Sigma | 72485-100MG | Protect from light |
| Paraformaldehyde 16% Solution, EM Grade | Electron Microscopy Sciences | 15710 | |
| Penicillin-Strep | Life Technologies | 15140-148 | |
| Phosphate Buffered Saline 10x | Gibco | 70011-044 | |
| Rod Outer Segments (OS) | InVision Bioresources | 98740 | |
| Sodium bicarbonate | Sigma Aldrich | S5761 | |
| Sodium Pyruvate | Life Technologies | 11360-070 | |
| Sucrose | Sigma Aldrich | S1888 | |
| SYBR Green Master Mix | Bio-Rad | 1725274 | |
| Taurine | Sigma | T0625 | |
| Triton X-100 | Sigma | 9002-93-1 | |
| Tween 20 Ultrapure | Affymetrix | 9005-64-5 | |
| Vitronectin | Life Technologies | A14701SA | |
| Y-27632 dihydrochloride | R&D Systems | 1254 |
참고문헌
- Kanow, M. A., et al. Biochemical adaptations of the retina and retinal pigment epithelium support a metabolic ecosystem in the vertebrate eye. eLife. 6, e28899(2017).
- Adijanto, J., et al. The retinal pigment epithelium utilizes fatty acids for ketogenesis. The Journal of Biological Chemistry. 289 (30), 20570-20582 (2014).
- Farnoodian, M., et al. Cell-autonomous lipid-handling defects in Stargardt iPSC-derived retinal pigment epithelium cells. Stem Cell Reports. 17 (11), 2438-2450 (2022).
- Curcio, C. A. Soft drusen in age-related macular degeneration: Biology and targeting via the oil spill strategies. Investigative Ophthalmology & Visual Science. 59 (4), AMD160-AMD181 (2018).
- Cankova, Z., Huang, J. D., Kruth, H. S., Johnson, M. Passage of low-density lipoproteins through Bruch's membrane and choroid. Experimental Eye Research. 93 (6), 947-955 (2011).
- Curcio, C. A., et al. Esterified and unesterified cholesterol in drusen and basal deposits of eyes with age-related maculopathy. Experimental Eye Research. 81 (6), 731-741 (2005).
- Miyagishima, K. J., et al. AMPK modulation ameliorates dominant disease phenotypes of CTRP5 variant in retinal degeneration. Communications Biology. 4 (1), 1360(2021).
- Sharma, R., et al. Epithelial phenotype restoring drugs suppress macular degeneration phenotypes in an iPSC model. Nature Communications. 12 (1), 7293(2021).
- Farnoodian, M., et al. Cell-autonomous lipid-handling defects in Stargardt iPSC-derived retinal pigment epithelium cells. Stem Cell Reports. 17 (11), 2438-2450 (2022).
- Hallam, D., et al. An induced pluripotent stem cell patient specific model of complement factor H (Y402H) polymorphism displays characteristic features of age-related macular degeneration and indicates a beneficial role for UV light exposure. Stem Cells (Dayton, Ohio). 35 (11), 2305-2320 (2017).
- Sharma, R., Bose, D., Montford, J., Ortolan, D., Bharti, K. Triphasic developmentally guided protocol to generate retinal pigment epithelium from induced pluripotent stem cells. STAR Protocols. 3 (3), 101582(2022).
- Issa, P. C., Barnard, A. R., Herrmann, P., Washington, I., MacLaren, R. E. Rescue of the Stargardt phenotype in Abca4 knockout mice through inhibition of vitamin A dimerization. Proceedings of the National Academy of Sciences of the United States of America. 112 (27), 8415-8420 (2015).
- GBD 2019 Blindness and Vision Impairment Collaborators. Blindness and Vision Impairment Collaborators. Causes of blindness and vision impairment in 2020 and trends over 30 years, and prevalence of avoidable blindness in relation to VISION 2020: the Right to Sight: an analysis for the Global Burden of Disease Study. Lancet Global Health. 9 (2), e144-e160 (2021).
재인쇄 및 허가
JoVE'article의 텍스트 или 그림을 다시 사용하시려면 허가 살펴보기
허가 살펴보기더 많은 기사 탐색
This article has been published
Video Coming Soon
Copyright © 2025 MyJoVE Corporation. 판권 소유