
Aby wyświetlić tę treść, wymagana jest subskrypcja JoVE. Zaloguj się lub rozpocznij bezpłatny okres próbny.
Method Article
Tools for the Real-Time Assessment of a Pseudomonas aeruginosa Infection Model
W tym Artykule
Podsumowanie
Synthetic cystic fibrosis sputum medium (SCFM2) can be utilized in combination with both confocal laser scanning microscopy and fluorescence-activated cell sorting to observe bacterial aggregates at high resolution. This paper details methods to assess aggregate populations during antimicrobial treatment as a platform for future studies.
Streszczenie
Pseudomonas aeruginosa (Pa) is one of the most common opportunistic pathogens associated with cystic fibrosis (CF). Once Pa colonization is established, a large proportion of the infecting bacteria form biofilms within airway sputum. Pa biofilms isolated from CF sputum have been shown to grow in small, dense aggregates of ~10-1,000 cells that are spatially organized and exhibit clinically relevant phenotypes such as antimicrobial tolerance. One of the biggest challenges to studying how Pa aggregates respond to the changing sputum environment is the lack of nutritionally relevant and robust systems that promote aggregate formation. Using a synthetic CF sputum medium (SCFM2), the life history of Pa aggregates can be observed using confocal laser scanning microscopy (CLSM) and image analysis at the resolution of a single cell. This in vitro system allows the observation of thousands of aggregates of varying size in real time, three dimensions, and at the micron scale. At the individual and population levels, having the ability to group aggregates by phenotype and position facilitates the observation of aggregates at different developmental stages and their response to changes in the microenvironment, such as antibiotic treatment, to be differentiated with precision.
Wprowadzenie
Pseudomonas aeruginosa (Pa) is an opportunistic pathogen that establishes chronic infections in immune-compromised individuals. For those with the genetic disease cystic fibrosis (CF), these infections can span the course of a lifetime. CF causes the buildup of a viscous, nutrient-rich sputum in the airways, which becomes colonized by a variety of microbial pathogens over time. Pa is one of the most prevalent CF pathogens, colonizing the airways in early childhood and establishing difficult-to-treat infections1. Pa remains a significant clinical problem and is considered a leading cause of mortality in those with CF, despite improved therapy regimens in recent years2,3. This persistence phenotype and increasing antibiotic tolerance have earned Pa a place in a group of pathogens identified by both the Centers for Disease Control (CDC) and the World Health Organization (WHO) as research priorities for the development of new therapeutic strategies-the ESKAPE pathogens4.
Like other ESKAPE pathogens, acquired antibiotic resistance is common in Pa, but there are also many intrinsic properties that contribute to Pa antimicrobial tolerance. Among these is the ability of Pa to form aggregates-highly dense clusters of ~10-1,000 cells, which can be observed in multiple infections, including CF patient sputum5,6. Similar to Pa studied in other biofilm systems, Pa aggregates display clinically relevant phenotypes such as increased resistance to antibiotics and activation of cell-cell communication (quorum sensing (QS)). For example, aggregates of Pa have been shown to use QS-regulated behaviors to combat other microbes as well as tolerate antimicrobial treatments such as the production of pyocyanin7. The ability to study such behaviors offers an exciting insight into bacterial ecosystems in an environment similar to the one in which they exist in the human body.
One of the biggest challenges to studying how Pa aggregates respond to the changing sputum environment is the lack of nutritionally relevant and robust systems that promote aggregate formation. Much of what is known about Pa has been discovered using in vitro systems in which cells grow planktonically or in a characteristic surface-attached, "mushroom" architecture that has not been observed in vivo8. While classical biofilm growth models, such as flow cells or solid agar, have yielded extensive and valuable knowledge about bacterial behaviors and mechanisms of antibiotic tolerance, these findings do not always translate in vivo. Many in vitro models have a limited ability to mimic the growth environment of the human infection site, necessitating costly in vivo studies. In turn, many in vivo models lack the flexibility and resolution afforded by in vitro techniques.
Synthetic cystic fibrosis sputum (SCFM2) is designed to provide an environment for Pa growth similar to that experienced during chronic infection in the CF lung. SCFM2 includes nutritional sources identified in expectorated CF sputa in addition to mucin, lipids, and DNA. Pa growth in SCFM2 requires a near identical gene set to that required for growth in actual sputum and supports natural Pa aggregate formation9,10. After inoculation, planktonic cells form aggregates that increase in size through expansion. Individual cells (referred to as migrants) are released from aggregates, migrate to uncolonized areas, and form new aggregates10. This life history can be observed using CLSM and image analysis at the resolution of a single cell. Aggregates of Pa formed in SCFM2 are of similar sizes to those observed in the CF lung10. This model allows the observation of multiple aggregates of varying size in real-time and in three dimensions at the micron scale. Time-lapse microscopy allows the tracking of thousands (~50,000) of aggregates in one experiment. The use of image analysis software allows the quantification of aggregate phenotypes from micrographs, including aggregate volume, surface area, and position in three dimensions to the nearest 0.1 μm, both at the individual aggregate and population levels. Having the ability to group aggregates by phenotype and position allows the differentiation of aggregates at different developmental stages with precision, as well as their response to a changing microenvironment6,11.
The application of SCFM2 to study Pa aggregates in low volume and high-throughput assays make it a flexible, cost-effective model. As a defined medium, SCFM2 offers uniformity and reproducibility across multiple platforms, providing a nutritionally and physically relevant method to study Pa aggregates in vitro9. Applications include its use in combination with CLSM to observe spatial organization and antibiotic tolerance at high resolution (as described in this methods paper). The ability to perform experiments that provide real-time, micron-scale data allows the study of intra-species and inter-species interactions as they may occur in vivo. For example, SCFM2 has previously been used to study the spatial dynamics of cell-cell communication in aggregate populations via a network of systems utilized by Pa to regulate multiple genes that contribute to virulence and pathogenesis6.

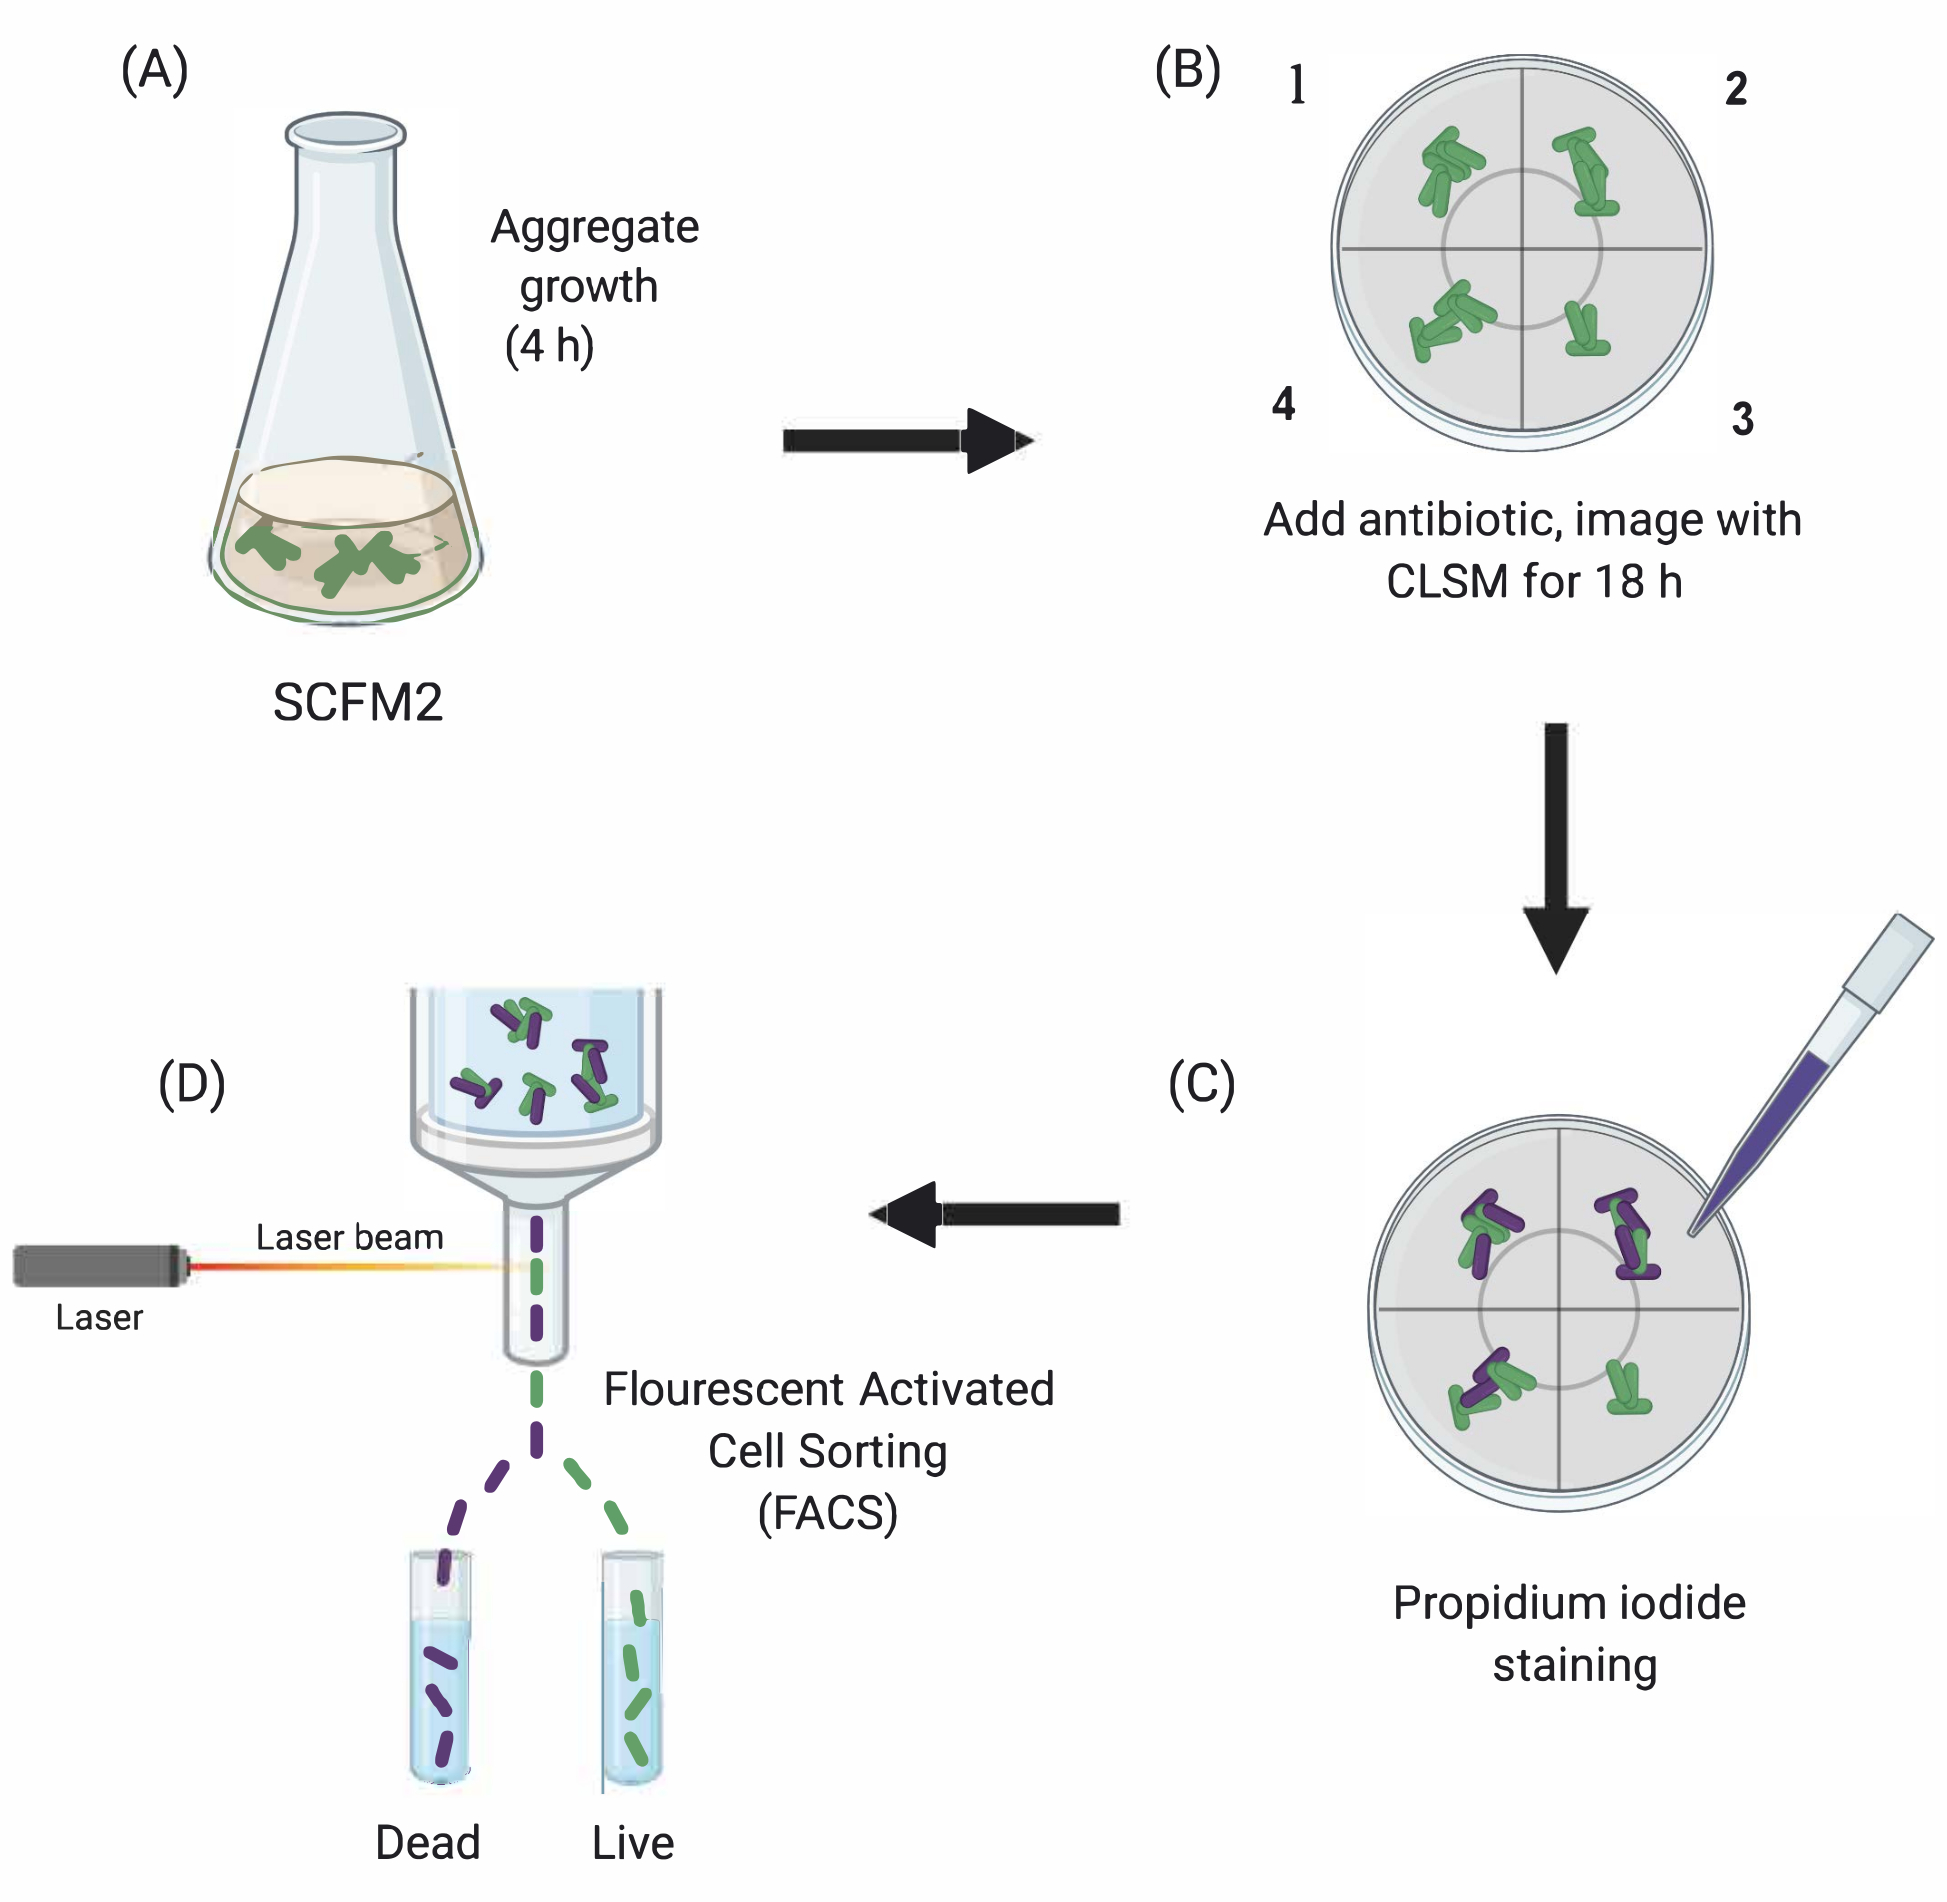
Figure 1: Graphical depiction of the main experimental steps. (A) SCFM2 is inoculated with Pa cells and allowed to form aggregates in a glass-bottomed culture dish. (B) Aggregates are transferred to the confocal microscope, and antibiotic is added. Depicted are three technical replicates (chambers 1-3) and a control well (4) of inoculated SCFM2 without antibiotic treatment. Aggregates are imaged using CLSM over the course of 18 h. (C) After the initial 18-h imaging, aggregates are treated with propidium iodide to visualize dead cells and imaged using CLSM (D) Aggregates with desired phenotype are separated from SCFM2 using FACS. Abbreviations: SCFM2 = synthetic cystic fibrosis sputum medium; Pa = Pseudomonas aeruginosa; CLSM = confocal laser scanning microscopy; FACS = fluorescence-activated cell sorting. Please click here to view a larger version of this figure.
Here, the utility of SCFM2 to study the impact of antibiotic treatment on Pa aggregates in real time is demonstrated, followed by the use of a cell-sorting approach to isolate populations of aggregates with distinct phenotypes for downstream analysis (Figure 1).
Access restricted. Please log in or start a trial to view this content.
Protokół
1. Prepare synthetic cystic fibrosis medium (SCFM2)
NOTE: Preparation of SCFM2 comprises three main stages outlined below (Figure 2). For full details and references, see9,10,12.

Figure 2: Preparation and inoculation of SCFM2 medium. (A) Buffered base is prepared using salts and amino acids listed in Table 1 and Table 2. Buffered base can be stored at 4 °C for up to 30 days, but must be protected from light exposure. (B) Mucin and DNA are added to an aliquot of buffered base and dissolved into solution overnight at 4 °C. (C) Lipid and additional stocks are added to the overnight solution and incubated at 37 °C with agitation at 250 rpm for 20 min. SFCM2 is then inoculated with washed, log phase cells at an OD600 = 0.05. Abbreviations: SCFM2 = synthetic cystic fibrosis sputum medium. Please click here to view a larger version of this figure.
- Sterilization of porcine mucin
- Prepare sterile mucin at a final concentration of 5 mg/mL in SCFM2. For example, for a 5 mL volume of SCFM2, weigh 25 mg of Type II mucin in a sterile Petri dish, and place into an ultraviolet (UV) sterilizer for 4 h, gently agitating every hour.
- After 4 h, transfer the UV-treated mucin into autoclaved 1.7 mL tubes under sterile conditions, and store at -20 °C.
- To confirm complete sterilization, dissolve a sample of mucin in a sterile liquid, such as water or Luria Bertani (LB) broth, and observe under a microscope.
NOTE: Sterilized mucin can be stored at -20 °C for up to 6 months.
- Preparation of buffered base
- Prepare salt and amino acid stock solutions by adding the appropriate amounts by weight to deionized water as listed in Table 1. Filter-sterilize all stock solutions using a 0.22 μm filter, wrap in foil to protect from light degradation, and store at 4 °C for up to one month.
- Prepare buffered base by combining 190 mL of deionized water with amino acid and salt stock solutions by volumes listed in Table 1. Adjust the solution to pH 6.8, and increase to a final volume of 250 mL. Filter-sterilize using a 0.22 μm filter, and store at 4 °C for up to 30 days.
- On the evening before the experiment, aliquot the desired amount of buffered base into a glass culture flask, and add mucin (5 mg/mL as described in step 1.1.1) and purified salmon sperm DNA (0.6 mg/mL). Agitate gently, wrap in foil, and leave at 4 °C overnight to allow mucin and DNA to dissolve into solution.
NOTE: Salmon sperm DNA aliquots should be thawed on ice, vortexed, and added to buffered base and mucin. Tryptophan, asparagine, and tyrosine stock solutions must be prepared in solutions of NaOH (see Table 1 for concentrations) instead of deionized water. Keep buffered base and all stock solutions wrapped in foil to protect from light exposure. Most stocks will be stable for up to a month. Stocks that become discolored should not be used and should be replaced before use.
- Addition of supplemental stocks
- On the day of the experiment, add the stocks listed in Table 2 to the buffered base containing mucin and DNA.
NOTE: Prepare a fresh FeSO4 solution on the day of the experiment, but all other stocks can be made ahead of time and stored for 30 days at 4 °C. 1,2-Dioleoyl-sn-glycero-3-phosphocholine (DOPC) contains chloroform. Handle with caution, and do not use near open flames. After the addition of DOPC, incubate SCFM2 at 37 °C with shaking (250 rpm) for at least 20 min (for 5 mL culture). This incubation period allows the chloroform in the DOPC to evaporate. The flask should not be airtight; instead, cover the flask opening loosely with foil.
- On the day of the experiment, add the stocks listed in Table 2 to the buffered base containing mucin and DNA.
2. Real time assessment of antimicrobial tolerance in bacterial aggregates
- Prepare overnight cultures
- On the evening before the experiment, inoculate 5 mL of LB broth with several colonies of Pa PAO1-pMRP9-113 from an LB agar plate containing antibiotic (carbenicillin 300 μg/mL). Grow overnight at 37 °C with agitation at 250 rpm.
NOTE: Grow overnight cultures with the addition of antibiotics required for the selection of required plasmids (here, the green fluorescent protein (GFP) expression plasmid, pMRP9-1). Note that Pa cells are to be washed before SCFM2 is inoculated. LB may be substituted for other rich laboratory media for overnight cultures. All bacterial isolates should be handled using appropriate BSL-2 guidelines throughout this protocol.
- On the evening before the experiment, inoculate 5 mL of LB broth with several colonies of Pa PAO1-pMRP9-113 from an LB agar plate containing antibiotic (carbenicillin 300 μg/mL). Grow overnight at 37 °C with agitation at 250 rpm.
- Inoculate SCFM2
- On the day of the experiment, back-dilute overnight cultures of Pa 1:10 (culture: liquid media) by inoculating 500 μL into 5 mL of fresh LB broth. Grow cells until log phase (60-90 min) at 37 °C with agitation at 250 rpm.
- Centrifuge log phase cultures at 10,000 × g for 5 min. Wash the cells by removing the supernatant and resuspending in 3 mL of filter-sterilized phosphate-buffered saline (PBS, pH 7.0). Repeat twice, and resuspend the pellet in a final volume of 1 mL of PBS.
- Measure the absorbance of the washed cells using a spectrophotometer at 600 nm (OD600), and calculate the volume of culture required for a starting OD600 of 0.05 in 5 mL of SCFM2. Inoculate Pa into the SCFM2, and vortex gently to distribute cells throughout. Pipette 1 mL of the inoculated SCFM2 into each chamber of a 4-well, glass bottom, optical dish, and incubate for 4 h statically at 37 °C.
NOTE: The doubling time of Pa cultures is dependent on the strain and the availability of oxygen. In SCFM2, under the conditions described here, the doubling time of Pa is ~1.4 h10.
3. Visualizing aggregates during antibiotic treatment with confocal laser scanning microscopy (CLSM)
NOTE: This section describes the use of confocal laser scanning microscope and image capture software for the imaging of Pa aggregates in SCFM2. The goal is to observe and characterize the remaining (tolerant) bacterial biomass after treatment with antibiotics. The steps outlined can be performed with success on other confocal microscopes, although the instrument operating manual should be referenced for specific guidance.
- Image Pa cultures using either a heated chamber or a heated microplate fitted on the microscope stage to maintain an ambient temperature of 37 °C. Start the Incubation module at least 2 h prior to the beginning of the experiment to allow all apparatus to reach the desired temperature, and reduce further expansion and movement during data collection.
- After 4 h, transfer SCFM2 cultures containing Pa cells to the heated microscope stage. Designate 3 out of 4 wells as technical replicates for antibiotic treatment, and consider the 4th well as a no-treatment control, containing only Pa cells in SCFM2, without antibiotic. Identify aggregates using brightfield microscopy within the Locate tab prior to any excitation of fluorescent reporters. Define an area for imaging within each well, and store its position (x-y-z coordinates) using the Positions module in the imaging software.
- Use a 63x oil-immersion objective to visualize Pa cultures containing the GFP expression plasmid pMRP9-1 in SCFM2 with an excitation wavelength of 488 nm and emission wavelength of 509 nm. Take images using the z-stack option within the Acquisition module at 1 μm intervals (total of 60 slices). Use the Line-averaging module to reduce background fluorescence in the GFP channel within the total volume of the 60 μm z-stack images (1,093.5 mm3). Take control images of uninoculated SCFM2 by using identical settings to determine the background fluorescence for image analysis.
NOTE: Images are acquired by producing 512 pixels x 512 pixels (0.26 μm x 0.26 μm pixels) 8-bit z-stack images that are 60 μm from the base of the coverslip. - Use the time series option within the imaging software to capture 60 slices at each position (well) at 15-min intervals over a period of 18 h. Use the definite focus strategy within the software to store a focal plane for each position, which is returned to at each time point throughout the experiment.
- After a total 4.5 h of incubation, image each position using the above settings to determine the aggregate biomass within each of the four wells before the addition of antibiotic.
- After 6 h of total incubation, add antibiotic at 2x-below minimum inhibitory concentration (MIC) to each replicate. Pipette directly and gently into the middle of the well, just below the air-liquid interphase. Maintain all cultures in the heated confocal chamber.
NOTE: Here, colistin sulfate at a concentration of 140 μg/mL was used. - Begin imaging post-antibiotic treatment by clicking on the Start Experiment option within the imaging program.
NOTE: Antibiotic concentration used is dependent on the antibiotic, the Pa isolate, and whether the user would like to examine killing or tolerance effects. This experiment uses a single dose. Additional doses can be added without disrupting cultures if needed.
4. Propidium iodide staining of Pa aggregates
NOTE: Propidium iodide (PI) is commonly utilized as a staining reagent to identify non-viable (dead) bacterial cells in culture. Here, it is used to identify aggregates sensitive to antibiotic treatment applied in section 3. Throughout this protocol, the expression and detection of GFP in Pa cells is used as the main proxy for cell viability. This final step allows confocal imaging to be used once more to identify the spatial positioning of live/dead aggregates in relation to each other. Additionally, aggregates are identified as live/dead for further downstream cell sorting in section 5.
- After 18 h, add PI to each well of the four-chambered optical bottom dish containing SCFM2 cultures. Follow the manufacturer's instructions for the volume of PI and incubation time (e.g., ~2 μL per mL of culture, ~20-30 min).
5. Isolating live cells from aggregates using a FACS approach
NOTE: FACS presents a powerful platform to sort and isolate groups of cells according to a fluorescently tagged phenotype. Here, FACS is used to isolate live (antibiotic tolerant) aggregates from non-viable aggregates.
- After staining with propidium iodide, remove the cultures from incubation, and transfer to a FACS instrument in an insulated container to maintain 37 °C.
- Run 1 mL aliquots of SCFM2 containing Pa aggregates at the lowest flow rate.
NOTE: Each aliquot will contain ~15,000 aggregates. - To detect GFP, illuminate the cells with a 488 nm laser, and record the fluorescent signal height at 530/30 nm. Visualize the PI staining by excitation with a 561 nm laser, and record the fluorescent signal height at 610/20 nm. Perform sorting using a 70-u nozzle.
NOTE: Sorted aggregates can be pooled in multiple ways depending on the user's application. In this case, FACS was used to sort viable Pa aggregates for downstream RNA sequencing. Alternative applications are discussed below.
6. Image analysis
NOTE: Time-lapse microscopy generates large amounts of data. An 18-h experiment for the observation of Pa aggregates in SCFM2 identifies ~50,000 aggregates over time, which have the potential to be characterized for volume and spatial positioning. Use an image analysis software to quantify aggregate dynamics in SCFM2:
- For aggregate studies in SCFM2, quantify the background GFP fluorescence by creating a histogram of counts in the GFP channel that is produced for uninoculated SCFM2 and SCFM2 inoculated with Pa strain PAO1 carrying pMRP9-1. To ensure that detected GFP voxels correlate to Pa biomass, define a GFP+ voxel as ≥1.5x the GFP background count value.
NOTE: The background fluorescence is defined as the highest voxel value of three randomly chosen positions, averaged. Background counts are, as a standard measure, subtracted from all pixels in experimental images by the image analysis software. - After background subtraction in the Surpass module, produce isosurfaces for all remaining voxels.
- To detect individual aggregates, enable the Split Objects option, and define aggregates as objects with volumes of ≥5 μm3. Use the Vantage module in the image analysis software to calculate the volume, x-y-z, and sum of GFP voxels for each individual object. Export this data to an external statistical platform.
NOTE: Some image analysis software permit the export of multiple quantitative phentoypes at once, allowing for correlations to be calculated. - Filter data exported from the Vantage module by size to ensure that no objects of <0.5 µm3 (dispersed biomass) remain. For each individual object within the image, calculate the distance from itself in relation to other objects (aggregates) using the Vantage module of the image analysis software or manually with the following equation.
d = sqrt((x2− x1)2 + (y2− y1)2 + (z2− z1)2) (1) - Use SUM and AVERAGE calculations to find the total biomass and average aggregate volume. Alternatively, export data into other statistical platforms or scripts, e.g., the distribution of aggregates across biomass as discussed in the representative results (script unpublished in collaboration with the Whiteley laboratory, Georgia Institute of Technology).
Access restricted. Please log in or start a trial to view this content.
Wyniki
This work details methods to observe Pa aggregates at a high resolution and in an environment similar to that of chronic infection of the CF lung9,10,12. SCFM2 provides an in vitro system that promotes natural aggregation of Pa cells in sizes similar to those observed during actual infection10. The adaptability of SCFM2 as a defined medium can be leveraged to approach many resea...
Access restricted. Please log in or start a trial to view this content.
Dyskusje
This work has introduced methodologies that can be combined to study bacterial aggregate populations in the presence and absence of antibiotic treatment. High-resolution CLSM allows the visualization of changes in aggregate biomass and the structural orientation of aggregates over real time when exposed to antibiotics. In addition, physical and structural features of the biomass that remain after treatment with antibiotics can be quantified, with the goal to correlate these observations with future gene expression studie...
Access restricted. Please log in or start a trial to view this content.
Ujawnienia
The authors have no conflicts of interest.
Podziękowania
S.E.D is supported by start-up funds provided by the Department of Molecular Medicine, The University of South Florida, as well as a CFF research grant (DARCH19G0) the N.I.H (5R21AI147654 - 02 (PI, Chen)) and the USF Institute on Microbiomes. We thank the Whiteley lab for ongoing collaboration involving data sets related to this manuscript. We thank Dr. Charles Szekeres for facilitating FACS sorting. Figures were created by A.D.G and S.E.D using Biorender.com.
Access restricted. Please log in or start a trial to view this content.
Materiały
| Name | Company | Catalog Number | Comments |
| Amino acids | |||
| Alanine | Acros Organics | 56-41-7 | |
| Arginine HCl | MP | 1119-34-2 | |
| Asparagine | Acros Organics | 56-84-8 | Prepared in 0.5 M NaOH |
| Cystine HCl | Alfa Aesar | L06328 | |
| Glutamic acid HCl | Acros Organics | 138-15-8 | |
| Glycine | Acros Organics | 56-40-6 | |
| Histidine HCl H2O | Alfa Aesar | A17627 | |
| Isoleucine | Acros Organics | 73-32-5 | |
| Leucine | Alfa Aesar | A12311 | |
| Lysine HCl | Alfa Aesar | J62099 | |
| Methionine | Acros Organics | 63-68-3 | |
| Ornithine HCl | Alfa Aesar | A12111 | |
| Phenylalanine | Acros Organics | 63-91-2 | |
| Proline | Alfa Aesar | A10199 | |
| Serine | Alfa Aesar | A11179 | |
| Threonine | Acros Organics | 72-19-5 | |
| Tryptophan | Acros Organics | 73-22-3 | Prepared in 0.2 M NaOH |
| Tyrosine | Alfa Aesar | A11141 | Prepared in 1.0 M NaOH |
| Valine | Acros Organics | 72-18-4 | |
| Antibiotic | |||
| Carbenicillin | Alfa Aesar | J6194903 | |
| Day-of Stocks | |||
| CaCl2 * 2H2O | Fisher Chemical | C79-500 | |
| Dextrose (D-glucose) | Fisher Chemical | 50-99-7 | |
| 1,2-dioleoyl-sn-glycero-3-phosphocholine (DOPC) | Fisher (Avanti Polar Lipids) | 4235-95-4 | shake 15-20 min at 37 °C to evaporate chloroform |
| FeSO4 * 7H2O | Acros Organics | 7782-63-0 | this stock equals 1 mg/mL, MUST make fresh |
| L-lactic acid | Alfa Aesar | L13242 | pH stock to 7 with NaOH |
| MgCl2 * 6H2O | Acros Organics | 7791-18-6 | |
| N-acetylglucosamine | TCI | A0092 | |
| Prepared solids | |||
| Porcine mucin | Sigma | M1778-100G | UV-sterilize |
| Salmon sperm DNA | Invitrogen | 15632-011 | |
| Stain | |||
| Propidium iodide | Alfa Aesar | J66764MC | |
| Salts | |||
| K2SO4 | Alfa Aesar | A13975 | |
| KCl | Alfa Aesar | J64189 | add solid directly to buffered base |
| KNO3 | Acros Organics | 7757-79-1 | |
| MOPS | Alfa Aesar | A12914 | add solid directly to buffered base |
| NaCl | Fisher Chemical | S271-500 | add solid directly to buffered base |
| Na2HPO4 | RPI | S23100-500.0 | |
| NaH2PO4 | RPI | S23120-500.0 | |
| NH4Cl | Acros Organics | 12125-02-9 | add solid directly to buffered base |
| Consumables | |||
| Conical tubes (15 mL) | Olympus plastics | 28-101 | |
| Conical tubes (50 mL) | Olympus plastics | 28-106 | |
| Culture tubes w/air flow cap | Olympus plastics | 21-129 | |
| 35 mm four chamber glass-bottom dish | CellVis | NC0600518 | |
| Luria Bertani (LB) broth | Genessee Scientific | 11-118 | |
| Phosphate-buffered saline (PBS) | Fisher Bioreagents | BP2944100 | |
| Pipet tips (p200) | Olympus plastics | 23-150RL | |
| Pipet tips (p1000) | Olympus plastics | 23-165RL | |
| Serological pipets (5 mL) | Olympus plastics | 12-102 | |
| Serological pipets (25 mL) | Olympus plastics | 12-106 | |
| Serological pipets (50 mL) | Olympus plastics | 12-107 | |
| Ultrapure water (RNase/DNase free); nanopure water | Genessee Scientific | 18-194 | Nanopure water used for preparation of solutions in Table 1 |
| Syringes (10 mL) | BD | 794412 | |
| Syringes (50 mL) | BD | 309653 | |
| 0.22 mm PES syringe filter | Olympus plastics | 25-244 | |
| PS cuvette semi-mico | Olympus plastics | 91-408 | |
| Software | |||
| Biorender | To prepare the figures | ||
| FacsDiva6.1.3 | Becton Dickinson, San Jose, CA | ||
| Imaris | Bitplane | version 9.6 | |
| Zen Black | |||
| Equipment | |||
| FacsAriallu | Becton Dickinson, San Jose, CA | ||
| LSM 880 confocal laser scanning microscope | Zeiss |
Odniesienia
- Ramsay, K. A., et al. The changing prevalence of pulmonary infection in with fibrosis: A longitudinal analysis. Journal of Cystic Fibrosis. 16 (1), 70-77 (2017).
- Bessonova, L., et al. Data from the US and UK cystic fibrosis registries support disease modification by CFTR modulation with ivacaftor. Thorax. 73 (8), 731-740 (2018).
- Breuer, O., et al. Changing prevalence of lower airway infections in young children with cystic fibrosis. American Journal of Respiratory and Critical Care Medicine. 200 (5), 590-599 (2019).
- O'Donnell, J. N., Bidell, M. R., Lodise, T. P. Approach to the treatment of patients with serious multidrug-resistant Pseudomonas aeruginosa infections. Pharmacotherapy. 40 (9), 952-969 (2020).
- Bjarnsholt, T., et al. The in vivo biofilm. Trends in Microbiology. 21 (9), 466-474 (2013).
- Darch, S. E., et al. Spatial determinants of quorum signaling in a Pseudomonas aeruginosa infection model. Proceedings of the National Academy of Sciences of the United States of America. 115 (18), 4779-4784 (2018).
- Zhu, K., Chen, S., Sysoeva, T. A., You, L. Universal antibiotic tolerance arising from antibiotic-triggered accumulation of pyocyanin in Pseudomonas aeruginosa. PLoS Biology. 17 (12), 3000573(2019).
- Ciofu, O., Tolker-Nielsen, T. Tolerance and resistance of Pseudomonas aeruginosa biofilms to antimicrobial agents-how P. aeruginosa can escape antibiotics. Frontiers in Microbiology. 10, 913(2019).
- Turner, K. H., Wessel, A. K., Palmer, G. C., Murray, J. L., Whiteley, M. Essential genome of Pseudomonas aeruginosa in cystic fibrosis sputum. Proceedings of the National Academy of Sciences of the United States of America. 112 (13), 4110-4115 (2015).
- Darch, S. E., et al. Phage inhibit pathogen dissemination by targeting bacterial migrants in a chronic infection model. MBio. 8 (2), 00240(2017).
- Jorth, P., et al. Regional isolation drives bacterial diversification within cystic fibrosis lungs. Cell Host & Microbe. 18 (3), 307-319 (2015).
- Palmer, K. L., Aye, L. M., Whiteley, M. Nutritional cues control Pseudomonas aeruginosa multicellular behavior in cystic fibrosis sputum. Journal of Bacteriology. 189 (22), 8079-8087 (2007).
- Davies, D. G., et al. The involvement of cell-to-cell signals in the development of a bacterial biofilm. Science. 280 (5361), 295-298 (1998).
- Hartmann, R., et al. Quantitative image analysis of microbial communities with BiofilmQ. Nature Microbiology. 6 (2), 151-156 (2021).
- Stacy, A., et al. Bacterial fight-and-flight responses enhance virulence in a polymicrobial infection. Proceedings of the National Academy of Sciences of the United States of America. 111 (21), 7819-7824 (2014).
Access restricted. Please log in or start a trial to view this content.
Przedruki i uprawnienia
Zapytaj o uprawnienia na użycie tekstu lub obrazów z tego artykułu JoVE
Zapytaj o uprawnieniaPrzeglądaj więcej artyków
This article has been published
Video Coming Soon
Copyright © 2025 MyJoVE Corporation. Wszelkie prawa zastrzeżone