
A subscription to JoVE is required to view this content. Sign in or start your free trial.
Method Article
Flow Cytometry Protocols for Surface and Intracellular Antigen Analyses of Neural Cell Types
In This Article
Summary
We provide a detailed description of a protocol for flow cytometric analysis of surface antigens and/or intracellular antigens in neural cell types. Critical aspects of experimental planning, step-by-step methodological procedures, and fundamental principles of flow cytometry are explained in order to enable neurobiologists to exploit this powerful technology.
Abstract
Flow cytometry has been extensively used to define cell populations in immunology, hematology and oncology. Here, we provide a detailed description of protocols for flow cytometric analysis of the cluster of differentiation (CD) surface antigens and intracellular antigens in neural cell types. Our step-by-step description of the methodological procedures include: the harvesting of neural in vitro cultures, an optional carboxyfluorescein succinimidyl ester (CFSE)-labeling step, followed by surface antigen staining with conjugated CD antibodies (e.g., CD24, CD54), and subsequent intracellar antigen detection via primary/secondary antibodies or fluorescently labeled Fab fragments (Zenon labeling). The video demonstrates the most critical steps. Moreover, principles of experimental planning, the inclusion of critical controls, and fundamentals of flow cytometric analysis (identification of target population and exclusion of debris; gating strategy; compensation for spectral overlap) are briefly explained in order to enable neurobiologists with limited prior knowledge or specific training in flow cytometry to assess its utility and to better exploit this powerful methodology.
Introduction
Flow cytometry has been extensively exploited in immunology, hematology and oncology to define cell populations via intrinsic scatter properties, cell surface antigen expression, and other fluorescence parameters1-3. Our insights into blood lineage development and disease are a result to a significant degree of the continuous refinement of this methodology after its initial implementation4,5. Increased awareness of the quantitative and overall analytic potential of flow cytometry has recently encouraged its more widespread use in stem cell research and may enable similarly profound progress in a shorter time frame6. However, the application of flow cytometry to specifically analyze and isolate neural populations has long been perceived as challenging. In contrast to hematopoietic cells that naturally exist in suspension, neural cell types are typically harvested from excessively complex sources that may include glia and various other surrounding cells as well as an intricate network of process-bearing neurons. Consequently, neurobiology has yet to implement the versatility of flow cytometry to its complete potential in daily research routines. However, as long as a viable single cell suspension can be generated (and protocols have been devised and optimized for that purpose7), flow cytometry and fluorescence-activated cell sorting (FACS) can be considered a valuable element of the analytical repertoire in neurobiology8-11.

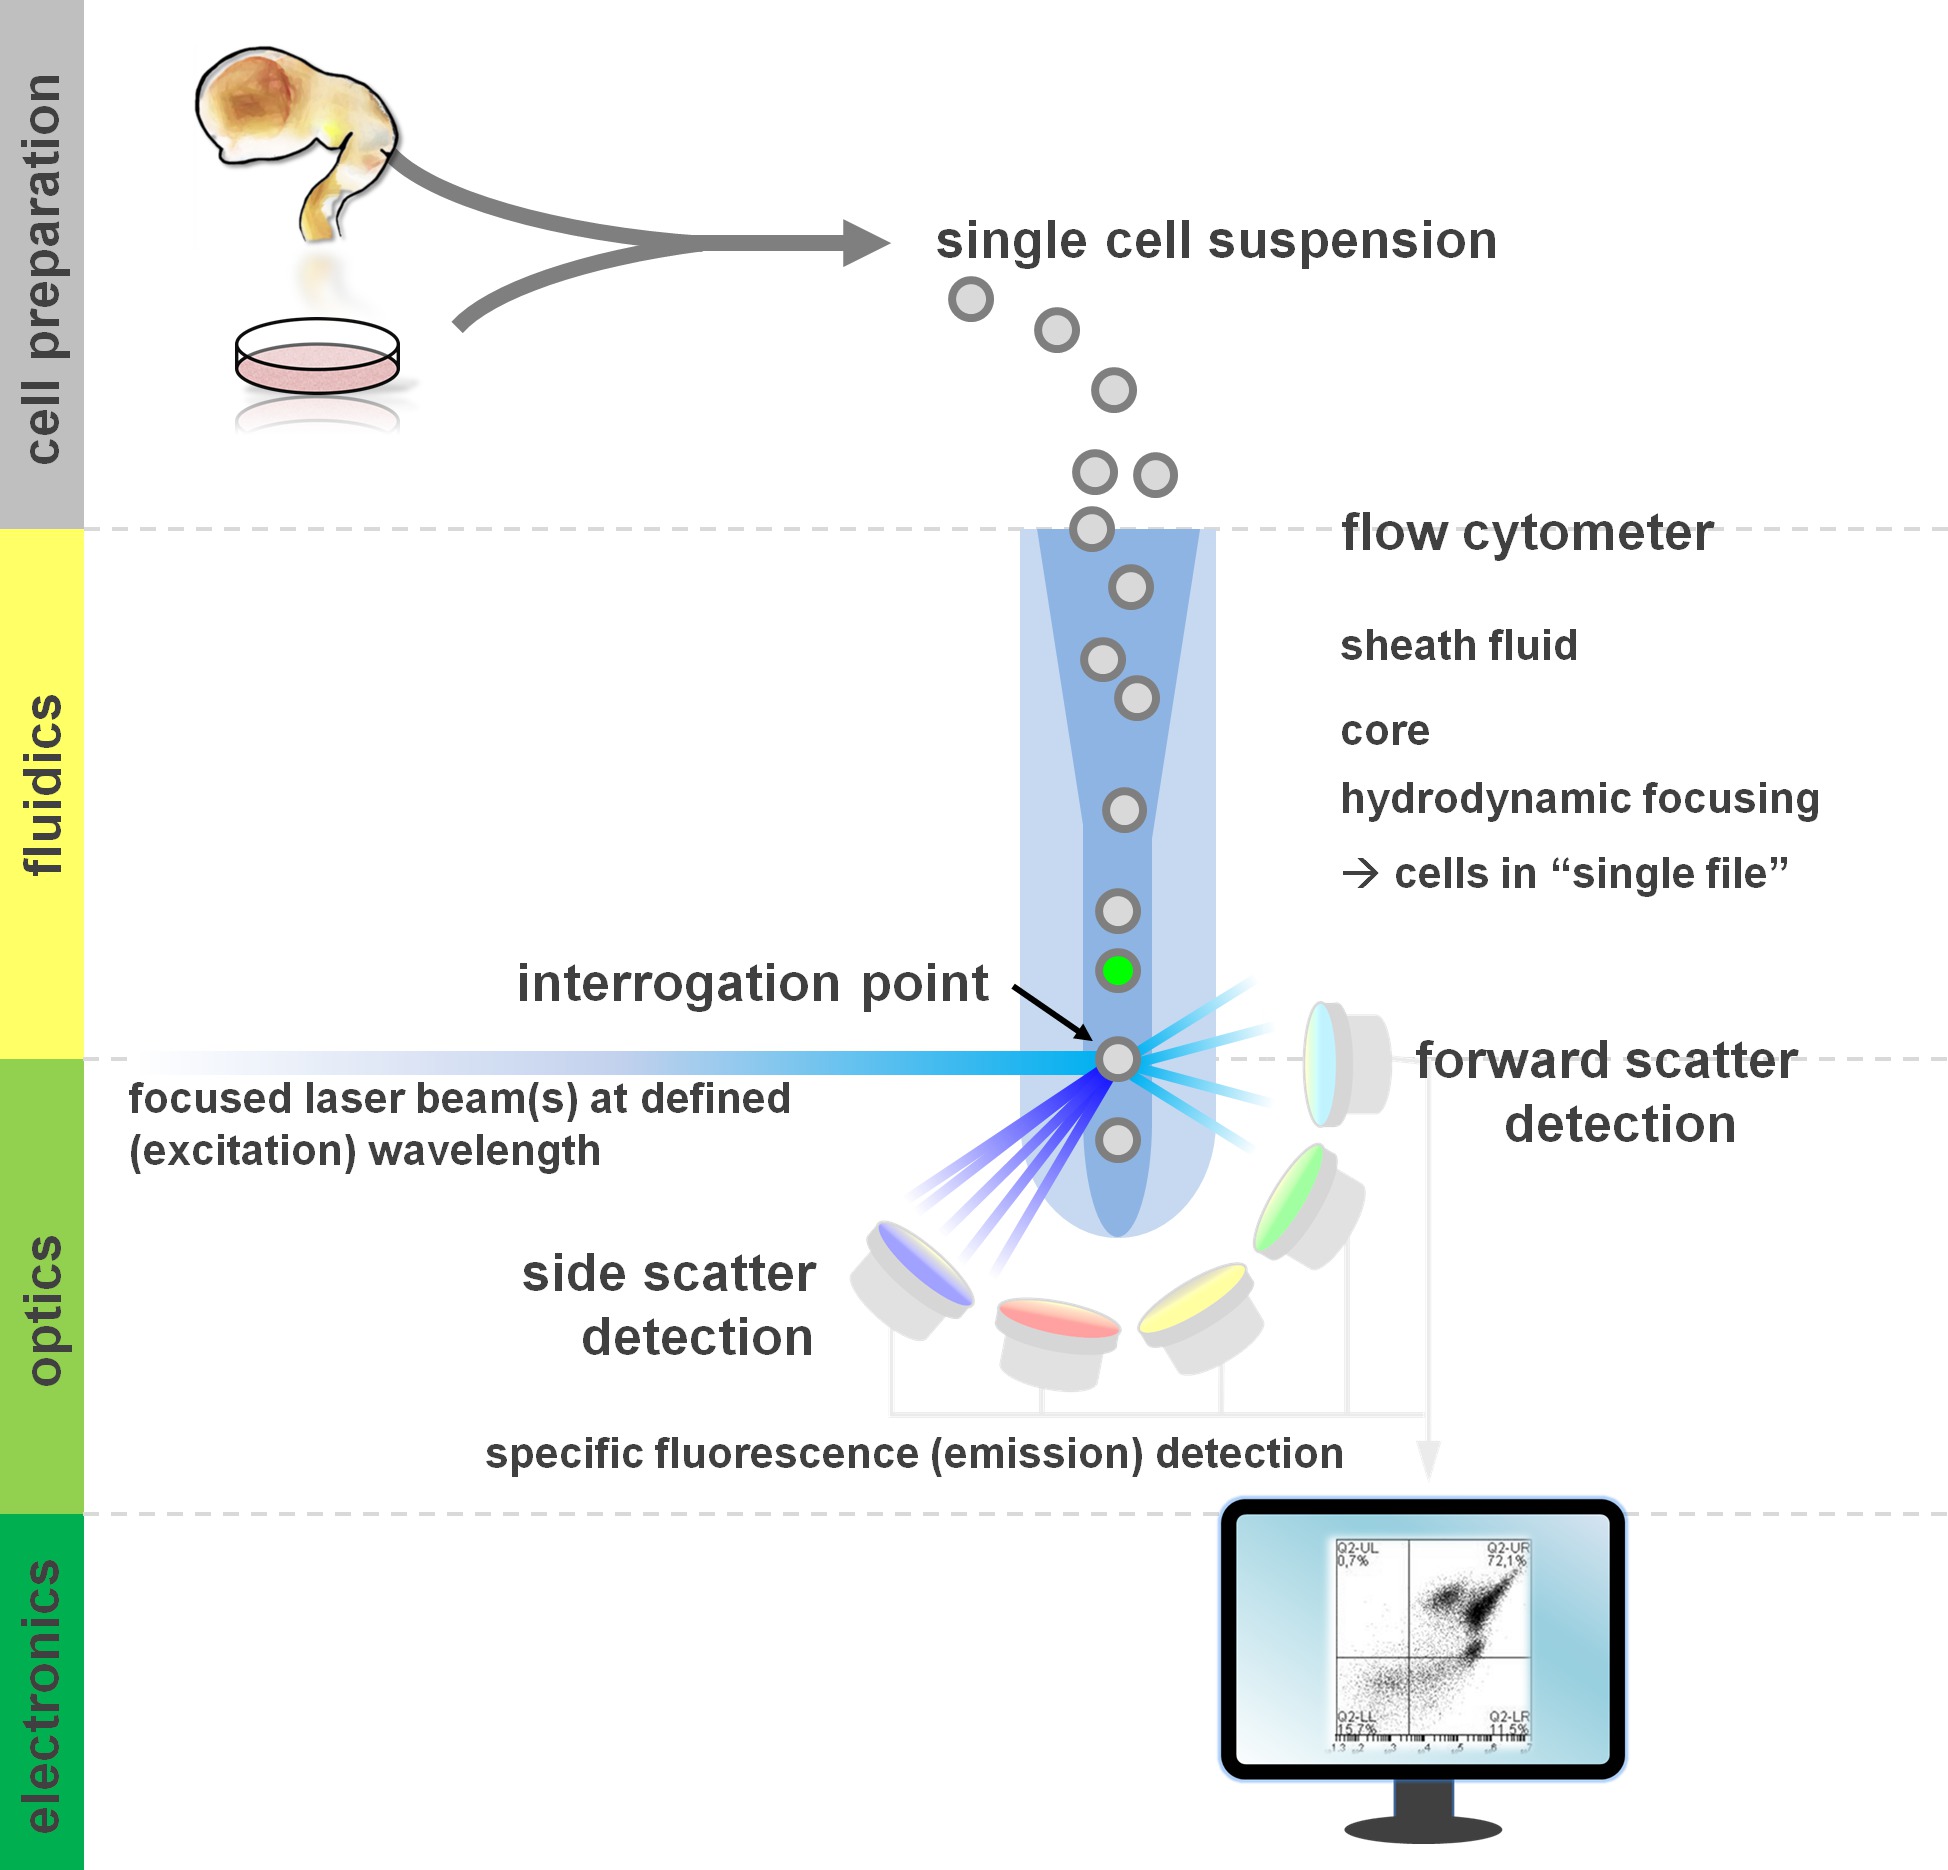
Figure 1. Principle of flow cytometric analysis and components of a flow cytometer. Flow cytometers comprise three main systems: fluidics, optics and electronics. A streamlined flow of cells in suspension (prepared from primary tissue or in vitro culture) is accomplished by the sheath fluid via hydrodynamic focusing, restricting the sample to its center core. The optical parts are composed of lasers that illuminate the stream of cells and optical filters that direct the signal to the appropriate detectors. The light signals detected are converted to electronic signals, subsequently processed by a computer and visualized on a monitor for data analysis and gating. Please click here to view a larger version of this figure.
Users of flow cytometric methods profit from at least a basic understanding of the underlying fundamentals including a cytometer’s building blocks (for review see12,13; also see Figure 1). A laser beam intersects with a hydrodynamically focused fluidic stream that contains the cells in suspension, which in turn pass through the laser beam in ‘single file’ one after another. The interception of a cell (or any other particle, for that matter) with the laser results in the scattering of light from this interrogation point. Scattered light can be detected in continuation of the laser direction (forward scatter, associated with the size of the particle), as well as perpendicular to its direction (side scatter; reflecting the granulosity of the particle/cell). These aforementioned scatter properties do not require specific labeling, which is why an unlabeled sample (or also cellular debris, air bubbles, etc.) will generate a signal (event) on the bivariate forward scatter versus side scatter plot commonly used for initial gating. By using the appropriate lasers and filters specific for the corresponding excitation and emission spectra, a cell can be analyzed for its positivity, level of intensity, or absence of fluorescent markers. The majority of flow cytometric applications have focused on characterization via cell surface antigens. Unlike the hematopoietic lineage, the neural lineage has remained less extensively defined according to surface epitope expression patterns5. One advantage of exploiting surface antigens is that live cells can be subjected to cell sorting paradigms such as FACS. In contrast, intracellular antigen staining requires fixation and permeabilization steps to mediate the epitope-antibody interaction, precluding downstream applications that require viable cells. Of note, such approaches still allow for numerous quantitative assays14 as well as downstream analyses for RNA and protein expression15. Hematology, immunology and oncology have often used more than a dozen markers in conjunction to define particular subpopulations16. Additionally, mass cytometry or CyTOF can now be used to analyze up to 30 parameters simultaneously17,18.
For neural stem cell applications as well as primary cultures14,19,20 the heterogeneity of cells in vitro is a common phenomenon21-23. The cells not representing the target population of interest embody a potentially confounding factor for experimental readout24,25. Conveniently, the different cellular subsets present within a heterogeneous cell suspension bear distinct (known or yet to be deciphered) antigen expression profiles, which can be utilized to define these various populations. Flow cytometry can hence play a crucial role in resolving cellular heterogeneity and, thereby, facilitate biomedical applications (in vitro assays, cell therapy) and optimize quantitative readout by focusing on the most relevant subset24,26. Various surface antigen combinations have been identified over the past few years to allow the quantitation and isolation of specific neural cell types. This includes CD133 for the enrichment of neural stem cells27, a combination of the CD15/CD24/CD29 surface antigens for the isolation of NSC, differentiated neuron and neural crest cells28 or CD15/CD24/CD44/CD184/CD271 to isolate neural and glial subsets25, among other signatures29,30. Beyond neurons, glial markers include A2B531, CD4425, NG232 and GLAST33. A recent publication has exploited the midbrain floorplate precursor marker CORIN34,35 to enrich for dopaminergic precursors in Parkinson cell transplantation paradigms36. CD molecules are not only markers, but functionally relevant mediators of cell-cell interactions and of a cell’s ability to respond to cues from extracellular matrix molecules and growth factors37. One strategy of further enhancing the arsenal of combinatorial CD antigens to characterize neural lineage development is to use known intracellular markers to screen for and define CD antigen combinations for a particular cell type of interest. We have recently exploited such an approach and identified CD49f–/CD200high combinatorial expression patterns as a novel approach for enriching neuronal subsets from neurally differentiated induced pluripotent stem cell culture systems38. Here, we include and discuss the latter protocol (and optional variations thereof) in which surface staining and intracellular staining can be used simultaneously for defining neural cell subpopulations by flow cytometry.

Figure 2. Flow diagram of experimental protocol options. The figure depicts a schematic representation of the major steps involved in the protocol. Optional steps (CFSE dye or intracellular antigen labeling) are indicated by light grey boxes. After harvesting, it is essential to assess the viability and cell number of neural cell suspensions prior to cell surface staining. Positive as well as negative controls need to be included in addition to the samples of interest. Samples can be analyzed by flow cytometric analysis and/or used in cell sorting paradigms. Please click here to view a larger version of this figure.
While we have previously used primary antibody in combination with secondary antibody for intracellular staining38, we now introduce non-covalent labeling of the primary antibody via fluorescent Fab fragments (Zenon labeling) as a slight variation, thereby reducing the steps of cell manipulation39. Moreover, as a further example of the protocol’s versatility, we employ an optional labeling of one experimental subset by carboxyfluorescein succinimidyl ester (CFSE) prior to surface antigen staining. Such CFSE pre-labeling enables the immediate direct comparison of two cell lines or experimental conditions (CFSE-labeled vs. unlabeled) within a single sample tube, reducing variance or subtle differences in incubation time and saving antibody. CFSE is an established fluorescent dye that is commonly used for cell tracking40, in proliferation41,42 and barcoding experiments43,44. Finally, while actual sorting steps (FACS, immunomagnetic cell separation or immunopanning) are not part of this protocol, in principle, the harvesting and labeling procedures described here do yield samples that can be subjected to surface antigen- or intracellular labeling-based sorting applications15 25,28.
With this article, we aim to: summarize a viable surface antigen staining protocol25,28, summarize a protocol for detection of intracellular targets as well as combined surface and intracellular antigen analysis38, present an intracellular CFSE dye labeling step41,45 as an experimental option for comparative analyses of neural cell populations, and summarize approaches to flow cytometric analysis (appropriate controls13,46, gating strategy and data presentation47).
Protocol
1. Neural Cell Harvesting
- Assessment by microscope:
- Prior to initiating an experiment, check the status of the culture with bright-field or phase contrast microscopy.
NOTE: While primary neural tissue obtained from dissections is, in principle, equally amenable to flow cytometric analysis14,28, please note that the protocol’s focus is on cells obtained from in vitro neural cell systems.
- Prior to initiating an experiment, check the status of the culture with bright-field or phase contrast microscopy.
- Harvesting cells7:
- Gently wash the dish/flask of adherent cells with Mg2+/ Ca2+ free phosphate-buffered saline (PBS) at RT (e.g., 5 ml for T75 flask, 3 ml per well for 6-well plate, or 10 ml for 10 cm dish).
NOTE: The PBS used throughout the protocol is Mg2+/ Ca2+ free.- For the video example, use a T75 flask of SH-SY5Y neuroblastoma cells at 80% confluency. Apply additional washing steps in cases where considerable debris is present in the dish.
- Consider washes with serum albumin-containing PBS48, Percoll, or Ficoll49 centrifugation gradients and/or commercially available beads50,51. Removal of myelin and other lipid or other contaminants is critical, particularly when adult primary tissue sources are being used.
- Add pre-warmed (37 °C) trypsin replacement at an appropriate volume that covers the entire surface of the tissue culture vessel.
NOTE: Alternatively, consider Accutase or other enzymatic digestion options. This critical step may negatively affect surface epitope expression (see 7). - Incubate the dish/flask at 37 °C for 2 - 5 min (depending on the cell type) to allow cells to detach. Gently tap the tissue culture vessel or flush with a serological pipet to dislodge the cells. Avoid over digestion (as this can cause cell loss and clotting at later steps).
- Quench the trypsin replacement by adding twice the volume of flow buffer (2% FBS in PBS) and collect the cells in a 15 ml conical tube.
- Gently triturate the cell suspension using a microliter pipet (100 - 1,000 µl) or a 5 ml serological pipet to prepare a single cell suspension.
- Centrifuge the cells at 220 x g for 5 min at 25 °C. Carefully aspirate the supernatant leaving the pellet behind.
- Re-suspend the pellet in an appropriate volume of flow buffer, depending on the size of the pellet (e.g., for one confluent T75 flask of SH-SY5Y cells the typical yield is at least 10 x 106 cells, in which case the cells are resuspended in 5 ml of flow buffer).
NOTE: If larger chunks or clotting are observed, filter through a 30 - 100 µm mesh.
- Gently wash the dish/flask of adherent cells with Mg2+/ Ca2+ free phosphate-buffered saline (PBS) at RT (e.g., 5 ml for T75 flask, 3 ml per well for 6-well plate, or 10 ml for 10 cm dish).
- Cell counting52:
- Transfer a small aliquot of the cell suspension to a microcentrifuge tube and dilute at a defined ratio in a volume of trypan blue or an alternative viability dye before transfer to a hemocytometer or automated cell counting system.
- Dilute the cell suspension to a concentration of 1 x 10⁶ viable cells/ml by adding the appropriate volume of flow buffer or PBS with 0.1% BSA (if proceeding with CFSE labeling).
NOTE: Propidium iodide, 7-aminoactinomycin D, annexin V and commercially available fixable viability assay kits represent alternative options in order to assess the viability of cells. Also, apoptosis assays using caspase-3 fluorescence as described previously53 may be used. Fluorescent channels will be “occupied” by these reagents which may limit the options for subsequent steps if included in all samples.
2. Intracellular Dye Labeling Using CFSE (Figure 3)
- Dilute the CFSE to a desired stock concentration that can be easily used.
NOTE: For these experiments a stock concentration of 0.01 mM was used. Determine the optimal working concentration of CFSE empirically. - Add 10 µl of 0.01 mM CFSE solution per ml of cells (Section 1.3.2, concentration of 1 x 10⁶ cells/ml in PBS + 0.1% BSA) for a final concentration of 0.1 µM. Briefly vortex to mix well.
NOTE: CFSE concentrations used here are about ten-fold lower than the ones commonly applied in proliferation assays, hence cell toxicity of the dye is minimal. We do not observe negative effects on cell viability. - Incubate for 5 min at RT with constant shaking (200 rpm). Protect from light.
- Quench the dye by adding 5 volumes of flow buffer to the tubes. Centrifuge at 94 x g for 5 min at RT.
- Discard the supernatant leaving the pellet behind. Re-suspend the cells with 5 volumes of flow buffer.
- Centrifuge at 94 x g for 5 min at RT. Discard the supernatant and re-suspend the cells in flow buffer at a concentration of 1 x 10⁶ cells/ml.
- Add an equal number of unstained cells of interest to the stained cell suspension. Proceed to surface antigen staining protocol (Section 3).

Figure 3. Detection of differential CD surface antigen expression between two cell lines via CFSE dye labeling. SH-SY5Y neuroblastoma cells are pre-labeled with CFSE for subsequent identification in comparison to unlabeled BJ fibroblasts. Co-staining of the mixed sample (right panels) with surface markers CD24 or CD54 (both conjugated to APC) demonstrates that cell lines are easily distinguishable due to the CFSE staining (arrows = SH-SY5Y; arrowheads = BJ fibroblasts). The majority of SH-SY5Y cells express CD24 but not CD54 (ICAM-1). In contrast, BJ fibroblasts (CFSE-negative) are positive for CD54 but largely negative for CD24. Please click here to view a larger version of this figure.
3. Cell Surface Staining
- Label tubes including samples and critical controls (see Table 1).
| Tube no. | Sample name | Antigen-fluorophore | Dilution |
| 1 | Unstained cells | - | |
| 2 | Single stained | CD24-APC | 1:50 |
| 3 | Single stained | TUJ1-Alexa fluor 488nm | 1:2,000 |
| 4 | Double stained | CD24-APC | 1:50 |
| TUJ1-Alexa fluor 488nm | 1:2,000 | ||
| 5 | Single stained | Secondary only: Alexa fluor 488nm | 1:2,000 |
Table 1. List of tubes to be included in a typical flow cytometry experiment. The table shows a minimal set of sample tubes required for a co-staining experiment described in this video article. An ideal experiment needs to include all necessary controls (negative, positive as well as compensation controls) for accurate interpretation of the results obtained.
- Add 100 µl of cell suspension (from Section 2.7 or 1.3.2) to each 1.5 ml microcentrifuge tube.
NOTE: Make sure a minimum of 0.1 x 10⁶ cells are present per 100 µl of cell suspension. - Add fluorophore conjugated antibody to the sample at an appropriate dilution.
NOTE: Determine working dilution for each antibody prior to the experiment. See Table 2 for a list of neural surface antigens.
| Antigen | Cell Type | Reference |
| CD15 | Neural stem cells | [28, 67] |
| CD24 | Neuronal cells | [28, 68] |
| CD29 | Neural stem cells | [28, 69, 70] |
| CD44 | Glial cells | [25] |
| CD49f | Neural stem cells | [38] |
| CD56 (NCAM) | Neuronal cells | [71] |
| CD133 | Neural stem cells | [27] |
| CD184 | Neural stem cells and glial cells | [25] |
| CD200 | Neuronal cells | [38] |
| CD271 | Neural crest stem cells | [25] |
| A2B5 | Glial cells | [31] |
| CORIN | Dopaminergic precursors | [35, 36] |
| FORSE1 | Neural stem cells (NSC) | [72 ] |
| GLAST | Glial cells | [33] |
| NG2 | Glial cells | [32] |
Table 2. Selection of neural surface antigens. This table provides a list of surface epitopes found to be expressed by various neural cell types to exemplify the increasing panel of surface antigens used to characterize the neural lineage. Note that this selection is far from being complete and that most of these markers are also expressed by a range of other neural and non-neural cells. Consequently, combinations of several markers will be required to better define and isolate the indicated neural subsets.
- Incubate for 30 min on an orbital shaker (200 rpm) in the dark.
- Flow buffer wash
- Add 1 ml of flow buffer to the tubes. Centrifuge at 380 x g for 4 min at 4 °C.
- Discard the supernatant leaving the pellet behind.
- Repeat the wash step again.
- After the second wash, decant the supernatant and re-suspend the cells in flow buffer to a final volume of 100 µl.
- Use sample for flow cytometric analysis. Alternatively, proceed with Section 4 and 5.
NOTE: If cells are to be sorted and put back into culture post-FACS (i.e., viable cell suspension without fixation or permeabilization), apply aseptic techniques during the harvest, staining and analytical steps.
4. Fixation and Permeabilization38
- Fixation using paraformaldehyde (PFA):
- Prepare fixation buffer containing 2% PFA in PBS.
NOTE: PFA is harmful to humans and the environment. Use appropriate personal protective equipment and discard waste in accordance with local regulations. - Add 500 µl of fixation buffer to 100 µl of cell suspension.
- Incubate the tubes at RT for 15 min on an orbital shaker (100 rpm) in the dark.
- Prepare fixation buffer containing 2% PFA in PBS.
- PBS wash:
- Add 1 ml of PBS to the tube. Centrifuge at 380 x g for 3 min at 4 °C.
- Discard/ decant the supernatant leaving approximately 100 µl in the tube.
- Permeabilization with Tween-20:
- Prepare permeabilization buffer containing 0.7% Tween-20 in PBS.
- Add 500 µl of permeabilization buffer to 100 µl of cell suspension.
- Incubate the tubes at RT for 15 min on an orbital shaker (100 rpm) in the dark.
- Wash the cells once with PBS (as described in Section 4.2) and remove the supernatant from the tubes completely, leaving only the pellet behind.
5. Intracellular Antigen Staining38 (Figure 4)
- Preparation of primary antibody solutions:
- Dilute the primary antibodies in dilution buffer containing 1% bovine serum albumin, 10% serum (e.g., normal donkey or goat serum) and 0.5% Tween-20 in PBS.
NOTE: Choose the serum to be used depending on the species the secondary antibodies were raised in. - Alternatively, use Zenon fluorescein labeling of the primary antibody according to the manufacturer’s instructions.
- Prepare 1 µg of primary antibody in PBS at an appropriate dilution (total volume ≤ 20 µl).
- Add 5 µl of Zenon fluorescein IgG labeling reagent (Component A) to the antibody solution.
- Incubate the mixture for 5 min at RT.
- Add 5 µl of Zenon blocking reagent (Component B) to the reaction mixture.
- Incubate the mixture for 5 min at RT. Apply the antibody to the sample within 30 min.
- Dilute the primary antibodies in dilution buffer containing 1% bovine serum albumin, 10% serum (e.g., normal donkey or goat serum) and 0.5% Tween-20 in PBS.
- Primary antibody staining:
- Add 100 µl of the primary antibody solution to the cell pellet and gently triturate to mix.
- Alternatively, add Zenon fluorescein labeled antibody to the cell suspension at the appropriate dilution.
- Incubate the tubes at RT for 30 min on an orbital shaker (200 rpm), protected from light. Wash the cells once with PBS (as describes in Section 4.2) and remove the supernatant from the tubes completely, leaving only the pellet behind.
- Secondary antibody staining (not required for the Zenon fluorescein labeled antibodies):
- Dilute the secondary antibodies in PBS at an appropriate concentration.
- Add 100 µl of the secondary antibody solution to the cell pellet and gently triturate to mix. Incubate the tubes at RT for 30 min on a shaker (200 rpm) in the dark.
- Wash the samples two times with PBS (as described in Section 4.2).
- Wash once with flow buffer (see Section 3.5).
- Re-suspend the cells in approximately 150 µl of flow buffer and analyze on the flow cytometer.

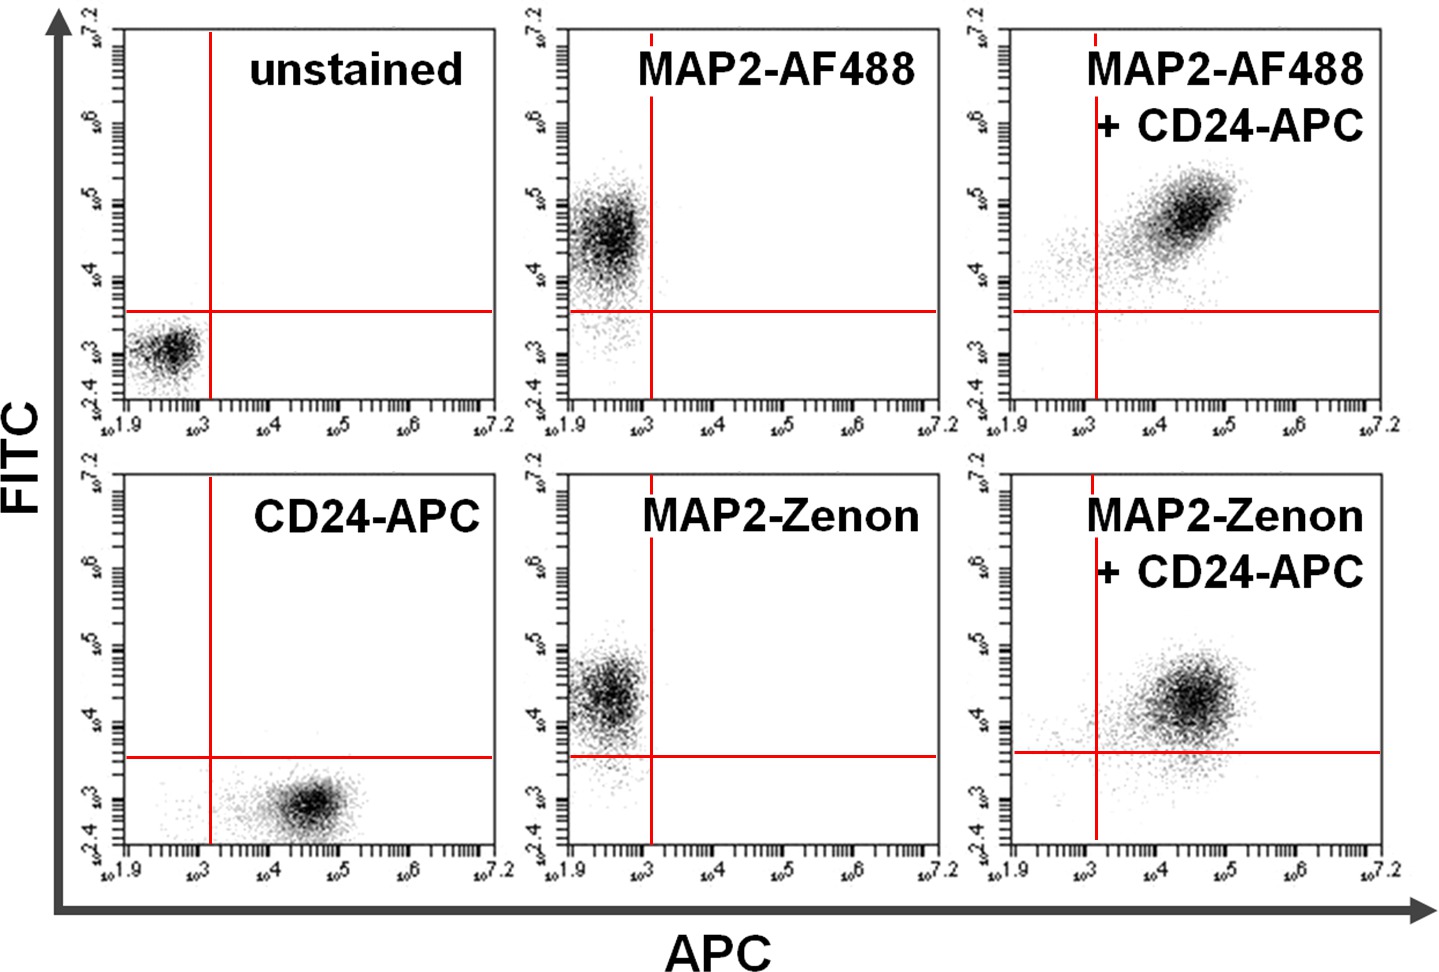
Figure 4. Co-staining of surface and intracellular proteins. Flow cytometry data exemplifies a comparison between primary + secondary antibody-based versus Zenon fluorescein-based intracellular staining in combination with surface staining. Exclusive positivity on the y-axis (upper left quadrant) and the x-axis (lower right quadrant) shows cells stained for MAP2 and CD24, respectively. After co-staining, shared MAP2 and CD24 expression can be seen in the upper right quadrant (right panels). Comparison of using Alexa fluor 488 (top; AF488) versus Zenon fluorescein (bottom) for MAP2-labeling yields similar results. Please click here to view a larger version of this figure.
6. Flow Cytometric Analysis
- Conduct flow cytometric analysis immediately after the completion of the staining protocol using a flow cytometer with appropriate filters for signal detection. Use 488 nm blue and 640 nm red laser with FL-1 (533/30), FL-2 (585/40), and FL-4 (675/25) bandpass filters.
- Set up primary gates based on the forward and side scatter excluding debris and dead cells.
- Set fluorescence gates for surface and intracellular antigen to ≤0.5% based on the unstained samples and compensation for spectral overlap using single stained controls.
Results
The protocol presented here allows for versatile experimental approaches (Figure 2). In its shortest version (steps 1, 3 and 6), it can be considered a guide for simple staining of surface antigens. In its more complex form, a number of co-labeling paradigms with a range of intracellular antigens can be pursued (optional steps 2 and/or 4 to 5). Moreover, the CFSE-labeling step exemplifies its utility for cell label...
Discussion
The protocol presented here is well established for neural cell cultures derived from human stem cells, but can be equally applied to other neural cell sources including primary tissue or neural cell lines. In addition to embryonic sources, neural stem or progenitor cells can be extracted from the neurogenic regions of adult brain27. Moreover, flow cytometry and FACS can be exploited to quantify, analyze and isolate various cell populations including mature neurons54, astroglia33, microgl...
Disclosures
The authors declare no potential conflicts of interest.
Acknowledgements
Our research program is funded through the Emmy Noether-Program of the German Research Foundation (DFG), grant PR1132/3-1. Further support by the Müller-Fahnenberg Foundation of the University of Freiburg is gratefully acknowledged. This study was supported in part by the Excellence Initiative of the German Research Foundation (GSC-4, Spemann Graduate School).
Materials
| Name | Company | Catalog Number | Comments |
| DMEM/F12 (1:1) (Dulbecco's Modified Eagle Medium/Nutrient Mixture F-12) |  Life Technologies Life Technologies | 11330057 | |
| DPBS without Ca2+ Mg2+ | Life Technologies | 14190169 | |
| Fetal bovine serum, qualified, E.U.-approved, South America origin (FBS) | Life Technologies | 10270-106 | |
| MEM Non-essential amino acids (100x) | Life Technologies | 11140035 | |
| TrypLE Express | Life Technologies | 12604013 | |
| Trypan blue solution, 0.4% | Life Technologies | 15250061 | |
| Paraformaldehyde | Carl Roth | 335.3 | |
| Bovine serum albumin (BSA) Fraction V | PAA Laboratories, Coelbe | K41-001 | |
| Tween-20 Detergent | Calbiochem | 655205 | |
| Carboxyfluorescein succinimidyl ester (CFSE) | eBioscience | 65-0850-84 | |
| DMSO | AppliChem | A1584 | |
| Bottle top filters express plus 0.22 µm, 250 ml | Millipore | SCGPU02RE | |
| Cell culture treated flasks (T 25) | NUNC | 156367 | |
| Cell culture treated flasks (T 75) | NUNC | 156499 | |
| Conical tubes (15 ml) | Greiner Bio-One | 188271 | |
| Conical tubes (50 ml) | Greiner Bio-One | 227261 | |
| Pasteur pipet, glass (150 mm) | STEIN Labortechnik, Remchingen | S03710150 | |
| Pipet tips (0.1-10 µl) | Corning | 4125 | |
| Pipet tips (1-200 µl) | Corning | 4126 | |
| Pipet tips (100-1000 µl) | Corning | 4129 | |
| Serological pipets, 5 ml | Corning | 4051 | |
| Serological pipets, 10 ml | Corning | 4101 | |
| Serological pipets, 25 ml | Corning | 4251 | |
| Microcentrifuge tubes (0.5 ml) | Sarstedt | 72,699 | |
| Microcentrifuge tubes (1.5 ml) | Greiner Bio-One | 616201 | |
| Microcentrifuge tubes (2.0 ml) | Sarstedt | 72,695,500 | |
| Anti-Human CD24 APC monoclonal antibody | eBioscience | 17-0247-42 | Working dilution 1:50 |
| Anti-Human CD54 PE monoclonal antibody | eBioscience | 12-0549-42 | Working dilution 1:50 |
| Neuronal Class III β-Tubulin (Tuj1) polyclonal antibody | Covance | PRB-435P | Working dilution 1:2,000 |
| Alexa Fluor 488 Donkey anti Rabbit | Life Technologies | A21206 | Working dilution 1:2,000 |
| Zenon® Fluorescein Rabbit IgG Labeling Kit | Life Technologies | Z-25342 | |
| Neubauer-Improved counting chamber | Marienfeld | 0640010 | |
| Vortex | Scientific Industries | G560E | |
| Thermomixer comfort | Eppendorf | 5355 000.001 | |
| Accuri C6 flow cytometer | Becton Dickinson (BD) | 653118 | |
| Microcentrifuge refrigerated, PerfectSpin 24 R | Peqlab | 91-PSPIN-24R | |
| Orbital shaker, Unimax 1010 | Heidolph | 543-12310-00 | |
| Centrifuge refrigerated, Rotanta 96 RC | Hettich | 4480-50 | |
| Class II Biological safety cabinet Safe 2020 | Thermo Scientific | 51026640 | |
| CO2 Incubator, Heracell 240i | Thermo Scientific | 51026331 | |
| Vacuum system, Vacusafe comfort | Integra Biosciences | 158320 | |
| Microscope, Axiovert 40 CFL | Zeiss | 451212 | |
| Pipet controller, accu-jet pro | Brand | 26303 | |
| Micropipet, Pipetman neo P20N (2-20 µl) | Gilson | F144563 | |
| Micropipet, Pipetman neo P200N (20-200 µl) | Gilson | F144565 | |
| Micropipet, Pipetman neo P1000N (100-1000 µl) | Gilson | F144566 |
References
- Herzenberg, L. A., et al. The History and Future of the Fluorescence Activated Cell Sorter and Flow Cytometry: A View from. 48 (10), 1819-1827 (2002).
- Chattopadhyay, P. K., Roederer, M. Cytometry: today’s technology and tomorrow's horizons. Methods (San Diego, Calif). 57 (3), 251-258 (2012).
- Jaye, D. L., Bray, R. A., Gebel, H. M., Harris, W. A. C., Waller, E. K. Translational applications of flow cytometry in clinical practice). J. Immunol. 188 (10), 4715-4719 (2012).
- Henel, G., Schmitz, J. Basic Theory and Clinical Applications of Flow Cytometry. Lab Med. 38 (7), 428-436 (2007).
- Seita, J., Weissman, I. L. Hematopoietic stem cell: self-renewal versus differentiation. Wiley Interdiscip. Rev. Syst. Biol. Med. 2 (6), 640-653 (2010).
- Ulrich, H., Bocsi, J. Phenotypes of stem cells from diverse origin. Cytometry. A. 77 (1), 6-10 (2010).
- Panchision, D. M., et al. Optimized flow cytometric analysis of central nervous system tissue reveals novel functional relationships among cells expressing CD133, CD15, and CD24. Stem cells. 25 (6), 1560-1570 (2007).
- Meyer, R. A., Zaruba, M. E., McKhann, G. M. Flow cytometry of isolated cells from the brain. Anal. Quant. Cytol. 2 (1), 66-74 (1980).
- Junger, H., Junger, W. G. CNTF and GDNF, but not NT-4, support corticospinal motor neuron growth via direct mechanisms. Neuroreport. 9 (16), 3749-3754 (1998).
- McLaren, F. H., Svendsen, C. N., Vander Meide, P., Joly, E. Analysis of neural stem cells by flow cytometry: cellular differentiation modifies patterns of MHC expression. J. Neuroimmunol. 112 (1-2), 35-46 (2001).
- Wang, S., Roy, N. S., Benraiss, A., Goldman, S. A. Promoter-based isolation and fluorescence-activated sorting of mitotic neuronal progenitor cells from the adult mammalian ependymal/subependymal. 22 (1-2), 167-176 (2000).
- Tanke, H. J., vander Keur, M. Selection of defined cell types by flow-cytometric cell sorting. Trends Biotechnol. 11 (2), 55-62 (1993).
- Baumgarth, N., Roederer, M. A practical approach to multicolor flow cytometry for immunophenotyping. J. Immunol. Methods. 243 (1-2), 77-97 (2000).
- Sergent-Tanguy, S., Chagneau, C., Neveu, I., Naveilhan, P. Fluorescent activated cell sorting (FACS): a rapid and reliable method to estimate the number of neurons in a mixed population. J. Neurosci. Methods. 129 (1), 73-79 (2003).
- Ernst, A., et al. Neurogenesis in the striatum of the adult human brain. Cell. 156 (5), 1072-1083 (2014).
- Perfetto, S. P., Chattopadhyay, P. K., Roederer, M. Seventeen-colour flow cytometry: unravelling the immune system. Nat. Rev. Immunol. 4 (8), 648-655 (2004).
- Bandura, D. R., et al. Mass cytometry: technique for real time single cell multitarget immunoassay based on inductively coupled plasma time-of-flight mass spectrometry. Anal. Chem. 81 (16), 6813-6822 (2009).
- Bendall, S. C., et al. Single-cell mass cytometry of differential immune and drug responses across a human hematopoietic continuum. Science. 332 (6030), 687-696 (2011).
- Neveu, I., Rémy, S., Naveilhan, P. The neuropeptide Y receptors, Y1 and Y2, are transiently and differentially expressed in the developing cerebellum. Neuroscience. 113 (4), 767-777 (2002).
- Pruszak, J., Just, L., Isacson, O., Nikkhah, G. Isolation and culture of ventral mesencephalic precursor cells and dopaminergic neurons from rodent brains. Curr. Protoc. Stem Cell Biol. 2 (Unit 2D.5), (2009).
- Suslov, O. N., Kukekov, V. G., Ignatova, T. N., Steindler, D. A. Neural stem cell heterogeneity demonstrated by molecular phenotyping of clonal neurospheres. Proc. Natl. Acad. Sci. U.S.A. 99 (22), 14506-14511 (2002).
- Bez, A., et al. Neurosphere and neurosphere-forming cells: morphological and ultrastructural characterization. Brain Res. 993 (1-2), 18-29 (2003).
- Pruszak, J., Isacson, O. Molecular and cellular determinants for generating ES-cell derived dopamine neurons for cell therapy. Adv. Exp. Med. Biol. 651, 112-123 (2009).
- Carson, C. T., Aigner, S., Gage, F. H. Stem cells: the good, bad and barely in control. Nat. Med. 12 (11), 1237-1238 (2006).
- Yuan, S. H., et al. Cell-surface marker signatures for the isolation of neural stem cells, glia and neurons derived from human pluripotent stem cells. PloS One. 6 (3), e17540 (2011).
- Roy, N. S., Cleren, C., Singh, S. K., Yang, L., Beal, M. F., Goldman, S. Functional engraftment of human ES cell-derived dopaminergic neurons enriched by coculture with telomerase-immortalized midbrain astrocytes. Nat. Med. 12 (11), 1259-1268 (2006).
- Uchida, N., et al. Direct isolation of human central nervous system stem cells. Proc. Natl. Acad. Sci. U. S. A. 97 (26), 14720-14725 (2000).
- Pruszak, J., Ludwig, W., Blak, A., Alavian, K., Isacson, O. CD15, CD24, and CD29 define a surface biomarker code for neural lineage differentiation of stem cells. Stem Cells. 27 (12), 2928-2940 (2009).
- Peh, G. S. -. L., Lang, R. J., Pera, M. F., Hawes, S. M. CD133 expression by neural progenitors derived from human embryonic stem cells and its use for their prospective isolation. Stem Cells Dev. 18 (2), 269-282 (2009).
- Golebiewska, A., Atkinson, S. P., Lako, M., Armstrong, L. Epigenetic landscaping during hESC differentiation to neural cells. Stem Cells. 27 (6), 1298-1308 (2009).
- Dietrich, J., Noble, M., Mayer-Proschel, M. Characterization of A2B5+ glial precursor cells from cryopreserved human fetal brain progenitor cells. Glia. 40 (1), 65-77 (2002).
- Nishiyama, A. NG2 cells in the brain: a novel glial cell population. Hum. Cell. 14 (1), 77-82 (2001).
- Jungblut, M., et al. Isolation and characterization of living primary astroglial cells using the new GLAST-specific monoclonal antibody ACSA-1. Glia. 60 (6), 894-907 (2012).
- Ono, Y., et al. Differences in neurogenic potential in floor plate cells along an anteroposterior location: midbrain dopaminergic neurons originate from mesencephalic floor plate cells. Development. 134 (17), 3213-3225 (2007).
- Chung, S., et al. ES cell-derived renewable and functional midbrain dopaminergic progenitors. Proc. Natl. Acad. Sci. U.S.A. 108 (23), 9703-9708 (2011).
- Doi, D., et al. Isolation of Human Induced Pluripotent Stem Cell-Derived Dopaminergic Progenitors by Cell Sorting for Successful Transplantation. Stem Cell Reports. 2 (3), 337-350 (2014).
- Solozobova, V., Wyvekens, N., Pruszak, J. Lessons from the embryonic neural stem cell niche for neural lineage differentiation of pluripotent stem cells. Stem Cell Rev. 8 (3), (2012).
- Turaç, G., et al. Combined flow cytometric analysis of surface and intracellular antigens reveals surface molecule markers of human neuropoiesis. PloS One. 8 (6), e68519 (2013).
- Buchwalow, I. B., Böcker, W. Chapter 2. Immunohistochemistry: Basics and Methods. , 9-17 (2010).
- Tario, J. D., et al. Optimized staining and proliferation modeling methods for cell division monitoring using cell tracking dyes. J. Vis. Exp. (70), e4287 (2012).
- Lyons, A. B., Parish, C. R. Determination of lymphocyte division by flow cytometry. J. Immunol. Methods. 171 (1), 131-137 (1994).
- Hawkins, E. D., et al. Measuring lymphocyte proliferation, survival and differentiation using CFSE time-series data. Nat. Protoc. 2 (9), 2057-2067 (2007).
- Quah, B. J. C., Parish, C. R. The use of carboxyfluorescein diacetate succinimidyl ester (CFSE) to monitor lymphocyte proliferation. J. Vis. Exp. 44, (2010).
- Sukhdeo, K., et al. Multiplex flow cytometry barcoding and antibody arrays identify surface antigen profiles of primary and metastatic colon cancer cell lines. PloS One. 8 (1), e53015 (2013).
- Jiang, L., et al. Daucosterol promotes the proliferation of neural stem cells. The J. Steroid Biochem. Mol. Biol. 140, 90-99 (2014).
- Hulspas, R., et al. Considerations for the control of background fluorescence in clinical flow cytometry. Cytometry. B. 76 (6), 355-364 (2009).
- Moloney, M., Shreffler, W. G. Basic science for the practicing physician: flow cytometry and cell sorting. Annals of Allergy, Asthm., & Immunology: Official Publication of the American College of Allergy, Asthma., & Immunology. 101 (5), 544-549 (2008).
- Siebzehnrubl, F. A., et al. Isolation and characterization of adult neural stem cells. Methods Mol. Biol. 750, 61-77 (2011).
- Guez-Barber, D., et al. FACS purification of immunolabeled cell types from adult rat brain). J. Neurosci. Methods. 203 (1), 10-18 (2012).
- Tham, C. -. S., Lin, F. -. F., Rao, T. S., Yu, N., Webb, M. Microglial activation state and lysophospholipid acid receptor expression. Int. J. Dev. Neurosci. 21 (8), 431-443 (2003).
- Nguyen, H. X., Beck, K. D., Anderson, A. J. Quantitative assessment of immune cells in the injured spinal cord tissue by flow cytometry: a novel use for a cell purification method. J. Vis. Exp. (50), e2698 (2011).
- Marchenko, S., Flanagan, L. Counting human neural stem cells. J. Vis. Exp. (7), 262 (2007).
- Brunlid, G., Pruszak, J., Holmes, B., Isacson, O., Sonntag, K. C. Immature and neurally differentiated mouse embryonic stem cells do not express a functional Fas/Fas ligand system. Stem Cells. 25 (10), 2551-2558 (2007).
- Brewer, G. J. Isolation and culture of adult rat hippocampal neurons. J. Neurosci. Methods. 71 (2), 143-155 (1997).
- Cardona, A. E., Huang, D., Sasse, M. E., Ransohoff, R. M. Isolation of murine microglial cells for RNA analysis or flow cytometry. Nat. Protoc. 1 (4), 1947-1951 (2006).
- Nielsen, J. A., Maric, D., Lau, P., Barker, J. L., Hudson, L. D. Identification of a novel oligodendrocyte cell adhesion protein using gene expression profiling. J. Neurosci. 26 (39), 9881-9891 (2006).
- Daneman, R., et al. The mouse blood-brain barrier transcriptome: a new resource for understanding the development and function of brain endothelial cells. PloS One. 5 (10), e13741 (2010).
- Gräbner, R., Till, U., Heller, R. Flow cytometric determination of E-selectin, vascular cell adhesion molecule-1, and intercellular cell adhesion molecule-1 in formaldehyde-fixed endothelial cell monolayers. Cytometry. 40 (3), 238-244 (2000).
- Quah, B. J. C., Parish, C. R. New and improved methods for measuring lymphocyte proliferation in vitro and in vivo using CFSE-like fluorescent dyes. J. Immunol. Methods. 379 (1-2), 1-14 (2012).
- Lathia, J. D., et al. High-throughput flow cytometry screening reveals a role for junctional adhesion molecule a as a cancer stem cell maintenance factor. Cell Rep. 6 (1), 117-129 (2014).
- Ganat, Y. M., et al. Identification of embryonic stem cell-derived midbrain dopaminergic neurons for engraftment. J. Clin. Invest. 122 (8), 2928-2939 (2012).
- Hedlund, E., et al. Embryonic stem cell-derived Pitx3-enhanced green fluorescent protein midbrain dopamine neurons survive enrichment by fluorescence-activated cell sorting and function in an animal model of Parkinson’s disease. Stem Cells. 26 (6), 1526-1536 (2008).
- Maroof, A. M., et al. Directed differentiation and functional maturation of cortical interneurons from human embryonic stem cells. Cell Stem Cell. 12 (5), 559-572 (2013).
- Chivet, M., Hemming, F., Pernet-Gallay, K., Fraboulet, S., Sadoul, R. Emerging role of neuronal exosomes in the central nervous system. Front. Physiol. 3, 145 (2012).
- Graner, M. W., et al. Proteomic and immunologic analyses of brain tumor exosomes. FASEB J. 23 (5), 1541-1557 (2009).
- Eldh, M., Lötvall, J. Isolation and characterization of RNA-containing exosomes. J. Vis. Exp. (59), e3037 (2012).
- Capela, A., Temple, S. LeX is expressed by principle progenitor cells in the embryonic nervous system, is secreted into their environment and binds Wnt-1. Dev. Biol. 291 (2), 300-313 (2006).
- Nieoullon, V., Belvindrah, R., Rougon, G., Chazal, G. mCD24 regulates proliferation of neuronal committed precursors in the subventricular zone. Mol. Cell. Neurosci. 28 (3), 462-474 (2005).
- Nagato, M., et al. Prospective characterization of neural stem cells by flow cytometry analysis using a combination of surface markers. J. Neurosci. Res. 80 (4), 456-466 (2005).
- Hall, P. E., Lathia, J. D., Miller, N. G. A., Caldwell, M. A., French-Constant, C. Integrins are markers of human neural stem cells. Stem Cells. 24 (9), 2078-2084 (2006).
- Hargus, G., et al. Differentiated Parkinson patient-derived induced pluripotent stem cells grow in the adult rodent brain and reduce motor asymmetry in Parkinsonian rats. Proc. Natl. Acad. Sci. U.S.A. 107 (36), 15921-15926 (2010).
- Elkabetz, Y., et al. Human ES cell-derived neural rosettes reveal a functionally distinct early neural stem cell stage. Genes Dev. 22 (2), 152-165 (2008).
Reprints and Permissions
Request permission to reuse the text or figures of this JoVE article
Request PermissionThis article has been published
Video Coming Soon
Copyright © 2025 MyJoVE Corporation. All rights reserved