
A subscription to JoVE is required to view this content. Sign in or start your free trial.
Method Article
An Endothelial Planar Cell Model for Imaging Immunological Synapse Dynamics
In This Article
Summary
Adaptive immunity is controlled by dynamic 'immunological synapses' formed between T cells and antigen presenting cells. This protocol describes methods for investigating endothelial cells both as understudied physiologic APCs and as a novel type of 'planar cellular APC model'.
Abstract
Adaptive immunity is regulated by dynamic interactions between T cells and antigen presenting cells ('APCs') referred to as 'immunological synapses'. Within these intimate cell-cell interfaces discrete sub-cellular clusters of MHC/Ag-TCR, F-actin, adhesion and signaling molecules form and remodel rapidly. These dynamics are thought to be critical determinants of both the efficiency and quality of the immune responses that develop and therefore of protective versus pathologic immunity. Current understanding of immunological synapses with physiologic APCs is limited by the inadequacy of the obtainable imaging resolution. Though artificial substrate models (e.g., planar lipid bilayers) offer excellent resolution and have been extremely valuable tools, they are inherently non-physiologic and oversimplified. Vascular and lymphatic endothelial cells have emerged as an important peripheral tissue (or stromal) compartment of 'semi-professional APCs'. These APCs (which express most of the molecular machinery of professional APCs) have the unique feature of forming virtually planar cell surface and are readily transfectable (e.g., with fluorescent protein reporters). Herein a basic approach to implement endothelial cells as a novel and physiologic 'planar cellular APC model' for improved imaging and interrogation of fundamental antigenic signaling processes will be described.
Introduction
T lymphocytes are a branch of the adaptive immune system characterized by the ability to efficiently recognize peptide antigen (Ag) bound to major histocompatibility complex (MHC) molecules through their T cell receptors (TCRs) 1. Naïve lymphocytes constitutively migrate and scan 'professional Ag presenting cells' (APCs; e.g., dendritic cells) within lymph nodes, while memory/effector T cells need to effectively survey an extremely wide range of APCs and potential target cells within peripheral tissues.
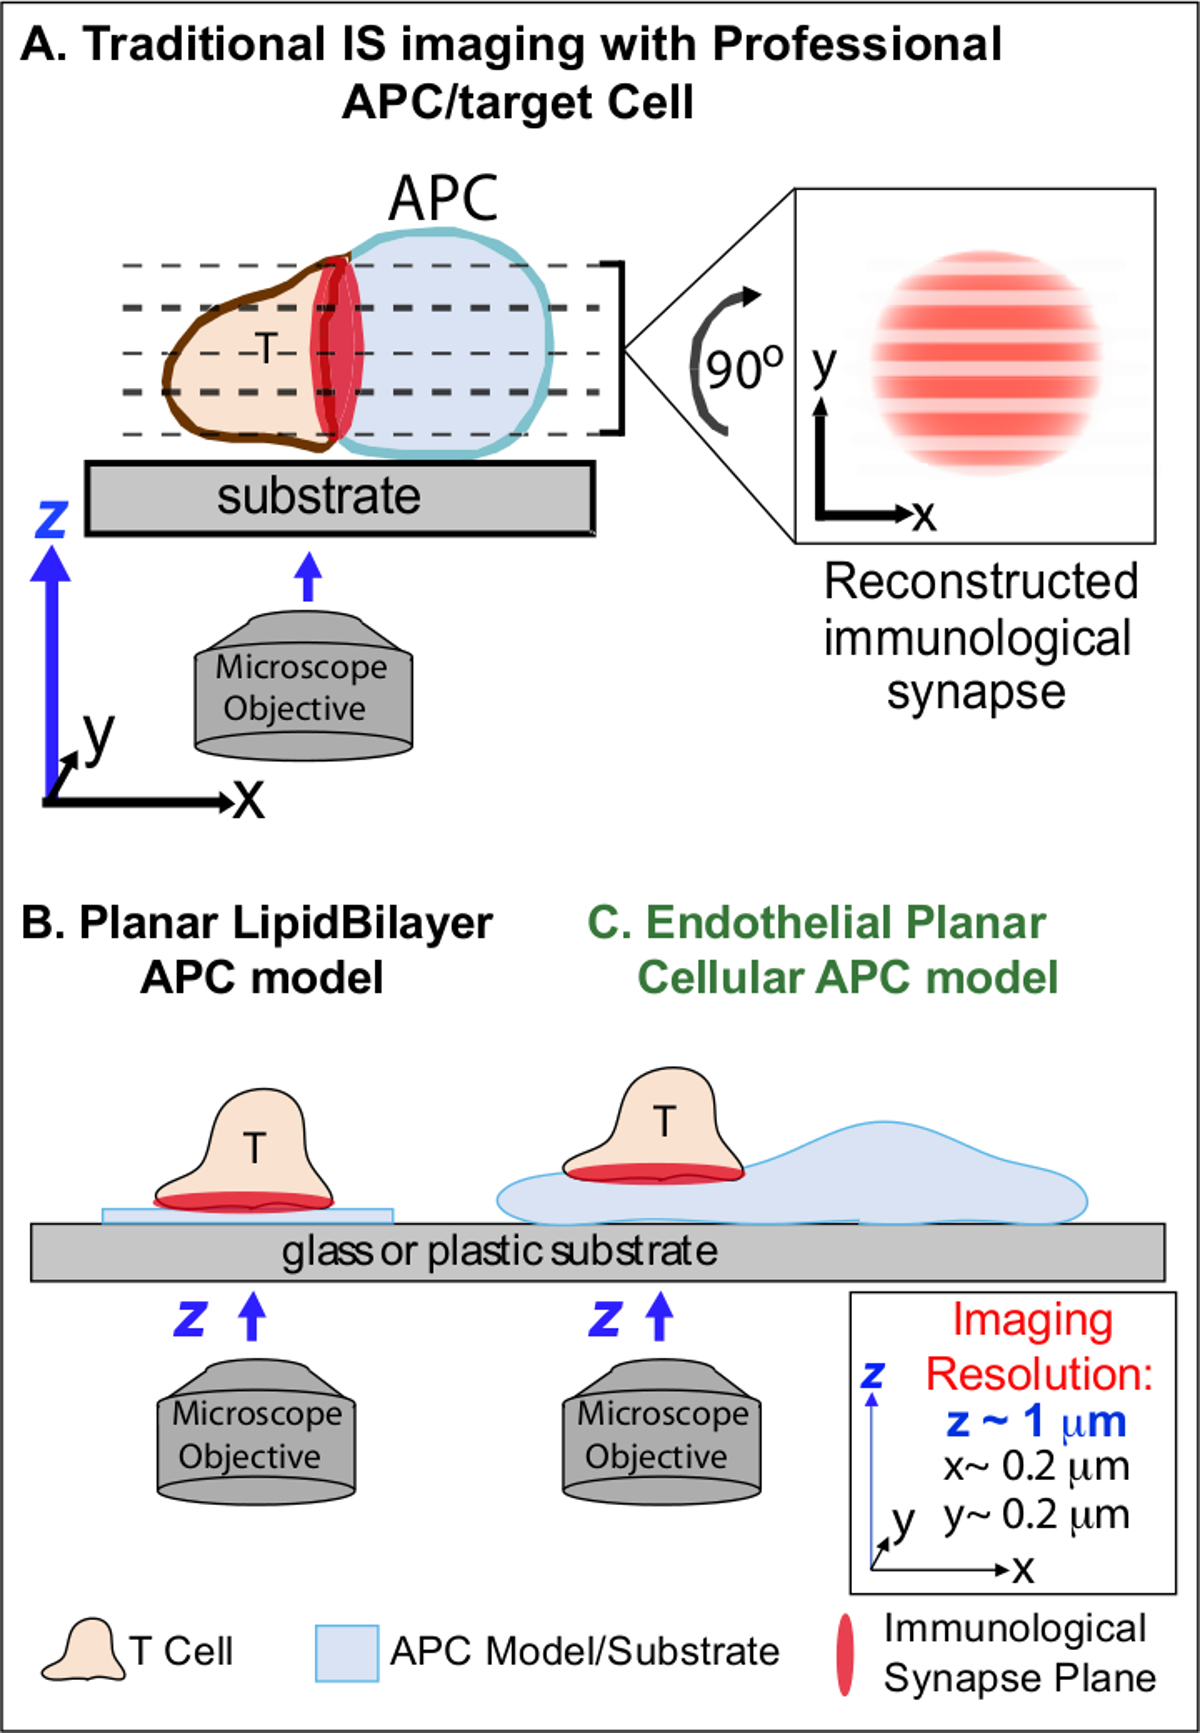
In the min following initial recognition of cognate Ag on an APC, lymphocytes arrest their migration and begin to form a specialized intimate cell-cell interface termed 'immunological synapse' (IS). Sustained (i.e., 30-60 min) IS contacts are required to amplify and sustain signaling 2-7. Emerging studies identify that within the IS, it is the continuous formation and rapid remodeling of discrete sub-cellular signaling micro-clusters (i.e., containing MHC/Ag-TCR, F-actin, adhesion and signaling molecules) that determine the strength and quality of resulting immune responses 2-7. However, dynamic details and regulatory mechanism of this process are incompletely understood 8,9. This stems largely from technical challenges associated with irregular topologies of APC surfaces and poorly controlled orientation of the cell-cell interaction planes, issues that profoundly limit the requisite spatiotemporal imaging approaches 8-10 (Figure1A).

Figure 1. A Physiologic Planar Cell APC Model for Imaging Immunological Synapse Dynamics. The schematic illustrates traditional imaging of immunological synapse between a T cell and a professional APC (A) and T cell and a traditional planar lipid bilayer APC model (B) in comparison to this novel endothelial planar APC model (C). Professional APCs provide physiologic immunological synapses but offer poorly oriented cell-cell interface (i.e., with respect to the optimal x-y imaging plane; resolution ~0.2 μm), which dramatically compromises spatial (z imaging plane resolution ~1 μm) and temporal (i.e., due to the need to repeatedly scan through all z imaging planes) resolution of imaging. Bilayer models have a planar topology that provides optimal spatiotemporal imaging resolution, but are also highly simplified, non-physiological and rigid. This endothelial cell model combines the planar topology of lipid bilayers with the physiologic substrate of a classic APC to deliver optimal spatial and temporal imaging resolution in a physiologic setting. Please click here to view a larger version of this figure.
Previous work has partially circumvented these obstacles by developing planar substrate models (i.e., lipid bilayers and antibody-coated surfaces) that provide optimal spatiotemporal resolution (i.e., via fixing the T cell activation surface into a single plan that is parallel to the optimal x-y imaging plane) 11-15 (Figure 1B). These models have facilitated important insights into the subcellular/molecular dynamics that control antigenic signaling in T cells, including the discovery of dynamic actin/TCR signaling micro-clusters 7,11-14. However, such models are inherently oversimplified, as well as rigid (precluding the development/study of 3-dimensional topological features) (Figure 1B). Therefore, it remains uncertain how to relate such findings to physiologic cell-cell immune surveillance.
Though still understudied, vascular and lymphatic endothelial cells are emerging as a large (i.e., greater in numbers than all professional APCs, by ~1,000-fold) peripheral compartment of 'semi-professional' APCs 16-18. These cells express MHC-I-, MHC-II- and a multitude of co-stimulator molecules (e.g., CD40, LFA3, ICOSL, 4-1BB, OX40L, TL1A, PD-L1; but not CD80 and CD86) and are strategically positioned at the blood-tissue interface where they serve specialized sentinel functions 16-18. Previous studies demonstrated that endothelial cells can effectively re-stimulate effector/memory, but not naïve, T cells 19-25. Thus, endothelial cells are likely to play unique APC roles in effector phase of adaptive immune responses within the peripheral tissues, such as local influence on T cell activation, differentiation, memory and tolerance 16,17,26. Critically, when grown in vitro, endothelial cells form virtually planar cell surfaces and are readily transfectable (e.g., with fluorescent protein reporters). These features are ideal for high spatiotemporal resolution imaging of topological dynamics during cell-cell interactions 19,27. Thus endothelial cells might serve as a physiologic 'planar cellular APC' model distinctly suited for the study of the subcellular/molecular remodeling mechanisms that drive antigen recognition and regulate responses (Figure 1C) 19,20.
Previously established complementary imaging techniques (including transfection of endothelia cells with fluorescent protein makers of the plasma membrane and cytosol) for studying the details of leukocyte-endothelial interaction during adhesion and transendothelial migration 27, showed that leukocytes actively probe the surface of the endothelium by dynamic insertion and retraction of sub-micron-scale, actin-rich cylindrical protrusions (~200-1,000 nm in diameter and depth) termed invadosome-like protrusions (i.e., 'ILPs') 27,28. These imaging approaches have been further expanded along with the creation of protocols to take advantage of endothelial APC function to develop the first methods for high spatiotemporal resolution imaging of the T cell-endothelial immunological synapse as reported 19,20 and further describe herein. A central finding derived from this novel planar cellular APC model is that T cell ILPs function both in promoting initial Ag detection and in sustaining subsequent signaling. Indeed, arrays of multiple ILPs (that were stabilized and accrued in response to initial calcium flux) show enrichment in TCR and molecules suggestive of active signaling such PKC-Q, ZAP-70, phosphotyrosine and HS1. Therefore, ILPs seem to represent a three-dimensional physiologic equivalent to the TCR-signaling microclusters seen in planar bilayer models. This approach, thus, sensitively reveals/reports molecular and architectural (and implied biomechanical) dynamics not otherwise detectable.
The method described herein should be useful to bridging the gap between professional APC and artificial APC substrate models in order to enhance our ability to interrogate basic mechanisms of adaptive immune responses. While here the focus is on the activation of CD4+ Th1-type effector/memory cell, this basic approach can be readily modified to study a wide range of T cell types and Ags, as discussed below.
Protocol
All experiments described in this protocol are conducted with primary human T cells and commercially available primary human endothelial cells (dermal or lung microvascular ECs).Any research protocol involving human subjects must be approved by an institutional review board and written informed consent must be provided from each blood donor. Experiments conducted using this protocol were approved by the IRB of Beth Israel Deaconess Medical Center.
1. Preparing Human CD4+ Th1 Effector/Memory T Cells
- Apply tourniquet to the arm of donor, wipe vein with alcohol, and insert needle. Slowly draw 15 ml of blood into vacutainer using EDTA as anticoagulant. When the blood has been drawn, untie the tourniquet before removing the needle. Immediately apply pressure to wound with sterile gauze when needle is removed.
- Transfer blood to a 50 ml tube. Add RPMI-1640 at RT at a 1:1 dilution (final volume 30 ml). Carefully overlay the diluted blood onto two 50 ml tubes containing 15 ml of pre-filtered lymphocytes isolation medium such as Ficoll-Paque at RT.
- Centrifuge the gradient at RT for 30 min at 1,200 x g in a swinging bucket rotor. While centrifuging prepare T cell medium (500 ml of RPMI-1640, 50 ml FCS, 5 ml penicillin/streptomycin).
- Upon removal of the 50 ml tube from the centrifuge, observe four layers: a pellet of red blood cells in the bottom, the paque, a layer of cells which contains white blood cells (including lymphocytes) and the plasma. Carefully remove the white blood cell layer with a pasteur pipette and transfer in a 50 ml Falcon tube.
- Wash the white blood cell layer by adding RT RPMI-1460 (up to 20 ml) and centrifuging at RT for 5 min at 1,200 x g. Resuspend the white blood cells in 1 ml of T cell medium. Add 5 µl of the 1 ml cell suspension to 250 µl T cell medium in a 1.5 ml centrifuge tube and mix gently up and down by pipette.
- Add 25 µl diluted cell suspension to 25 µl 0.4% Trypan blue. Add 10 µl of mixture to each side of a standard hemocytometer.
- Place hemocytometer on a low power light microscope. Using a 10X objective count the number of living cells that have excluded the Trypan blue dye and are present in the middle square of both sides of the hemocytometer.
- To calculate the cell concentration, multiply the average of the 2 squares by 100 (dilution factor) and then multiply by 104 to give the number of cells/ml.
- Adjust the final concentration to 0.5 x 10⁶ cells/ml in T cell medium. Add a final concentration of 1 µg/ml each of bacterial superantigens staphylococcal enterotoxin B (SEB) and toxic shock syndrome toxin 1 (TSST) to the cells. Culture for 72 hr (37 °C and 5% CO2) to expand the CD4+ T cell population.
- Pellet T cells (1,200 x g, 5 min) and resuspend at 0.5 x 10⁶ cells/ml in T cell medium with the addition of human IL-15 (20 ng/ml). Transfer lymphocytes to a T150 flask. Continue to expand/split cells in full medium-IL-15 every 24-48 hr as needed (based on media color; i.e., whenever media turns from pink to slightly yellow) thereafter. Maintain the resulting lymphocyte population for up to 15 days.
NOTE: By design, this protocol will activate and expand specifically subset of CD4+ T cells that are reactive to SEB and TSST and then drive them toward a Th1-like effector/memory phenotype. Other white blood cells fail to survive and grow under these conditions, such that by step 1.10 the cells will be at least 95% CD4+, CD45RO+ T cells 19, as can readily be assessed by flow cytometry. If desired, further purification can readily be achieved through commercially available antibody/magnetic-bead based positive or negative selection kits.
2. Starting Primary Human Endothelial Cell Culture
- Coat a T25 flask with fibronectin (FN) 20 µg/ml in PBS in sterile conditions. Leave at RT for 30-60 min. Remove FN and add 5 ml complete medium (Endothelial Basal Medium (EBM-2) medium supplemented with Endothelial Growth Medium (EGM-2) singlequots). Pre-incubate in 37 °C cell culture incubator for at least 30 min.
- Thaw a vial of frozen human lung or dermal microvascular endothelial cells (HLMVECs or HDMVECs) in a 37 °C water bath with occasional gentle agitation for ~2-3 min. Immediately transfer cells to T25 flask containing pre-warmed media. Gently swirl and place in incubator at 37 °C.
- Change the media after ~4-6 hr. Continue to change media approximately every 48 hr (or when media becomes slightly yellow) until plate reaches ~90-95% confluency.
3. General Splitting and Expansion of Endothelial Cells
- Grow cells to ~90-95 confluency. This may take 2-5 days. For splitting, remove media and rinse with PBS. Remove PBS and replace with minimum volume of fresh 1x trypsin (0.5 ml for T25 or 1.5 ml for T75). Gently swirl to cover all surface with trypsin. Incubate at 37 °C for ~5 min. Monitor the detachment of the cells from the plate using a low power light microscope.
- When majority of cells appear rounded or detached, add 5 volume (i.e., compared to the trypsin volume added) of pre-warmed complete EGM-2 medium and gently pipette over the surface of the flask to detach all cells.
- Count endothelial cells with a hemocytometer as described in 1.6-1.7. Pellet the cells by centrifugation (5 min, 1,200 x g). Remove the supernatant. Adjust concentration to 0.5 million cells per ml by addition of pre-warmed complete EGM-2 MV media.
- Transfer aliquots of cells to the appropriate FN-coated dishes or flasks for maintenance. Gently swirl and place in the incubator. Change the media within 6-12 hr of plating. Media should be changed approximately every 48 hr thereafter.
4. Endothelial Cell Transfection
NOTE: Primary endothelial cells are refractory to transfection by most common chemical and electroporation methods. The nuclear transfection-based method described below allows for relatively high transfection efficiency (~50-70%). An effective alternative method is use of infection by appropriate viral vectors (see comments in Materials Table).
- Prepare T25 or T75 flasks (as needed) of HLMVECs or HDMVECs to a final density of 90-95% confluency.Coat with fibronectin (FN) 20ug/ml in PBS in sterile conditions either microscope culture plates such as Delta-T plates (for step 5) or 12 mm circular glass coverslips placed inside a well of a 24-well cell culture plate (for step 6) with as described above (2.1).
- Add 1 ml of complete EGM-2 culture media to microscope culture platesor 0.5 ml to each 24 well and equilibrate plates in a humidified 37 °C/5% CO2 incubator.
- Harvest and count endothelial cells as in steps 3.1-3.3.Centrifuge the required volume of cells (0.5 million cells per sample) at 1,200 x g for 5 min at RT. Resuspend the cell pellet carefully in 100 µl RT nuclear transfection solution per sample.
- Combine 100 µl of cell suspension with 1-5 µg DNA. Transfer cell/DNA suspension into certified cuvette; sample must cover the bottom of the cuvette without air bubbles.
NOTE: Constructs targeting YFP or DsRed to the cell membrane (through the N-terminal 20 amino acids of neuromodulin that contains a signal for posttranslational palmitoylation) were used alone ( membrane-YFP alone or membrane-DsRed alone) or co-transfected with a cytoplasmic volumetric marker (e.g., membrane-YFP and soluble DsRed). Many permutations of fluorescent protein markers can be used. - Close the cuvette with the cap. Insert the cuvette with cell/DNA suspension into the cuvette holder of the electroporator and apply electroporation program S-005. Take the cuvette out of the holder once the program is finished.
- Add ~500 µl of the pre-equilibrated culture media to the cuvette and gently remove the cell suspension from the cuvette using the plastic transfer pipettes provided in the nuclear transfection kit.
- For experiments using microscope culture plates partition the cell suspension from one reaction equally between two dishes containing pre-warmed media (Steps 4.2-4.3). For experiments using 24 well/plate, partition one reaction equally between 3 wells.
- Incubate the cells in a humidified 37 °C/5% CO2 incubator and change media 4-6 hr, and again at 12-16 hr post-transfection.
5. Live Cell Imaging and Analysis
- Preparing Endothelium
- Day 0: Co-transfect primary HLMVECs with membrane-YFP and soluble DsRed via a nucleofection technology as described in step 4 and plate onto live-cell imaging culture plates.
- Day 1: Replace medium with fresh medium containing IFN-γ (100 ng/ml) to induce MHC-II expression. On Day 2. Stimulate transfected cells by addition of 20 ng/ml TNF-α to the existing media.
- On Day 3, incubate the endothelium with 1 µg/ml each of bacterial superantigens staphylococcal enterotoxin B (SEB) and toxic shock syndrome toxin 1 (TSST) at 37 °C for 30-60 min immediately prior to experiments. Omit this step for '-Ag' control conditions.
- Preparing Lymphocytes
- In parallel with step 5.1.3, prepare Buffer A (phenol red-free HBSS) supplemented with 20 mM Hepes, pH 7.4 and 0.5% v/v human serum albumin pre-warmed to 37 °C. Take a sample of cultured lymphocytes and determine the density by counting with a hemocytometer (Step 1.12-1.17).
- Centrifuge 2 million cells per sample at 1,200 x g for 5 min at RT in a 15 ml conical tube. Aspirate media and gently resuspend cell pellet in 2 ml of Buffer A such that no cell clusters remain.
- Remove a fresh aliquot of Fura-2 calcium dye and resuspend in DMSO to make a stock concentration of 1 mM.
- Add 2 μl of Fura-2 stock solution to the T cell suspension (2 μM final concentration), cap the tube and mix immediately by inverting the tube to ensure even dispersion of dye. Incubate at 37 °C for 30 min.
- Centrifuge as in step 5.2.2. Aspirate Buffer-A and gently but thoroughly resuspend lymphocytes in 20-40 μl of fresh Buffer-A.
- Live-cell Imaging Setup and Acquisition
NOTE: A wide variety of systems can be employed for live-cell fluorescence imaging on upright and inverted light microscopes. Basic requirements include a fluorescence light source and filters, a CCD camera, motorized filter switching and shutters, a heated stage (or microscope-mountable heated chamber) and software for automated image acquisition. For this protocol high numerical aperture, high magnification (i.e., 40X, 63X) oil immersion lenses are required to achieve the necessary spatial resolution. Special care must be taken in choosing the appropriate fluorescence source and lenses for Fura-2-based calcium imaging as not all are compatible with the requisite 340/380 nm excitation wavelengths. An alternative approach (compatible with standard green and red fluorescence filter sets) can be used with non-ratiomentic calcium-sensitive dyes (e.g., Fluo-4, Rhod-3), though these cannot accurately quantitate calcium flux and only provide a relative/quantitative readout.- Turn on microscope system (PC for operation, microscope, CCD camera, filter wheel and xenon lamp).
- Open the designated software.
- Set up microscope/software for automated multichannel time-lapse imaging. Include sequential acquisition of a differential interference contrast (DIC), standard green fluorescence, standard red fluoresce and standard 340 and 380 nm excitation Fura-2 images. Set the interval for acquisition for 10-30 sec and a total duration of ~20-60 min.
- Set exposure times for Fura-2 imaging.
- Add fresh objective oil and mount a microscope dish containing only 0.5 ml of Buffer-A onto the heating stage adaptor and immediately turn on to equilibrate to 37 °C (will take ~2-3 min).
- Add resting Fura2-loaded lymphocytes to the mounted microscope dish chamber using a 20 μl pipette.
- Turn on bright field imaging. Select the light path to the eyepieces. Use the coarse focus knob to bring objective into contact with bottom of the miscoscope dish. Use the eyepiece and the fine focus knob to focus on the T cells settled at the bottom of the dish.
- Use the x-y stage controls to select a field containing at least 10 cells. Avoid over-crowded fields and cell clumps as these will create imaging artifacts.
- Switch from bright field to fluorescent light source. Switch from eyepiece imaging to CCD camera. Set acquisition parameters (e.g., exposure time, detector gain and binning). Using the software acquire resting Fura2-340 and Fura2-380 images (starting with identical exposure time for each, usually in the range of ~200-1,000 msec).
- Use the methods described in Step 5.4.1 to calculate the Fura2-340/Fura2-380 for each lymphocyte. Perform repeated iterations of adjusting the Fura2-340 and Fura2-380 exposure times, acquiring images and calculating ratios until the average values are close to 1.
- Set exposure times for mem-YFP and DsRed.
- Replace the microscope dish used in step 5.3.3.1 with a miscroscope dish containing transfected, activated and SAg treated (or untreated; control) HLMVECs or HDMVECs from cell culture incubator (Steps 4.5.1). Use a disposable transfer pipette to rapidly remove media, rinse one time by addition of ~1 ml of pre-warmed Buffer-A. Aspirate and then add 0.5 ml of Buffer-A.
- Identify fields in which brightly fluorescent positive transfectant endothelial cells are present and appear healthy with well-formed intercellular junctions.
- Adjust acquisition parameters (e.g., exposure time, detector gain and binning) for mem-YFP and DsRed. Be sure that mean fluorescence signal intensity in each channel falls between 25% and 75% of the dynamic range of the detector.
- Set exposure times for Fura-2 imaging.
- Conduct live-cell imaging experiment.
- Use automated software to begin image acquisition and capture several intervals of images to establish baseline.
- During acquisition apply ~5 μl of concentrated Fura-2-loaded lymphocytes (from step 5.2) to the center of the microscope dish imaging field by inserting the tip of a small volume (P-5 or P-20) pipette into the media close to the center of the objective and ejecting slowly.
- As lymphocytes settle into the imaging field, make fine adjustments in the focus to assure that the T cell-endothelia cell interface (immunological synapses) are maintained in the focal plane. With 40 and 63X objective, ~10-20 cells per field are optimal. If fewer cells are observed in the imaging field repeat step 5.3.4.2.
- After the desired observation interval of experiment is competed, continue imaging and immediately pipette ionomycin directly into the miscoscope dish (using technique as in 5.3.4.2) to a final concentration of 2 μM to induce maximal calcium flux/Fura-2 signaling signal (i.e., a means of calibration, See analysis 5.4.).
- As an alternative to 5.3.4.4after the desired observation interval of experiment is competed, immediately aspirate the Buffer-A and replace it with 0.5 ml fixative solution (3.7% formaldehyde in PBS) for 5 min at RT, followed by rinsing three times with PBS. Then proceed to step 6.
- Analysis of Live-cell Imaging
NOTE: After saving acquired files, they may be analyzed directly or exported for analysis by a wide variety of off-line image analysis software applications. ImageJ is a particularly valuable, highly versatile package that is freely available and compatible with almost every acquisition software package. The design of the imaging experiments described in steps 5.1-5.3 will yield high spatial and temporal resolution dynamics of interactions between lymphocytes and endothelial APC in the absence and presence of cognate SAg. Almost limitless analyses are possible when addressing imaging data of cellular morphometric/signaling dynamics. The specific objectives described in this particular protocol are to coordinately quantify lymphocyte migration and signaling (i.e., kinetics and levels of intracellular calcium flux) along with dynamical changes in the immunologic synapse architecture with focus on specific features (i.e., ILPs/podo-prints). The following are examples of separate standard and non-standard (i.e., developed specifically for these experiments/questions) analyses.- Measure Lymphocyte Calcium flux
- Select the initial Fura2-340 (340nmEX-510nmEM) and Fura2-380 (380nmEX-510nmEM) images that were acquired before addition of lymphocytes. Use these as background images and digitally subtract them from the all of the images in the time series for each respective channel.
- For each time point create a digital ratio image of the background-subtracted Fura2-340 and the background-subtracted Fura2-380 images (i.e., 340nmEX-510nmEM-background/380nmEX-510nmEM-background).
- Select the appropriate software drawing tool. Click on the screen to draw a circular region of interest (ROI) around each lymphocyte. These will generate a pixel-averaged ratio value for each lymphocyte and time frame.
- Plot the calculated ratio as a function of time using an appropriate software application (e.g., spreadsheet program). Calculate averaged calcium flux for the experiment by summing the ratio values of all of the lymphocytes per field and dividing that value by the total number of lymphocytes for each time point
- Conduct lympocyte migration tracking analysis.
- Analyze cell T cell migration using an appropriate cell tracking software application (e.g., ImageJ) using the DIC channel from each video. Using ImageJ Cell Tracking Plugin, identify in each frame the centroid of each cell manually by clicking on it in each progressive frame.
- Use the resulting serial x-y coordinates (i.e., traces of migration paths) to calculate the mean velocity (total distance migrated/total interval of imaging) and the tortuosity (total distance migrated/the linear end-to-end distance between the cell location in the first and last image).
- Cross-correlate these parameters with calcium flux (5.4.1) dynamics on a cell-by-cell basis.
- Assess the Podo-print/ILP Density within the IS
- Count total number of ILP formed in each T cell IS defined intervals (e.g., 5 min post addition of T cells). These can be identified discrete micron-scale fluorescent membrane-YFP rings that co-localize with dark circles in cytoplasmic DsRed on the endothelial APC at a site of lymphocyte adhesion.
- Cross-correlate the resulting 'ILP indexes' with calcium flux (5.4.1) dynamics on a cell-by-cell basis.
- Measure the podo-print/ILP lifetimes.
- For each podo-print/ILP in a given IS calculate its lifetimes as the last time point when an ILP was visible - the time point when that podo-print/ILP first appeared. Average ILP lifetimes both per IS.
- Cross-correlate these lifetimes with calcium flux (5.4.1) dynamics on a cell-by-cell basis.
- Assess the temporal relationship between initial ILP formation and calcium flux.
- For each lymphocyte identify the time point (frame) at which calcium first rises above baseline 19.
- For each lymphocyte identify the time point at which the first podo-print/ILP appears.
- For each lymphocyte calculate an 'offset time' by subtracting the initial calcium flux time point from that of the initial podo-print/ILP. Average the values for all lymphocytes in a field. Positive values indicate the ILP formation precedes calcium flux whereas negative numbers indicate the opposite.
NOTE: These experiments can readily be performed under physiologically relevant laminar shear flow using commercially available parallel-wall flow imaging chambers as described 19.
- Measure Lymphocyte Calcium flux
6. Fixed-cell Imaging and Analysis
- Fixed endpoint T cell-endothelial IS formation and Staining
- Prepare T cells as described in 1. Prepare endothelial cells (-/+ SAg) as in Step 5.1 (transfection, Step 5.1.1 is optional). Take a sample of cultured lymphocytes and determine the density by counting with a hemocytometer (Section 1).
- Transfer a lymphocyte culture volume equivalent to at least 3 x 10⁵ lymphocytes/sample to a 15 ml conical tube and centrifuge at 200 x g for 3 min. Remove the supernatant and resuspend the lymphocyte pellet in Buffer-A (Step 5.2.1) concentration of 6 x 10⁵ lymphocytes/ml.
- Remove the endothelial cells from the cell culture incubator and (proceeding one sample at a time) successively aspirate media and replace with 0.5 ml of lymphocyte suspension (3 x 10⁵ lymphocytes/sample) and replace to 37 °C incubator.
- After appropriate incubation times, noted above, aspirate medium from the wells and add sufficient Fixative Solution (3.7% formaldehyde in PBS) to completely cover the sample (e.g., in 24 well plate ~300-500 µl). Incubate at RT for 5-10 min.
- Rinse sample 3 times with PBS. Stain by adding primary antibody for 60 min at RT (see list). If the primary antibody is directed to an intracellular protein, an additional permeabilization step needs to be performed by adding sufficient permeabilization solution (0.01% TritonX-100 in PBS) to completely cover the sample for 1 min at RT. Rinse sample 3 times with PBS. Add appropriate secondary antibodies (in some cases concomitantly fluorescent phalloidin) for 60 min at RT.
- Mount the circular glass coverslip on an imaging slide. Fixed endpoint T cell-endothelial IS formation and Staining. To begin imaging place the imaging slide containing samples on the microscope stage and select the 63X oil objective. Apply fresh immersion oil.
- Use the bright-field imaging mode and ocular lenses to locate the focal plane. Switch to epifluorescence and inspect sample via the ocular lenses. Select a field of interest. Switch to laser-scanning mode.
- Using the fast-scan mode and working in the widest field possible individually adjust laser power and gain of each channel to optimize signal such that, ideally, the specific signal intensity reaches at least ~25% and not more than 75% of the dynamic range of the detectors.
- Using manual focus controls, quickly scan through the Z-axis and identify the upper and lower limits of sectioning (typically all of the information should be contained within a thickness of ~15 μm). Select the Z-axis section thickness in the range of ~0.2-1.0 µm.
- Finally, zoom/crop the imaging field to the specific region of interest and conduct scan. In addition to having very bright and specific fluorescence signal in the sample, acquiring high-resolution 3D-imaging requires iterations of scanning and making adjustments to acquisition parameters. The objective is to obtain maximal x-y and z-axis resolution, without appreciable photo-bleaching.
- Qualitatively analyze the topology of 3D topology of the IS by conducting digital 3D reconstruction of the resulting optical sections through an appropriate software application (e.g., Image J). Through similar applications quantitatively assess fluorescence signal distribution (e.g., Pearson's co-localization and correlative fluorescence intensity line-scan analysis and orthogonal viewing).
Results
A novel imaging approach using endothelial cells and combining the resolution advantages of the planar lipid bilayers model with the physiologic complexity and deformability of professional APCs was developed (Figure 1). Figure 2 provides examples of typical migration, calcium flux and topological dynamics observed with this approach. In the absence of SAg on endothelium, SAg-specific CD4+ Th1 lymphocytes rapidly spread, polarize and laterally ...
Discussion
Overall, this protocol describes methods for investigating endothelial cells as i) understudied physiologic APCs and ii) as a novel type of 'planar cellular APC model'. With respect to the former, it has become increasingly appreciated that non-hematopoietic peripheral (or 'stromal') APCs play critical, non-redundant roles (i.e., compared to hematopoietic APCs) in shaping adaptive immune responses 16-18. Among such 'semi-professional' APCs, vascular and lymphatic endothelial ce...
Disclosures
The authors have nothing to disclose.
Acknowledgements
We thank Dr. Peter T. Sage for his assistance in generating some of the representative images. This work was supported by an NIH R01 grant to C.V.C. (HL104006).
Materials
| Name | Company | Catalog Number | Comments |
| BD Vacutainer stretch latex free tourniquet | BD Biosciences | 367203 | |
| BD alcohol swabs | BD Biosciences | 326895 | |
| BD Vacutainer Safety-Lok | BD Biosciences | 367861 | K2 EDTA |
| BD Vacutainer Push Button Blood Collection Set | BD Biosciences | 367335 | |
| RPMI-1640 | Sigma-Aldrich | R8758-1L | |
| Ficoll-Paque | Sigma-Aldrich | GE17-1440-02 | Bring to RT before use |
| FCS-Optima | Atlanta Biologics | s12450 | Heat inactivated |
| Penicillin-Streptomycin | Sigma-Aldrich | P4458-100ML | |
| Trypan blue | Sigma-Aldrich | T8154-20ML | |
| staphylococcal enterotoxin B | Toxin Technology | BT202RED | Stock solution 1mg/ml in PBS |
| toxic shock syndrome toxin 1 | Toxin Technology | TT606RED | Stock solution 1mg/ml in PBS |
| human IL-15 | R&D Systems | 247-IL-025 | Stock solution 50ug/ml in PBS |
| PBS | Life Technologies | 10010-049 | |
| Fibronectin | Life Technologies | 33016-015 | Stock solution 1mg/ml in H20 |
| HMVEC-d Ad-Dermal MV Endo Cells | Lonza | CC-2543 | Other Human Microvascular ECs can be used, i.e. HLMVECs |
| EGM-2 MV bullet kit | Lonza | CC-3202 | |
| Trypsin-EDTA | Sigma-Aldrich | T-4174 | Stock solution 10x, dilute in PBS |
| amaxa-HMVEC-L Nucleofector Kit | Lonza | vpb1003 | Required Kit for step 4 |
| IFN-g | Sigma-Aldrich | I3265 | Stock solution 1mg/ml in H20 |
| TNF-alpha 10ug, human | Life Technologies | PHC3015 | Stock solution 1mg/ml in H20 |
| phenol Red-free HBSS | Life Technologies | 14175-103 | |
| Hepes | Fisher Scientific | BP299-100 | |
| Calcium Chloride | Sigma-Aldrich | C1016-100G | Stock solution 1M in H20 |
| Magnesium chloride | Sigma-Aldrich | 208337 | Stock solution 1M in H20 |
| Human Serum albumin | Sigma-Aldrich | A6909-10ml | |
| Immersol 518 F fluorescence free Immersion oil | Fisher Scientific | 12-624-66A | |
| Fura-2 AM 20x50ug | Life Technologies | F1221 | Stock solution 1mM in DMSO |
| pEYFP-Mem (Mem-YFP) | Clontech | 6917-1 | |
| pDsRed-Monomer (Soluble Cytoplasmic DsRed) | Clontech | 632466 | |
| pDsRed-Monomer Membrane (Mem-DsRed) | Clontech | 632512 | |
| pEGFP-Actin | Clontech | 6116-1 | |
| Alexa Fluor 488 Phalloidin | Life Technologies | A12379 | |
| Formaldehyde solution 37% | Fisher Scientific | BP531-500 | Toxic, use fumehood |
| Triton X-100 | Sigma-Aldrich | X100-5ML | |
| Falcon 15mL Conical Centrifuge Tubes | Fisher Scientific | 14-959-70C | |
| Falcon 50mL Conical Centrifuge Tubes | Fisher Scientific | 14-959-49A | |
| Falcon Tissue Culture Treated Flasks T25 | Fisher Scientific | 10-126-9 | |
| Falcon Tissue Culture Treated Flasks T75 | Fisher Scientific | 13-680-65 | |
| Corning Cell Culture Treated T175 | Fisher Scientific | 10-126-61 | |
| Glass coverslips | Fisher Scientific | 12-545-85 | 12 mm diameter |
| Falcon Tissue Culture Plates 24-well | Fisher Scientific | 08-772-1 | |
| Delta-T plates | Bioptechs | 04200415B | |
| Wheaton Disposable Pasteur Pipets | Fisher Scientific | 13-678-8D | |
| 1.5 ml Eppendorf tube | Fisher Scientific | 05-402-25 | |
| ICAM1 mouse anti-human | BD Biosciences | 555509 | |
| HS1 mouse anti-human | BD Biosciences | 610541 | |
| Anti-Human CD11a (LFA-1alpha) Purified | ebioscience | BMS102 | |
| Anti-Human CD3 Alexa Fluor® 488 | ebioscience | 53-0037-41 | |
| Anti-MHC Class II antibody | Abcam | ab55152 | |
| Anti-Talin 1 antibody | Abcam | ab71333 | |
| Anti-PKC theta antibody | Abcam | ab109481 | |
| phosphotyrosine (4G10 Platinum) | Millipore | 50-171-463 | |
| Nucleofector II | Amaxa Biosystems | Required electroporator for step 4 | |
| Zeiss Axiovert | Carl Zeiss MicroImaging | ||
| Zeiss LSM510 | Carl Zeiss MicroImaging | ||
| Zeiss Axiovison Software | Carl Zeiss MicroImaging | ||
| NU-425 (Series 60) Biological Safety Cabinet | NuAIRE | Nu-425-600 | |
| Forma STRCYCLE 37 °C, 5% CO2 Cell culture Incubator | Fisher Scientific | 202370 | |
| Centrifuge 5810 | Eppendorf | EW-02570-02 | |
| Hemocytometer | Sigma-Aldrich | Z359629 | Bright-Line Hemocytometer |
| Isotemp Waterbath model 202 | Fisher Scientific | 15-462-2 |
References
- von Andrian, U. H., Mackay, C. R. T-cell function and migration. Two sides of the same coin. N. Engl. J. Med. 343 (14), 1020-1034 (2000).
- Springer, T. A. Adhesion receptors of the immune system. Nature. 346 (6283), 425-434 (1990).
- Shaw, A. S., Dustin, M. L. Making the T cell receptor go the distance: a topological view of T cell activation. Immunity. 6 (4), 361-369 (1997).
- Monks, C. R., Freiberg, B. A., Kupfer, H., Sciaky, N., Kupfer, A. Three-dimensional segregation of supramolecular activation clusters in T cells. Nature. 395 (6697), 82-86 (1998).
- Delon, J., Stoll, S., Germain, R. N. Imaging of T-cell interactions with antigen presenting cells in culture and in intact lymphoid tissue. Immunol Rev. 189, 51-63 (2002).
- Brossard, C., et al. Multifocal structure of the T cell - dendritic cell synapse. Eur J Immunol. 35 (6), 1741-1753 (2005).
- Dustin, M. L. The cellular context of T cell signaling. Immunity. 30 (4), 482-492 (2009).
- Balagopalan, L., Sherman, E., Barr, V. A., Samelson, L. E. Imaging techniques for assaying lymphocyte activation in action. Nat Rev Immunol. 11 (1), 21-33 (2011).
- Cebecauer, M., Spitaler, M., Serge, A., Magee, A. I. Signalling complexes and clusters: functional advantages and methodological hurdles. J Cell Sci. 123, 309-320 (2010).
- Oddos, S., et al. High-speed high-resolution imaging of intercellular immune synapses using optical tweezers. Biophys J. 95 (10), L66-L68 (2008).
- Grakoui, A., et al. The immunological synapse: a molecular machine controlling T cell activation. Science. 285 (5425), 221-227 (1999).
- Bunnell, S. C., et al. T cell receptor ligation induces the formation of dynamically regulated signaling assemblies. J Cell Biol. 158 (7), 1263-1275 (2002).
- Yokosuka, T., et al. Newly generated T cell receptor microclusters initiate and sustain T cell activation by recruitment of Zap70 and SLP-76. Nat Immunol. 6 (12), 1253-1262 (2005).
- Seminario, M. C., Bunnell, S. C. Signal initiation in T-cell receptor microclusters. Immunol Rev. 221, 90-106 (2008).
- Dustin, M. L. Supported bilayers at the vanguard of immune cell activation studies. J Struct Biol. 168 (1), 152-160 (2009).
- Martinelli, R., Carman, C. V., Bradshaw, R. A., Stahl, P. Lymphocyte Endothelilal Interactions. Encyclopedia of Cell Biology. , (2015).
- Choi, J., Enis, D. R., Koh, K. P., Shiao, S. L., Pober, J. S. T lymphocyte-endothelial cell interactions. Annu Rev Immunol. 22, 683-709 (2004).
- Marelli-Berg, F. M., Jarmin, S. J. Antigen presentation by the endothelium: a green light for antigen-specific T cell trafficking?. Immunol Lett. 93 (2-3), 109-113 (2004).
- Sage, P. T., et al. Antigen recognition is facilitated by invadosome-like protrusions formed by memory/effector T cells. J Immunol. 188 (8), 3686-3699 (2012).
- Kumari, S., et al. Actin foci facilitate activation of the phospholipase C-gama in primary T lymphocytes via the WASP pathway . eLife. , (2015).
- Marelli-Berg, F. M., et al. Major histocompatibility complex class II-expressing endothelial cells induce allospecific nonresponsiveness in naive T cells. J Exp Med. 183 (4), 1603-1612 (1996).
- Ma, W., Pober, J. S. Human endothelial cells effectively costimulate cytokine production by, but not differentiation of, naive CD4+ T cells. J Immunol. 161 (5), 2158-2167 (1998).
- Perez, V. L., Henault, L., Lichtman, A. H. Endothelial antigen presentation: stimulation of previously activated but not naive TCR-transgenic mouse T cells. Cell Immunol. 189 (1), 31-40 (1998).
- Epperson, D. E., Pober, J. S. Antigen-presenting function of human endothelial cells. Direct activation of resting CD8 T cells. J Immunol. 153 (12), 5402-5412 (1994).
- Shiao, S. L., et al. Human effector memory CD4+ T cells directly recognize allogeneic endothelial cells in vitro and in vivo. J Immunol. 179 (7), 4397-4404 (2007).
- Marelli-Berg, F. M., Okkenhaug, K., Mirenda, V. A two-signal model for T cell trafficking. Trends Immunol. 28 (6), 267-273 (2007).
- Carman, C. V., et al. Transcellular diapedesis is initiated by invasive podosomes. Immunity. 26 (6), 784-797 (2007).
- Carman, C. V. Mechanisms for transcellular diapedesis: probing and pathfinding by 'invadosome-like protrusions'. J Cell Sci. 122 ((Pt 17)), 3025-3035 (2009).
- Dustin, M. L., Tseng, S. Y., Varma, R., Campi, G. T. T cell-dendritic cell immunological synapses. Curr Opin Immunol. 18 (4), 512-516 (2006).
- Saito, T., Yokosuka, T. Immunological synapse and microclusters: the site for recognition and activation of T cells. Curr Opin Immunol. 18 (3), 305-313 (2006).
- Gomez, T. S., et al. HS1 functions as an essential actin-regulatory adaptor protein at the immune synapse. Immunity. 24 (6), 741-752 (2006).
- Burbach, B. J., Medeiros, R. B., Mueller, K. L., Shimizu, Y. T-cell receptor signaling to integrins. Immunol Rev. 218, 65-81 (2007).
- Vicente-Manzanares, M., Sanchez-Madrid, F. Role of the cytoskeleton during leukocyte responses. Nat Rev Immunol. 4 (2), 110-122 (2004).
- Ma, Z., Janmey, P. A., Finkel, T. H. The receptor deformation model of TCR triggering. Faseb J. 22 (4), 1002-1008 (2008).
- Ma, Z., Sharp, K. A., Janmey, P. A., Finkel, T. H. Surface-anchored monomeric agonist pMHCs alone trigger TCR with high sensitivity. PLoS Biol. 6 (2), e43 (2008).
- Groves, J. T. Bending mechanics and molecular organization in biological membranes. Annu Rev Phys Chem. 58, 697-717 (2007).
- Xu, C., et al. Regulation of T cell receptor activation by dynamic membrane binding of the CD3epsilon cytoplasmic tyrosine-based motif. Cell. 135 (4), 702-713 (2008).
Reprints and Permissions
Request permission to reuse the text or figures of this JoVE article
Request PermissionThis article has been published
Video Coming Soon
Copyright © 2025 MyJoVE Corporation. All rights reserved