
A subscription to JoVE is required to view this content. Sign in or start your free trial.
Method Article
Multi-color Localization Microscopy of Single Membrane Proteins in Organelles of Live Mammalian Cells
In This Article
Summary
Here, we present a protocol for multi-color localization of single membrane proteins in organelles of live cells. To attach fluorophores, self-labeling proteins are used. Proteins, located in different membranes compartments of the same organelle, can be localized with a precision of ~18 nm.
Abstract
Knowledge about the localization of proteins in cellular subcompartments is crucial to understand their specific function. Here, we present a super-resolution technique that allows for the determination of the microcompartments that are accessible for proteins by generating localization and tracking maps of these proteins. Moreover, by multi-color localization microscopy, the localization and tracking profiles of proteins in different subcompartments are obtained simultaneously. The technique is specific for live cells and is based on the repetitive imaging of single mobile membrane proteins. Proteins of interest are genetically fused with specific, so-called self-labeling tags. These tags are enzymes that react with a substrate in a covalent manner. Conjugated to these substrates are fluorescent dyes. Reaction of the enzyme-tagged proteins with the fluorescence labeled substrates results in labeled proteins. Here, Tetramethylrhodamine (TMR) and Silicon Rhodamine (SiR) are used as fluorescent dyes attached to the substrates of the enzymes. By using substrate concentrations in the pM to nM range, sub-stoichiometric labeling is achieved that results in distinct signals. These signals are localized with ~15–27 nm precision. The technique allows for multi-color imaging of single molecules, whereby the number of colors is limited by the available membrane-permeable dyes and the repertoire of self-labeling enzymes. We show the feasibility of the technique by determining the localization of the quality control enzyme (Pten)-induced kinase 1 (PINK1) in different mitochondrial compartments during its processing in relation to other membrane proteins. The test for true physical interactions between differently labeled single proteins by single molecule FRET or co-tracking is restricted, though, because the low labeling degrees decrease the probability for having two adjacent proteins labeled at the same time. While the technique is strong for imaging proteins in membrane compartments, in most cases it is not appropriate to determine the localization of highly mobile soluble proteins.
Introduction
The goal of this protocol is to provide an imaging method to localize and track single membrane proteins inside live cells. We call this method Tracking and Localization Microscopy (TALM)1,2. Like Stochastic Optical Reconstruction Microscopy (STORM)3 and Fluorescence Photoactivation Localization Microscopy ((F)PALM)4,5, TALM is a single molecule-based fluorescence localization technique. However, it is distinct in the way that the mobility of membrane proteins in combination with repetitive imaging of the same labeled molecule at different positions reveals the microcompartment that is accessible for the mobile protein. In other words, the possible localizations of the protein are set by the architecture of the organelle and by the mobility of the protein1. The method is complementary to various other super-resolution techniques6,7,8 because it reveals localization and trajectory maps by imaging mobile proteins. The labeling is based on using genetically engineered fusion proteins that are per se non-fluorescent. These fusion proteins are self-labeling enzymes that react covalently with a substrate conjugated to a dye. This procedure has the advantage that the labeling degree can be controlled by the amount of added substrate. Furthermore, it allows to vary the color of fluorescence, depending on the chosen conjugated dye. Several self-labeling enzyme-tags are available9. Another advantage of using self-labeling enzyme-tags is, that the conjugated dyes usually are more stable and brighter than fluorescent proteins1 and individual proteins therefore can be recorded longer and more precisely until they are bleached. This allows for the recording of trajectories of mobile proteins and the extraction of diffusion coefficients10,11.
Here, we demonstrate the feasibility of TALM with mitochondrial membrane proteins, but it can also be applied for other intra- and extra-cellular membrane proteins, including different cell types12,13. We show that multi-color TALM further allows for the simultaneous distinction of proteins in different subcompartments in complementation to existing super-resolution fluorescence microscopy techniques14,15,16. TALM is compatible with live cell imaging17. The photo-physics of the chosen rhodamines Tetramethylrhodamine (TMR) and Silicon-Rhodamien (SiR), in particular their brightness and stability, allows to record single membrane proteins over multiple frames providing localization (and trajectory) maps. However, TALM is limited for the localization of soluble proteins with high diffusion coefficients since the motion blur is too high and the collected photons per frame are too low for proper localization. Besides, TALM requires less excitation power than for example STORM or Stimulated Emission Depletion (STED) microscopy6,7, reducing phototoxic effects. This is important, since phototoxic stress often affects organellar morphology18 and thus mobility analysis19. In sum, we present multi-color TALM in living cells as a technique that fills a gap between the localization microscopy methods STORM/STED/(F)PALM and techniques that analyze protein mobility such as fluorescence recovery after photobleaching (FRAP)20,21, fluorescence correlation spectroscopy (FCS)22, and fluorescence cross correlation spectroscopy (FCCS)11,23.
Access restricted. Please log in or start a trial to view this content.
Protocol
The following protocol follows the guidelines of the local institution research ethics committee.
1. Methods
- Cell culture
- Cultivate cells, for example HeLa cells (human cervix carcinoma), in a T25 cell culture flask containing 5 mL of growth medium at 37 °C and 5% CO2.
NOTE: For imaging, split the cells onto prepared coverslips (see steps 1.3 and 1.4) and keep in imaging medium.
- Cultivate cells, for example HeLa cells (human cervix carcinoma), in a T25 cell culture flask containing 5 mL of growth medium at 37 °C and 5% CO2.
- Cell transfection
NOTE: Use cell lines that stably express the tagged proteins whenever possible24 to avoid strong overexpression. For transient transfection, adapt the amount of plasmid DNA used for transfection. For example, when Ca2+ phosphate transfection25 is used, transfect cells (80–90% confluency) in a 3.5 cm cell culture dish with 2.5–5 µg of plasmid DNA. When performing double transfection, use 2.5 µg per each plasmid construct.- For dual color experiments, use a cell line with stable expression of one self-labeling protein and transiently transfect with the plasmid encoding the other self-labeling protein17.
NOTE: Here, for dual color experiments, HeLa cells were used that stably expressed the self-labeling proteins PINK1-Halo-Tag and Tom20-fSNAP-Tag.
- For dual color experiments, use a cell line with stable expression of one self-labeling protein and transiently transfect with the plasmid encoding the other self-labeling protein17.
- Cleaning of coverslips
- Place the coverslips in a beaker. Add 30 mL of H2O into the beaker containing the coverslips and gently shake to remove dust from their surface.
- Gather the coverslips with tweezers and dry them with a stream of nitrogen.
- Remove any organic contamination on the surface of the coverslips, e.g., by plasma cleaning.
NOTE: To avoid further contamination of the glass material, wear gloves during handling of the coverslips.
CAUTION: When coverslips are cleaned by plasma cleaning, only the upper side of the coverslips is cleaned; use this side for coating with poly-L-Lysine-polyethylene glycol-arginine-glycine-aspartate (PLL-PEG-RGD) (section 1.4) and cell seeding (section 1.5).
- Coverslip coating with PLL-PEG-RGD
NOTE: PLL-PEG-RGD is a poly-L-Lysine (PLL) derivative attached with a polyethylene glycol (3,000 Da) and a cysteine-glycine-arginine-glycine-aspartate-serine (CGRGDS) peptide. PLL binds to the negatively charged glass surface and forms a PEG brush. This drastically reduces unspecific binding of charged fluorescent dyes. In addition, the RGD motif mimics the signal peptide of the integrin receptor and thereby promotes integrin-mediated adherence of cells that otherwise do not easily adhere.- Prepare PLL-PEG-RGD as previously described26. In short, dissolve 0.8 mg of PLL-PEG-RGD in 1 mL of PBS. Add 10 µL of the PLL-PEG-RGD solution on the upper side of a clean coverslip.
- Take a second coverslip and place it with its clean surface upside down onto the first coverslip (that has the PLL-PEG-RGD drop on top); this results in sandwiching the PLL-PEG-RGD solution between two coverslips.
- Carefully place the sandwiched coverslips in a beaker and incubate for 1 h at room temperature in a dust-free dry environment.
- After 1 h, add 30 mL of H2O to the beaker to fully cover the coverslips with water.
- Gently shake the beaker until the coverslips detach from each other.
- Use tweezers to gather the coverslips out of the water and dry them under a stream of nitrogen gas.
NOTE: The coated coverslips can be stored in a dry, sterile glass Petri dish with lid for a couple of days.
- Preparation of specimen for imaging
- Transfer the single coated coverslips into a 35 mm cell culture dish, with the PLL-PEG-RGD coated surface facing upward and add 2 mL of imaging medium on top.
- Add ~500,000 trypsinized cells (200–500 µL) that express the self-labeling tags at the respective membrane proteins to the 2 mL imaging medium in the cell culture dish with the coated coverslip. Shake gently by hand to ensure a homogenous distribution of the cells to obtain a uniformly cell layer.
- Incubate cells at 37 °C and 5% CO2 until 80% confluency is reached.
NOTE: Cell samples should be seeded 3 days before imaging and 1 day before transfection. Cells, which stably express the protein of interest, can be seeded 2 days before imaging. Later, only cells grown on the coverslip are imaged.
- Labeling of tagged proteins
NOTE: Most fluorescent substrates have to be dissolved in water-free DMSO. We advise to use stock solutions of 1 µM fluorescent substrate when the final labeling concentration is 0.2–30 nM17. For imaging membrane proteins inside cells, use membrane permeable fluorescent substrates.- Warm up the imaging medium to 37 °C in a water bath.
- Pipette 1 mL of the pre-warmed imaging medium into a 2 mL tube with lid. Add 0.2–30 µL of fluorescent substrates from 1 µM stock solutions to prepare the final labeling solution (final concentration: 0.2–30 nM).
- Vortex the labeling solution for 10 s.
- Substitute the medium in the 35 mm culture dish with the cells on a coverslip (see step 1.5) by 1 mL of prepared labeling solution.
- Incubate the cells in the labeling solution at 37 °C and 5% CO2 for 20–30 min.
- Wash the cells with 2 mL of PBS once, then with 2 mL of imaging medium twice. Finally, pipette 1 mL of fresh imaging medium to the cell dish and put the sample back into the incubator at 37 °C and 5% CO2 for at least 1 h. Before imaging, exchange the imaging medium once more.
NOTE: When running the experiment for the first time, confirm correct targeting of self-labeled proteins to organellar membranes by staining the organelles with commercially available organelle specific dyes27,28. In this case, also use 100–200 nM of substrate for the self-labeling enzymes to produce strong signals.
- Preparation of a fluorescent bead sample
NOTE: In order to determine the optical drift and to align images of the different channels, multi-color fluorescent beads (0.1 µm) are used. With the recorded images, an affine transformation matrix for the two emission channels will be generated.- Dilute the solution of beads to 1% with pure H2O.
- Place 5 drops of the prepared solution with the fluorescence beads at five different positions on a cleaned coverslip (see step 1.3).
- Let the fluorescent bead sample dry on a clean bench.
NOTE: The sample can be re-used; therefore, cover the sample with aluminum foil to avoid contamination and keep it at a 4 °C.
2. Microscopy
- Experimental setup
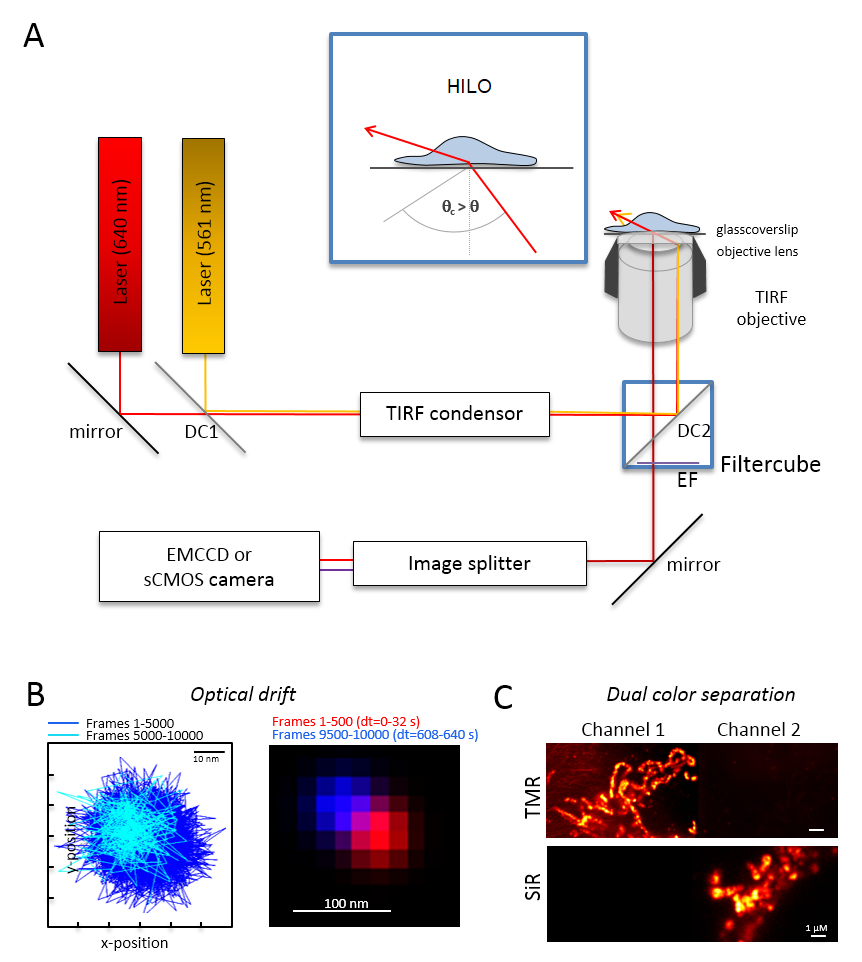
NOTE: A basic microscopy system for dual-color single molecule imaging is based on an inverted microscope: it is equipped with two lasers coupled via a multi-mode-optical polarization maintaining monomode fiber into a single total internal reflection (TIR) condenser, an oil immersion objective designed for TIRF, a polyband emission filters, an image splitter, and a highly-sensitive camera (Figure 1). A TIR condenser is needed that allows for continuous tuning of the incident angle to switch between the epi-, highly inclined and laminated optical sheet (highly inclined thin illumination (HILO)29), and the TIRF excitation mode with optimized penetration depth. Images are acquired with a highly-sensitive cooled detector system, e.g., a back-illuminated electron multiplying charged coupled device (EMCCD) camera (quantum efficiency QE >90%) or a sCMOS camera (QE >80–90%).- Determine the optical drift by imaging fluorescent beads (see step 2.2) under the same conditions as those that will be later used for the experiment, e.g., when 10,000 frames are recorded in the experiment, record also 10,000 frames with the bead sample. For the determination of the optical drift, compare the position of the beads in the first frame and the last acquired frame (Figure 1B). If necessary, later correct the image series for optical drift30 and/or use drift stable environments.
- Equip the filter cube with the appropriate dichroic beam splitter, e.g., for orange and red fluorescence plus the adequate emission filters for orange fluorescence and red fluorescence. Equip the image splitter with the suitable filters. Check for the possible leak of signals from one channel into the other channel by recording single color samples in both channels (Figure 1C).

Figure 1: Optical layout for multi-color tracking and localization microscopy (TALM) with orange and red emitters. (A) Inverted microscope setup with at least two excitation lasers, a TIRF condenser, a TIRF suitable objective, an image splitter, and a sensitive camera. Inset: to excite organelles inside cells, the angle of the incident beam must be set smaller than the critical angle for TIRF to achieve highly inclined and laminated optical sheet illumination (HILO). DC1: Dichroic mirror 1; DC2: Dichroic mirror 2. EF: emission filter. (B) Test on optical drift by imaging positions of a fluorescent bead for 10,000 frames with the same frame rate as of the following experiments (here: 15 Hz). Connected positions of the first 500 frames and the last 500 frames show the drift. Also, a merged image with the position of the first and the last frame in red and blue show a minimal drift. The drift is the distance between the centre of the signals divided by the total recording time, here 125 pm/s. (C) Check on the clear separation of signals, here TMR and SiR. For both channels, cumulative sum images from 3,000 frames (TMR in Channel 1 and SiR in Channel 2) were generated. SiRHTL was attached to Tom20-HaloTag and TMRHTL to OxPhos complex V-HaloTag. Colors are false colors. Scale bars = 100 nm (B) and 1 µm (C). Please click here to view a larger version of this figure.
- Physical alignment of image splitter generated images
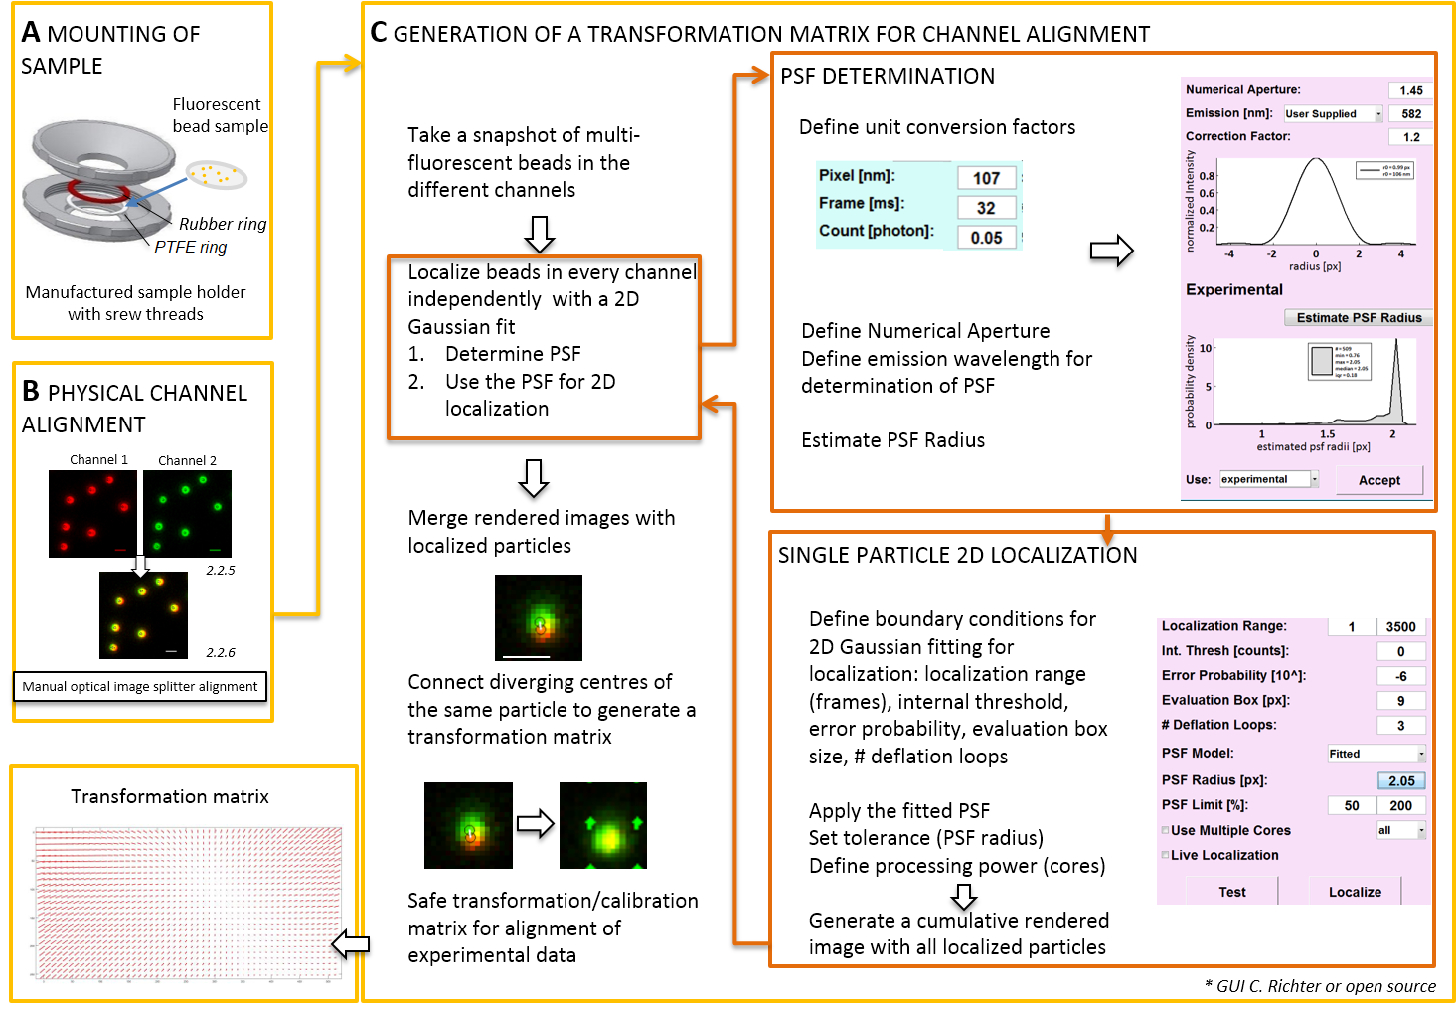
NOTE: For mounting the specimen prepared on a coverslip, a self-made sample-holder can be used (Figure 2A). To avoid dust, etc. falling into the sample, place the lid of the culture dish loosely on top of the chamber, when mounted. The same sample-holder can be used to mount the coverslip with fluorescent beads or cells; when cells are imaged, add 0.5–0.8 mL of imaging medium. The image splitter splits the image into two or more spectrally separated channels and projects them side-by-side onto the same camera. This process potentially introduces systematic distortions between the channels due to distinct optical paths traversed and obstructs direct colocalization analysis. Therefore, first perform physical alignment and second, post-correction alignment with a transformation matrix. For both alignment processes, fluorescent beads should be homogenously distributed throughout the field of view.- Mount the prepared sample with the fluorescent beads in the sample-holder between the polytetrafluoroethylene (PTFE)-ring and the red rubber ring (Figure 2A).
- Start the microscope, all hardware components, and all software needed for microscopy.
- Clean the objective and the bottom of the coverslip with a lint-free tissue wipe wetted with isopropanol. Then dry both items with a fresh lint-free tissue. Place a droplet of immersion oil on the pupil of the objective lens.
- Place the sample holder with the bead sample onto the microscope stage so that the bottom of the coverslip contacts the oil. Focus on beads by using transmission light or a laser line.
- Adjust the power of the two excitation lasers to achieve similar signal intensity in the two fluorescence channels. Search for an area with many distinct fluorescent signals.
- Generate a merged view of the fluorescent channels by using the camera control software. Then use the screws at the image splitter to manually tilt the internal mirrors of the image splitter to achieve the best overlay of the signals from the two fluorescent channels (Figure 2B).
NOTE: Attention! Do not exceed the dynamic range of the camera.
- Alignment of spectrally separated channels by software performing spatial transformation
NOTE: The following part shows the post-correction alignment and localization procedure with our software plugin (available upon request).- Start the TIRF microscope controlling software and choose to display individual channels in the live stream mode. Take a snapshot image exciting fluorescence in all channels (Figure 2C).
- Use this snapshot image to produce the transformation matrix (see Figure 2).
NOTE: The transformation matrix is used for a spatial transformation, typically an affine one, that corrects for translation (divergence of signals from a single point source between two channels). - Start the software analysis plugin (can be obtained upon request from our lab, see Figure 2C).
- Load the previously recorded dual color images (see step 2.2) of fluorescent beads into the software. Choose the used orientation of the fluorescent channels. Then click 'yes' when asked for 'calibrate images' and select the previously taken snapshot.
- Open the "UNIT MANAGER" to define unit conversion factors (pixel size, frame rate, photon conversion factor).
- Open the "LOCALIZATION MANAGER". Determine the point spread function (PSF) first. Press the button: “PSF radius”. In the "PSF Estimator" window that opens, define the numerical aperture and the emission maximum. Start “Estimate PSF radius” by clicking.Accept the obtained experimental PSF. Define the evaluation box, number of deflation loops, and how many cores of the computer are used for calculation. Press "localize" to start fitting the intensity distribution of single particles by a 2D symmetric Gaussian function (Figure 2C).
- “Accept” the obtained experimental PSF. Define the evaluation box, number of deflation loops, and how many cores of the computer are used for calculation. Press “localize” to start fitting the intensity distribution of single particles by a 2D symmetric Gaussian function (Figure 2C).
- Open the "CALIBRATION MANAGER". In the rendered merged image of the two channels, the original signals and the localized centers are shown. Choose the "affine" mode. Manually connect the corresponding pairs of localized centers in the two channels that have originated from the same fluorescent bead by drawing a connection line.
- Connect the corresponding signals distributed all over the field of view. After this, press "accept". Save the calibration.
NOTE: The spatial transformation is sampled at each fluorescent bead and interpolated in between. The extracted transformation function represents a displacement field Δr(x,y) that is used to subsequently correct the experimental dual-color single molecule localizations so that they overlay within their localization precision. The spatial transformation matrix is typically an affine one that corrects for translation, scaling, and rotation between channels with nanometer accuracy, and it can be inferred from this manual one-to-one mapping (Figure 2C).

Figure 2: Workflow for dual color alignment. (A) The coverslip with the fluorescent beads is mounted in a sample holder between a PTFE and a rubber ring. Then the upper and lower part of the chamber are bolted together. (B) Physical alignment of the channel views that are generated by the image splitter. Recorded fluorescent signals from beads (0.1 µm) in two channels (green and red, false colors) are merged. The corresponding screws at the optical image splitter are manually turned until the best overlay of the different signals is achieved (yellow color, lower panel). (C) Generation of a transformation matrix for post-processive channel alignment. For precise localization of a particle, it is necessary to determine the point spread function (PSF) in dependence on the emission wavelength and the numerical aperture of the objective. The center of a PSF can be determined by its intensity profile analyzed by a symmetric two-dimensional Gaussian fit. The resulting localization of the signal peak is then projected on the original, blurred signals. In a merged image, the localized centers of the signals from the two channels are connected to generate a transformation matrix that is later used for the post-processive alignment of the experimental data. Scale bars = 1 µm (B, C). Please click here to view a larger version of this figure.
- Single molecule imaging of mitochondrial membrane proteins
NOTE: All experiments are carried out at room temperature. T-cells or non-adherent cells must be immobilized in agarose before imaging31.- Mount the specimen with adherent cells on the coverslip between the rubber and PTFE rings (Figure 3A). Fill the chamber with 0.5–0.8 mL imaging medium.
- Repeat steps 2.2.2–2.2.5.
- Adjust the illumination angle TIRF microscope controlling software to create an incident angle that is smaller than the critical angle for TIR mode to excite the specific region of interest via a HILO sheet32 (HILO mode, Figure 1A).
CAUTION: Avoid direct eye contact with the laser beam! - Set the EM gain and choose an exposure time suitable for the experiment that collects sufficient photons per frame.
- Set the laser power to achieve a high signal to noise (S/N) ratio (Figure 3B), since the localization precision directly corresponds to S/N33 (Figure 3C).
- Find an area in the cell periphery with non-overlapping, elongated mitochondria and single molecule signals (Figure 3D; Supplementary Video 1). If no single molecule signals are visible, wait until bleaching results in the appearance of single molecule signals (Figure 3E).
- Record until the number of signals is too low for reasonable continuation (usually 1,000–10,000 frames depending on the bleaching behavior of the fluorescent dye, Figure 3F).
- Start the imaging processing software and check for mitochondrial structures by generating a cumulative rendered sum image of at least 1,000 recorded frames (Figure 3G).
NOTE: The fastest possible frame rate is dictated by the readout area. The field of view for one channel is reduced by a dual-color image splitter (512 x 512 pixels) to 256 x 512 pixels, and for a Quad-color to 256 x 256 pixels. Thus, for using an image splitter for two colors, this is 30 Hz. Set the frame transfer mode to achieve the lowest possible readout time. - Start software analysis plugin and load raw data. Select the channel orientation and load images. Use the transformation matrix from step 2.3.9 when asked for “Calibrate images”. Channels will be separately displayed.
- Open the "UNIT MANAGER" as before to define unit conversion factors for each channel. Open the "LOCALIZATION MANAGER" for each channel. Then define the evaluation box, number of deflation loops, add the theoretical PSF for the conditions used and set how many cores of the computer are used for calculation. Finally, press “localize” to get localized single particles (Figure 3H; Supplementary Video 2).
- Note that the program will finally generate a cumulative superresolution image showing all localized particles (Figure 3I).
- Perform analysis, e.g., by open source software or our software available upon request.
- Track the single molecules in both localized channels, e.g., with the multiple-target tracer10
NOTE: Step 2.4.13 needs preliminary (experimental) knowledge about the diffusibility of the proteins of interest to set the boundary conditions correctly. Usually, finding the correct boundary conditions is an iterative process.

Figure 3: Steps during single molecule localization microscopy. (A) A coverslip with the specimen is mounted between the top and bottom part (grey) of the homemade sample holder (designed by J. Bereiter-Hahn). A rubber ring (red) and a PTFE ring (white) seal the system from above and below the coverslip, when the sample-holder parts are bolt together. (B) Signal to noise ratio of the TMR signal. (C) Calculated localization precision histogram for all localized particles. (D) Choice of a reasonable region for imaging, here, the cell periphery with clearly separated mitochondria. (E) Recording and image processing: a single frame with distinct single molecule signals is shown (here, single molecules of CV-HaloTag/TMRHTL were recorded). (F) Intensity of TMR over the recording time. (G) Cumulative sum image of 3,000 frames, unprocessed. (H) Particles of CV-HaloTag/TMRHTL localized with a 2D Gaussian function from a single frame. (I) Cumulative, rendered sum image showing all localized CV-HaloTag/TMRHTL particles from 3,000 frames. Please click here to view a larger version of this figure.
Access restricted. Please log in or start a trial to view this content.
Results
Multi-color imaging and colocalization analysis can help to determine the sub-organellar localization of proteins. We demonstrated this earlier with the cytosolic phosphatase and tensin homologue, PINK1, that has different sub-mitochondrial locations due to its processing by mitochondrial proteases17. PINK1 is an important factor guaranteeing mitochondrial functionality34,35. To determine the localizat...
Access restricted. Please log in or start a trial to view this content.
Discussion
Here, a technique for dual color single molecule localization of mobile membrane proteins was presented. Following the protocol, membrane proteins are fused to self-labeling proteins that react with the rhodamine dyes TMR and SiR conjugated to their respective substrates. Rhodamine dyes are bright and photostable and thus allow for repetitive imaging1. For successful performance, several conditions and critical topics have to be kept in mind.
First, it is important to c...
Access restricted. Please log in or start a trial to view this content.
Disclosures
The authors have nothing to disclose.
Acknowledgements
The authors would like to thank the Biophysics group and Jacob Piehler at the University of Osnabrück for continuous support, Wladislaw Kohl for technical assistance and preparation of material, and the CellNanOs board for providing microscopes for use. The project was funded by the SFB 944.
Access restricted. Please log in or start a trial to view this content.
Materials
| Name | Company | Catalog Number | Comments |
| (2-(4-(2-hydroxyethyl)-1-piperazinyl)-ethanesulfonic acid, 1 M) (HEPES) | Biochrom | #1104E | |
| DC1: Dichroid beam splitter | Chroma | 640 dcxr | NC506031 |
| DC2: Polychroic Mirror, beamsplitter | Chroma | zt405/488/561/640rpc | discontinued |
| Dulbecco´s Phosphate-Buffered Saline (PBS) 1x (w/o Ca & Mg) | Sigma-Aldrich & Co. | #RNBF8311 | |
| Earle´s MEM without phenol red, without L-Glutamine and without NaHCO3 containing 1% FBS, 0.1% HEPES, 0.1% NEAA, 0.1% Alanyl-L-Glutamine and 34.78% sodium hydrogen carbonate (NaHCO3 0.75g/l) | Imaging medium | ||
| Earle´s minimum essential medium (MEM) with phenol red, containing 1% Fetal Bovine Serum Superior (FBS), 0.1% HEPES (2-(4-(2-hydroxyethyl)-1-piperazinyl)-ethanesulfonic acid, 1 M), and 0.1% non-essential amino acids (NEAA) | Growth medium | ||
| EF: Emission filter quadbandpass | AHF analysentechnik | F72-866 | Brightline HC 446 nm/523 nm/600 nm/677 nm |
| EMCCD camera | Andor | Andor iXON 897 | EMCCD camera |
| Emission filter QuadView filter cubes, orange | AHF analysentechnik | F39-637 | bandpass 582 - 619 nm |
| Emission filter QuadView filter cubes, red | Chroma | bandpass 655 - 725 nm (HQ 690/70) | |
| FBS (Fetal bovine serum) superior | Biochrom | S0615 | |
| Fluorescent beads: TetraSpeck™ Microspheres, 0.1 µm, fluorescent blue/green/orange/dark red | Thermo Fisher Scientific | T7279 | fluorescent microspheres |
| Glutamine | Biochrom | #0951C | |
| HeLa cells | DSMZ | ACC-57 | Cervical carcinoma cells from patient Henrietta Lacks |
| Hela cells CI::paGFP, stable | Muster et al., PLOSOne 2010 | ||
| Hela cells CV g::Halo7-Tag, stable | Appelhans et al., NanoLett 2012 | ||
| Hela cells Tom20::Halo7-Tag, stable | Appelhans et al., NanoLett 2012 | ||
| Image splitter | Photometrics | Dual-View QV2 | image splitter emission |
| Imaging processing software | ImageJ2 / Fiji | freeware | |
| Immersion Oil - ImmersolTM 518 F (ne = 1.518, ve = 45) | Carl Zeiss Jena GmbH | 444960-0000-000 | |
| Inverted epifluorescence microscope | Olympus IX-71/73/83 | ||
| Laser 561 nm, 200 mW | CrystaLaser | CL-561-200 | 561 nm emission |
| Laser 642 nm, 140 mW | Omicron | Luxx-642-140 | 642 nm emission |
| MATLAB | MathWorks | version R2013a | |
| MEM with Earle's Balanced Salt Solution 2.2 g/L NaHCO3, stable glutamine w/o PR | Biochrom | FG-0385 | |
| MEM with Earle's Balanced Salt Solution with 2.2 g/L NaHCO3, stable glutamine, Phenolred | Biochrom | FG-0325 | |
| MitoTracker® Deep Red FM | Thermo Fisher Scientific | M22426 | dye |
| MitoTracker® Green FM | Thermo Fisher Scientific | M7514 | dye |
| Multi-mode-optical polarization maintaining monomode fiber | Pointsource/Qioptiq | KineFLEX | |
| NHS-PEG-MAL, Rapp Polymer | Rapp Polymere GmbH Tübingen | coverslip coating | |
| non-essential amino acids (NEAA) | Biochrom | #0802E | |
| PEG 800 (Polyethylene glycol) 10 % | Carl Roth GmbH | Art No. 0263.1 | coverslip coating |
| Penicillin/Streptomycin | Biochrom | #0122E | |
| Plasmid for PINK1-Halo7-Tag expression | Beinlich et al., ACS Chemical Biology 2015 | ||
| Poly-L-lysine (1.2 mg/ml) | Sigma-Aldrich & Co. | Cat. No.P9155 | coverslip coating |
| RGD Peptide (Ac-CGRGDS-COOH) | Coring System Diagnostix GmbH, Gernsheim | coverslip coating / Intergrin receptor motif | |
| Silicon Rhodamine linked to HaloTag®-Ligand (SiRHTL) | personal gift from Kai Johnson | dye | |
| Software analysis plugin | self-written C. P. Richter, Biophysik Osnabrück | SLIMFAST 16g | |
| Tetramethylrhodamine / SNAP-Cell® TMR-Star linked to SNAP-Ligand (TMRstar) | New England Biolab® | S9105S | dye |
| Tetramethylrhodamine linked to HaloTag®-Ligand (TMRHTL) | Promega | G8251 | dye |
| TIRF condensor | Olympus | Cell^TIRF MITICO System | TIRF condensor |
| TIRF microscope controlling software | Olympus cellSens 1.12 | ||
| TIRF objective | Olympus | 150x oil objective (N.A. 1.45; Olympus UAPO) | |
| Trypsin/EDTA 10x | Biochrom | #0266 | |
| Water H2O 99,5 % Rotipuran® Low organic | Carl Roth GmbH | Art. No. HN57.1 |
References
- Appelhans, T., Richter, C., Wilkens, V., Hess, S., Piehler, J., Busch, K. Nanoscale organization of mitochondrial microcompartments revealed by combining tracking and localization microscopy. Nano Letters. 12 (2), 610-616 (2012).
- Appelhans, T., Busch, K. Single Molecule Tracking and Localization of Mitochondrial Protein Complexes in Live Cells. Methods Mol Biol. 1567, 273-291 (2017).
- Rust, M. J., Bates, M., Zhuang, X. Sub-diffraction-limit imaging by stochastic optical reconstruction microscopy (STORM). Nat Methods. 3 (10), 793-795 (2006).
- Gould, T. J., Verkhusha, V. V., Hess, S. T. Imaging biological structures with fluorescence photoactivation localization microscopy. Nat Protoc. 4 (3), 291-308 (2009).
- Pennacchietti, F., Gould, T. J., Hess, S. T. The Role of Probe Photophysics in Localization-Based Superresolution Microscopy. Biophys J. 113 (9), 2037-2054 (2017).
- Wegel, E., Göhler, A., Lagerholm, B. C., Wainman, A. Imaging cellular structures in super-resolution with SIM, STED and Localisation Microscopy: A practical comparison. Scientific reports. , Available from: https://www.nature.com/articles/srep27290?WT.feed_name=subjects_physical-sciences (2016).
- Pellett, P., et al. Two-color STED microscopy in living cells. Biomedical Optics Express. 2 (8), (2011).
- Ishigaki, M., et al. STED super-resolution imaging of mitochondria labeled with TMRM in living cells. Mitochondrion. 28, 79(2016).
- Liss, V., Barlag, B., Nietschke, M., Hensel, M. Self-labelling enzymes as universal tags for fluorescence microscopy, super-resolution microscopy and electron microscopy. Scientific Reports. 5, 17740(2015).
- Sergé, A., Bertaux, N., Rigneault, H., Marguet, D. Dynamic multiple-target tracing to probe spatiotemporal cartography of cell membranes. Nat Methods. 5 (8), (2008).
- Appelhans, T., Busch, K. B. Dynamic imaging of mitochondrial membrane proteins in specific sub-organelle membrane locations. Biophysical reviews. 9 (4), 345-352 (2017).
- Wilmes, S., et al. Triple-color super-resolution imaging of live cells: resolving submicroscopic receptor organization in the plasma membrane. Angewandte Chemie. 51 (20), 4868-4871 (2012).
- Niewidok, B., et al. Single-molecule imaging reveals dynamic biphasic partition of RNA-binding proteins in stress granules. J Cell Biol. , (2018).
- Wurm, C. A., Jakobs, S. Differential protein distributions define two sub-compartments of the mitochondrial inner membrane in yeast. FEBS Lett. 580 (24), 5628-5634 (2006).
- Schmidt, R., Wurm, C. A., Punge, A., Egner, A., Jakobs, S., Hell, S. W. Mitochondrial cristae revealed with focused light. Nano Lett. 9 (6), 2508-2510 (2009).
- Kukat, C., Wurm, C. A., Spahr, H., Falkenberg, M., Larsson, N. G., Jakobs, S. Super-resolution microscopy reveals that mammalian mitochondrial nucleoids have a uniform size and frequently contain a single copy of mtDNA. Proceedings of the National Academy of Sciences of the United States of America. 108 (33), 13534-13539 (2011).
- Beinlich, F., Drees, C., Piehler, J., Busch, K. Shuttling of PINK1 between Mitochondrial Microcompartments Resolved by Triple-Color Superresolution Microscopy. ACS chemical biology. 10 (9), 1970-1976 (2015).
- Shim, S., et al. Super-resolution fluorescence imaging of organelles in live cells with photoswitchable membrane probes. Proceedings of the National Academy of Sciences. 109 (35), 13978-13983 (2012).
- Sbalzarini, I., Mezzacasa, A., Helenius, A., Koumoutsakos, P. Effects of Organelle Shape on Fluorescence Recovery after Photobleaching. Biophysical Journal. 89 (3), 1482-1492 (2005).
- Reits, E., Neefjes, J. From fixed to FRAP: measuring protein mobility and activity in living cells. Nature Cell Biology. 3 (6), E145-E147 (2001).
- Goehring, N., Chowdhury, D., Hyman, A., Grill, S. FRAP Analysis of Membrane-Associated Proteins: Lateral Diffusion and Membrane-Cytoplasmic Exchange. Biophysical Journal. 99 (8), 2443-2452 (2010).
- Bacia, K., Haustein, E., Schwille, P. Fluorescence correlation spectroscopy: principles and applications. Cold Spring Harbor protocols. 2014 (7), 709-725 (2014).
- Sukhorukov, V., Dikov, D., Busch, K., Strecker, V., Wittig, I., Bereiter-Hahn, J. Determination of protein mobility in mitochondrial membranes of living cells. Biochimica et biophysica acta. 1798 (11), 2022-2032 (2010).
- Kim, T. K., Eberwine, J. H. Mammalian cell transfection: the present and the future. Anal Bioanal Chem. 397 (8), 3173-3178 (2010).
- Graham, F. L., van der Eb, A. J. A new technique for the assay of infectivity of human adenovirus 5 DNA. Virology. 52 (2), 456-467 (1973).
- Wedeking, T., et al. Spatiotemporally Controlled Reorganization of Signaling Complexes in the Plasma Membrane of Living Cells. Small. 11 (44), 5912-5918 (2015).
- Mironov, S. L., Ivannikov, M. V., Johansson, M. [Ca2+]i signaling between mitochondria and endoplasmic reticulum in neurons is regulated by microtubules. From mitochondrial permeability transition pore to Ca2+-induced Ca2+ release. J Biol Chem. 280 (1), 715-721 (2005).
- Poot, M., et al. Analysis of mitochondrial morphology and function with novel fixable fluorescent stains. J Histochem Cytochem. 44 (12), 1363-1372 (1996).
- Tokunaga, M., Imamoto, N., Sakata-Sogawa, K. Highly inclined thin illumination enables clear single-molecule imaging in cells (vol 5, pg 159). Nature Methods. 5 (5), 455(2008).
- Elmokadem, A., Yu, J. Optimal Drift Correction for Superresolution Localization Microscopy with Bayesian Inference. Biophys J. 109 (9), 1772-1780 (2015).
- Barlag, B., et al. Single molecule super-resolution imaging of proteins in living Salmonella enterica using self-labelling enzymes. Sci Rep. 6, 31601(2016).
- Tokunaga, M., Imamoto, N., Sakata-Sogawa, K. Highly inclined thin illumination enables clear single-molecule imaging in cells. Nature Methods. 5 (2), 159-161 (2008).
- Mortensen, K. I., Churchman, L. S., Spudich, J. A., Flyvbjerg, H. Optimized localization analysis for single-molecule tracking and super-resolution microscopy. Nat Methods. 7 (5), 377-381 (2010).
- Jin, S., Youle, R. J. PINK1- and Parkin-Mediated Mitophagy at a Glance. Journal of Cell Science. 125, 795-799 (2013).
- Yamano, K., Youle, R. J. PINK1 is degraded through the N-end rule pathway. Autophagy. 9 (11), 1758-1758 (2013).
- Wiedemann, N., et al. Machinery for protein sorting and assembly in the mitochondrial outer membrane. Nature. 424 (6948), 565-571 (2003).
- Thompson, R., Larson, D., Webb, W. Precise Nanometer Localization Analysis for Individual Fluorescent Probes. Biophysical Journal. 82 (5), 2775-2783 (2002).
Access restricted. Please log in or start a trial to view this content.
Reprints and Permissions
Request permission to reuse the text or figures of this JoVE article
Request PermissionExplore More Articles
This article has been published
Video Coming Soon
Copyright © 2025 MyJoVE Corporation. All rights reserved