
A subscription to JoVE is required to view this content. Sign in or start your free trial.
Method Article
Rapid Determination of Antibody-Antigen Affinity by Mass Photometry
In This Article
Summary
We describe a single-molecule approach to antigen-antibody affinity measurements using mass photometry (MP). The MP-based protocol is fast, accurate, uses a very small amount of material, and does not require protein modification.
Abstract
Measurements of the specificity and affinity of antigen-antibody interactions are critically important for medical and research applications. In this protocol, we describe the implementation of a new single-molecule technique, mass photometry (MP), for this purpose. MP is a label- and immobilization-free technique that detects and quantifies molecular masses and populations of antibodies and antigen-antibody complexes on a single-molecule level. MP analyzes the antigen-antibody sample within minutes, allowing for the precise determination of the binding affinity and simultaneously providing information on the stoichiometry and the oligomeric state of the proteins. This is a simple and straightforward technique that requires only picomole quantities of protein and no expensive consumables. The same procedure can be used to study protein-protein binding for proteins with a molecular mass larger than 50 kDa. For multivalent protein interactions, the affinities of multiple binding sites can be obtained in a single measurement. However, the single-molecule mode of measurement and the lack of labeling imposes some experimental limitations. This method gives the best results when applied to measurements of sub-micromolar interaction affinities, antigens with a molecular mass of 20 kDa or larger, and relatively pure protein samples. We also describe the procedure for performing the required fitting and calculation steps using basic data analysis software.
Introduction
Antibodies have become ubiquitous tools of molecular biology and are used extensively in both medical and research applications. In medicine, they are critically important in diagnostics, but their therapeutic applications are also expanding and new antibody-based therapies are constantly being developed1,2,3,4. The scientific applications of antibodies include many indispensable laboratory techniques such as immunofluorescence5, immunoprecipitation6, flow cytometry7, ELISA, and western blotting. For each of these applications, obtaining accurate measurements of the antibody’s binding properties, including binding affinity and specificity, is of crucial importance.
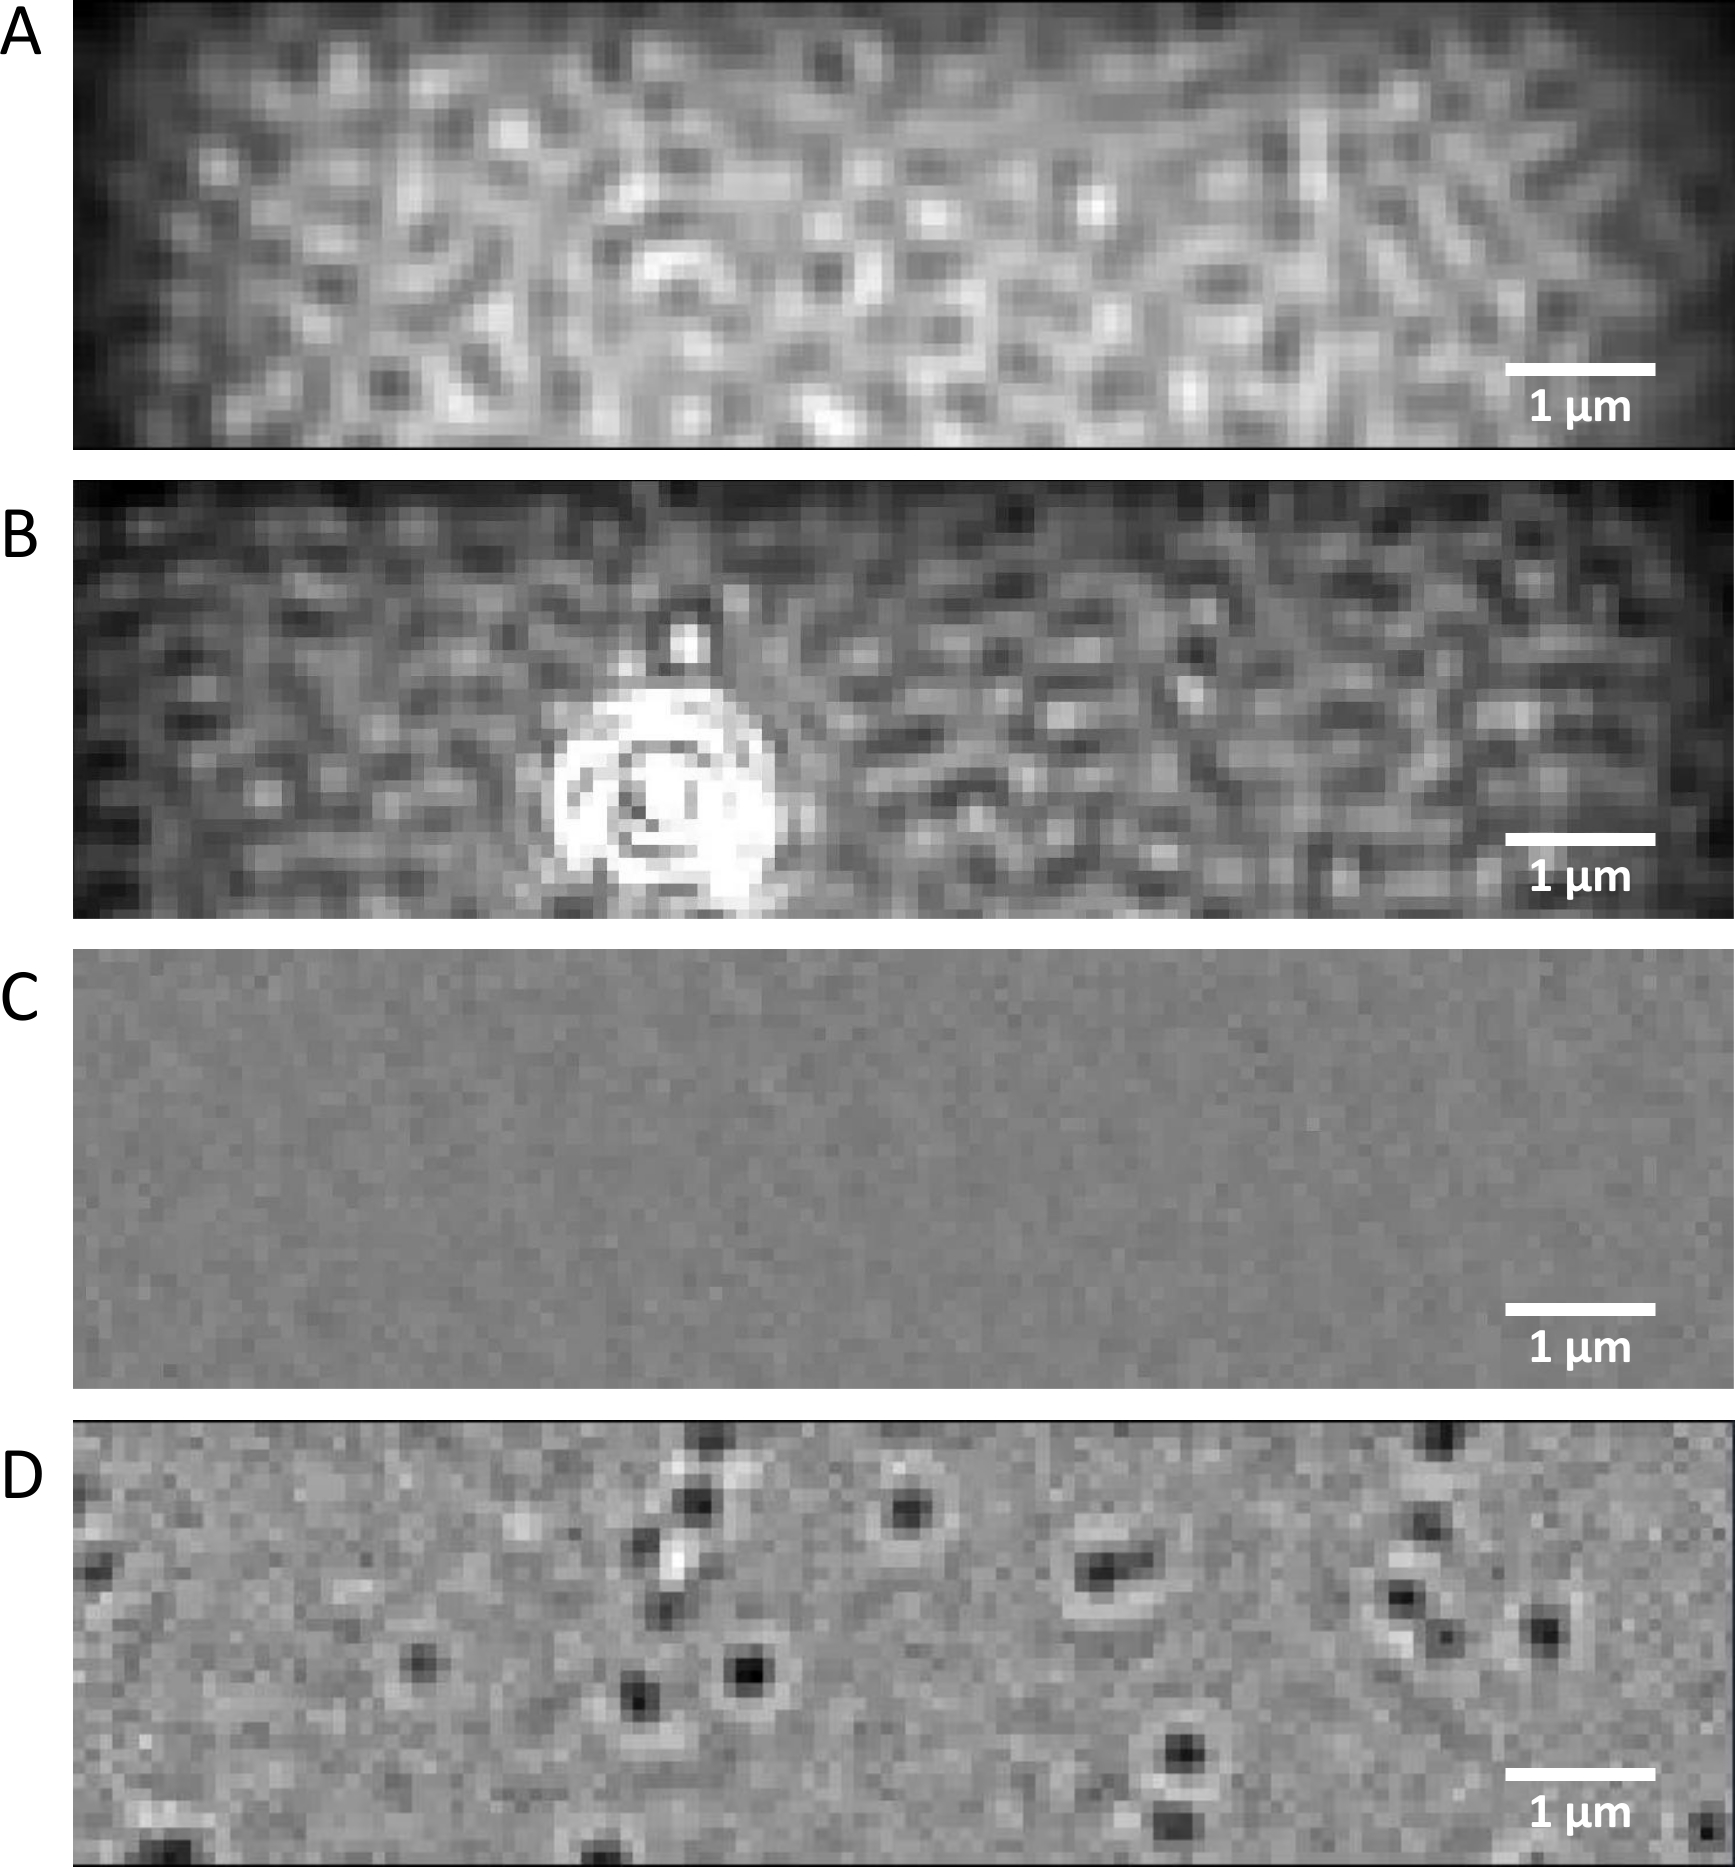
Since the first commercial surface plasmon resonance (SPR) instrument was introduced in 1990, optical biosensors have become the “gold standard” of antibody characterization, but other techniques, including ELISA, are also routinely used to measure antibody affinities8,9. These methods usually require immobilization or labeling of the analyzed molecules, which can potentially affect the interaction of interest. They are also relatively slow, involving multiple assay steps before the results can be collected for data analysis. A recently developed single-molecule method, mass photometry (MP), detects molecules directly in solution when they land on the surface of the microscope coverslip10,11. The light scattering-based optical detection that MP employs does not require protein labeling or modification. Individual protein molecules are recorded by the interferometric scattering microscope as dark spots appearing in the image (Figure 1D), and several thousand molecules can be detected during the one-minute data acquisition12. The signal generated by each individual particle is quantified, and its contrast value (relative darkness) is calculated. The interferometric contrast values are proportional to the molecular masses of the proteins, which allows for the identification of bound and free species in the antigen-antibody mixture. At the same time, by counting molecular landing events, MP directly measures the species populations. This gives MP based methods a unique capability to independently quantify affinities of multiple binding sites.
Binding of the antigen (Ag) molecules to the two binding sites of the intact antibody (Ab) can be described as:

with the equilibrium association constants Ka1 and Ka2 defined as:

where ci and fi represent concentration and fraction of the component i, respectively. The total antigen concentration (cAg)tot can be expressed as:

Since the total concentrations of the antibody (cAb)tot and antigen (cAg)tot are known, this equation can be used to directly fit the experimental component fractions obtained from the MP measurements and calculate the equilibrium association constants Ka1 and Ka2 (see Supplementary Information).
The MP data can also be used to estimate cooperativity between the two antibody binding sites11. For two antibody paratopes with identical microscopic binding constants, the statistical factors describing the process of population of the Ab·Ag and Ab·Ag2 complexes dictate that the apparent macroscopic equilibrium constants Ka1 and Ka2 will not be numerically equal, and Ka1 = 4Ka2. Therefore, the experimental values of Ka1 < 4Ka2 indicate positive cooperativity between the two antibody binding sites. Similarly, Ka1 > 4Ka2 indicates negative cooperativity.
MP measurements of the antigen-antibody binding affinity are fast and require a small amount of material. The MP mass distributions used for equilibrium constant calculations provide additional information about the sample properties and enable the assessment of the sample purity, oligomerization, and aggregation in a single experiment. The same method can be used to measure high affinity protein-protein binding, and MP is particularly useful for studies of multi-valent protein interactions. Multi-protein complexes usually have large molecular masses, optimal for MP detection, and single-molecule data can be used to measure stoichiometry and calculate affinities of multiple binding sites simultaneously. This information is usually difficult to obtain using bulk-based methods.
Without modifications, the current protocol is suitable for measurements of relatively high-affinity, sub-micromolar interactions with antigens of a molecular mass of 20 kDa or larger. For optimal results, protein stocks should be of high purity, but there are no specific buffer requirements. By using MP, the antigen-antibody binding can be assessed in less than five minutes. The data collection and analysis required for accurate Kd calculations can be performed within 30 minutes.
Protocol
1. Prepare the flow chambers
- Clean the glass coverslips
- Using wash bottles with distilled water, ethanol, and isopropanol, rinse the 24 mm x 50 mm coverslips in the following order: water, ethanol, water, isopropanol, water. Dry the coverslips with a stream of clean nitrogen. It is important to rinse the coverslips from top to bottom, holding the bottom corner with soft-tipped forceps. Dry the coverslip in the same direction to avoid transferring contamination from the forceps (Figure 2A).
- Similarly, rinse the 24 mm x 24 mm coverslips with distilled water, ethanol, and distilled water. Dry the coverslips with a stream of clean nitrogen.
- Identify the working side of the coverslip, place a drop of distilled water on the surface of the clean coverslip and follow steps 3.1–3.2 of the protocol. Usually only one side of the 24 mm x 50 mm coverslip has the optical quality suitable for MP measurements.
NOTE: After focusing, no significant surface imperfections should be detectable, and the “signal” value shown in the data collection software should be less than 0.05% (Figure 1A-C). The working sides of all coverslips in the box are oriented in the same direction. The same procedure should be used to test the efficiency of the coverslip cleaning.
- Assemble the flow chamber
- Position the 24 mm x 24 mm coverslip on a piece of aluminum foil. Place strips of double-sided tape on top of the 24 mm x 24 mm coverslip as shown in Figure 2B and cut the tape along the edge of the glass. Separate the coverslip from the aluminum foil and attach it to the working side of the 24 mm x 50 mm coverslip (Figure 2C).
NOTE: Channel size can vary, but a width of 3 mm–5 mm is recommended. Wider channels require larger sample volumes and very narrow channels may be difficult to load. Usually, two parallel channels can easily be created on the 24 mm x 24 mm coverslip. Protocol can be paused here.
- Position the 24 mm x 24 mm coverslip on a piece of aluminum foil. Place strips of double-sided tape on top of the 24 mm x 24 mm coverslip as shown in Figure 2B and cut the tape along the edge of the glass. Separate the coverslip from the aluminum foil and attach it to the working side of the 24 mm x 50 mm coverslip (Figure 2C).
2. Prepare the antibody-antigen samples for the affinity measurements
- Filter at least 2 mL of the PBS buffer using 0.22 µm syringe filters to remove dust particles or aggregates. Centrifuge the protein stock for 10 minutes at the maximum speed of the tabletop centrifuge (approximately 16,000 x g).
NOTE: PBS is the recommended buffer for this protocol, but MP has no particular buffer requirements, and other biological buffers are also acceptable. However, high glycerol concentrations (>10%) and very low ionic strengths (salt concentration <10 mM) may affect the image and data quality and are not recommended. - Determine the actual concentrations of the antibody and antigen stocks by measuring their 280 nm UV absorbance.
- Calculate the measurement concentrations of the antigen-antibody mixture. If the estimated value of the antibody binding affinity is not known, plan to prepare a sample with 30 nM antigen and 20 nM antibody concentration. When the approximate affinity is known, the antibody to antigen ratio and their concentrations should be optimized according to the expected Kd values. Use the total antigen concentration in the mixture equal to the sum of the expected Kd and the total antibody concentration in the equation below. Assuming Kd1 = Kd2 for the two paratopes of the antibody, this will result in comparable concentrations of the free antibody and the antibody-antigen complexes in the sample.

Adjust the antibody concentration to keep the total protein concentration in the sample within the 10 nM and 50 nM range. Best results are obtained using mixtures with antibody concentrations between 5 nM and 25 nM.
NOTE: MP detects proteins with a molecular mass larger than 40 kDa. Consequently, sample concentrations of antigens with a molecular mass smaller than 40 kDa can exceed the typical 50 nM limit. However, at concentrations higher than approximately 100 nM, even low molecular mass antigens might affect the image quality and accuracy of the Kd determination. - Prepare 50 µL of the antibody-antigen mixture at its final measurement concentration calculated in step 2.3.
NOTE: Only one sample of the antigen-antibody mixture is required for the Kd determination. However, preparing several samples with different antigen to antibody ratios can help optimize sample concentration. If data from several samples are collected, they can be analyzed via a global fit. - Incubate the antigen-antibody mixture(s) for approximately 10 min at room temperature to allow the binding reaction to reach chemical equilibrium. Avoid unnecessarily long incubation times.
NOTE: Incubation time may vary depending on the binding kinetics. To confirm that the chemical equilibrium has been reached, sample measurements can be repeated at different incubation times. Time-invariant Kd values indicate sufficiently long incubation. Prolonged incubation may lead to significant protein adsorption to the surface of the plastic labware and, consequently, to significant errors in the protein concentration determination. For this reason, low-adhesion labware is strongly recommended for MP sample preparation13.
3. Collect the Mass Photometry data
- Apply a drop of microscope immersion oil on the MP instrument objective and place the assembled flow chamber on the microscope stage. Make sure the oil spans the gap between the coverslip and the objective.
- Load the flow chamber and focus the mass photometer.
- Deposit 10 µL of a clean, filtered buffer solution at one end of the flow chamber channel prepared in step 1. Liquid will enter the channel by capillary action.
- Adjust the stage’s Z-position to focus the microscope on the working surface of the 24 x 50 mm coverslip.
- In the Focus Control tab of the data collection software, use the coarse stage movement Up and Down buttons to make the initial adjustments.
- Click the Sharpness button to show the sharpness signal readout and use the fine Up and Down adjustment buttons to maximize the Sharpness value.
- Click the Set Focus and Lock Focus buttons to activate the focus tracking function. A properly focused image (Figure 1A,C) should have the “signal” value below 0.05%.
NOTE: If the “signal” value at the maximum sharpness position is above 0.05%, this may indicate impurities on the glass surface or in the buffer.
- Using the same channel, load 20 µL of the antibody-antigen sample by depositing it on one side of the channel and blotting the liquid from the other end with a small piece of blotting paper (Figure 2D).
NOTE: The volume of a 3–5 mm wide channel is approximately 10 µL. The additional sample volume is recommended to completely replace the buffer present in the channel and to avoid sample dilution. - After loading the sample, immediately click the Record button to start data collection, acquiring a 100 s video (Figure 1D).
- At the end of the data collection enter the file name and click OK to save the data file.
- Discard the coverslips and wipe the oil from the objective lens with cotton optical swabs wet with isopropanol.
NOTE: The protocol can be paused here.
4. Analyze the MP data
- Process the collected video file using the MP data processing software to identify the landing events.
- Use the File/Open menu option to load the file for the analysis and click Analyze.
- Click the Load button to load the calibration function and save the analyzed data using the File/Save Results As menu option.
- Fit the molecular mass distribution with Gaussian functions to obtain relative concentrations of each species in the sample. This analysis can be performed using a common scientific graphing software (see Table of Materials).
- Import the “eventsFitted.csv” file into the software and plot the molecular mass distribution (column M in the .csv file) using the Plot/Statistics/Histogram function.
- Double click on the histogram to open the Plot Properties window. Disable automatic binning and select a bin size of 2.5 kDa. Click the Apply and the Go buttons to create the Bin Centers and Counts data.
- Select the Bin Centers and Counts columns and use the Analysis/Peaks and Baseline/Multiple Peak Fit menu function to fit the histogram with Gaussian functions. Double click to indicate the approximate peak positions on the distribution plot and then click the Open NLFit button.
- Check the Fixed checkboxes for the “xc” peak centers and set their values to the expected molecular masses of the free antibody and the single and double antigen-antibody complexes. Check the Share option for the width parameters. Click the Fit button. The fitted peak height values of the Gaussian components represent the relative concentration of each species in the sample11.
NOTE: Bin size may be adjusted to optimize the resolution of the mass distribution plot. The MP precision limit is approximately 1 kDa, and smaller bin sizes might amplify the noise of the distribution, while not revealing any additional information. Very large bin sizes will obscure the fine details of mass distributions.
- Calculate the concentration fraction of each species using the following equation:

where the hi and fi values represent peak heights and concentration fractions of the free antibody and the single- and double-bound antibody in the sample, respectively.
5. Calculate equilibrium constant values
- Fit the concentration fractions of the interaction species calculated in step 4.3 with Eq. 1 and 2 using a suitable analytical software. Here we demonstrate a method to calculate equilibrium constants using a spreadsheet program14 (see Supplementary Information).
- Open the “Kd calculation.xlsx” worksheet. In this worksheet, the cell values in rows 1 to 10 highlighted in yellow can be modified to perform the equilibrium constants calculations.
- Enter the estimated Kd values in nanomolar units into cells B1 and B2 in the table. Those starting values will be optimized in the fitting procedure. If the estimated Kd values are not known, leave the default values in cells B1 and B2 unchanged.
- Enter the values of (cAb)tot and (cAg)tot in nanomolar units into cells D2 and E2. Enter the fraction values calculated in step 4.3 into cells F2, G2, and H2. If multiple samples at different concentration ratios were measured, additional concentration values obtained for those samples can be entered in rows 2 to 10.
- Select the Data/Solver menu function. Enter “$B$15” in the “Set Objective” box and “$B$1:$B$2” into the “By Changing Variable Cells:” box. Select the Min radio button for the To: option. Check the Make Unconstrained Variables Non-Negative checkbox and select GRG Nonlinear as the solving method. Click the Solve button. The best fit Kd1 and Kd2 values will be shown in cell B1 and B2 and the final sum of squared errors in cell B15.
NOTE: If the Solver function is not active, select Options under the File menu in the spreadsheet program. In the Add-ins category select the Solver Add-in under the Inactive Application Add-ins and click the Go button. Check the Solver Add-in checkbox and click OK.

Figure 1: Mass photometry images. (A) Representative native view image of the imaging buffer collected on a clean coverslip and (B) on a coverslip with surface imperfections. (C) Differential ratiometric image of the imaging buffer and (D) the AHT·HT solution. Please click here to view a larger version of this figure.

Figure 2: MP flow chamber preparation and loading. (A) Coverslip holding position for the cleaning procedure. (B) Alignment of the 24 x 24 mm coverslip (middle layer) and the double-sided tape (top layer) on the surface of aluminum foil (bottom layer, not shown). Blue dashed lines show the location of cut lines. (C) Top and side view of the assembled flow chamber with two sample channels, and a picture of the assembled flow chamber. (D) Procedure for sample loading into a flow channel previously filled with buffer. Please click here to view a larger version of this figure.
Results
We have previously examined the interaction of human α-thrombin (HT) and mouse monoclonal anti-human thrombin antibody (AHT) using the MP based assay11. Since the molecular mass of the HT (37 kDa) is below the 40 kDa detection limit, the maximum sample concentration can exceed the 50 nM MP concentration limitation without negatively affecting the resolution of mass distributions. The experiment was planned as a titration series with the AHT antibody at a fixed 25 nM concentration, a...
Discussion
The Mass Photometry based protocol outlined here provides a fast and accurate method of measuring antigen-antibody binding affinities. MP analysis uses a very small amount of material, and additional information—including stoichiometry, oligomerization, and purity—can be assessed from the same data (Figure 5). Without modifications, this method is applicable to the measurements of dissociation constants in the approximately 5 nM to 500 nM range, and for ligand molecules with mole...
Disclosures
The authors have nothing to disclose.
Acknowledgements
We thank Keir Neuman for his critical reading of the manuscript. This work was supported by the intramural program of the NHLBI, NIH.
Materials
| Name | Company | Catalog Number | Comments |
| AcquireMP | Refeyn | MP data collection software | |
| Anti-human thrombin | Haematologic Technologies | AHT-5020 | RRID: AB_2864302 |
| Cotton-tipped applicators | Thorlabs | CTA10 | cotton optical swabs for lens cleaning |
| Coverslips 24x24 mm | Globe Scientific | 1405-10 | |
| Coverslips 24x50 mm | Fisher Scientific | 12-544-EP | |
| DiscoverMP | Refeyn | MP data processing software | |
| Forceps | Electron Microscopy Sciences | 78080-CF | soft-tipped forceps for coverslips handling |
| Human α-thrombin | Haematologic Technologies | HCT-0020 | |
| Immersion oil | Thorlabs | MOIL-30 | |
| Isopropanol | Alfa Aesar | 36644 | |
| Microsoft Excel | Microsoft | spreadsheet | |
| OneMP | Refeyn | Mass Photometry instrument | |
| Origin | OriginLab | scientific graphing software | |
| PBS | Corning | 46-013-CM | 10x stock |
| Syringe filter | Millipore | SLGSR33SS | buffer and sample filtering |
References
- Francis, R. J., et al. A phase I trial of antibody directed enzyme prodrug therapy (ADEPT) in patients with advanced colorectal carcinoma or other CEA producing tumours. British Journal of Cancer. 87 (6), 600-607 (2002).
- van Dyck, C. H. Anti-Amyloid-beta Monoclonal Antibodies for Alzheimer's Disease: Pitfalls and Promise. Biological Psychiatry. 83 (4), 311-319 (2018).
- Vennepureddy, A., Singh, P., Rastogi, R., Atallah, J. P., Terjanian, T. Evolution of ramucirumab in the treatment of cancer - A review of literature. Journal of Oncology Pharmacy Practice. 23 (7), 525-539 (2017).
- Waldmann, T. A. Immunotherapy: past, present and future. Nature Medicine. 9 (3), 269-277 (2003).
- Huang, B., Bates, M., Zhuang, X. Super-resolution fluorescence microscopy. Annual Review of Biochemistry. 78, 993-1016 (2009).
- Rosenberg, M. I. . Protein Analysis and Purification. , (2005).
- Picot, J., Guerin, C. L., Le Van Kim, C., Boulanger, C. M. Flow cytometry: Retrospective, fundamentals and recent instrumentation. Cytotechnology. 64 (2), 109-130 (2012).
- Khan, S. H., Farkas, K., Kumar, R., Ling, J. A versatile method to measure the binding to basic proteins by surface plasmon resonance. Analytical Biochemistry. 421 (2), 385-390 (2012).
- Lofgren, J. A., et al. Comparing ELISA and surface plasmon resonance for assessing clinical immunogenicity of panitumumab. The Journal of Immunology. 178 (11), 7467-7472 (2007).
- Young, G., et al. Quantitative mass imaging of single biological macromolecules. Science. 360 (6387), 423-427 (2018).
- Wu, D., Piszczek, G. Measuring the affinity of protein-protein interactions on a single-molecule level by mass photometry. Analytical Biochemistry. 592, 113575 (2020).
- Cole, D., Young, G., Weigel, A., Sebesta, A., Kukura, P. Label-free single-molecule imaging with numerical-aperture-shaped interferometric scattering microscopy. ACS Photonics. 4 (2), 211-216 (2017).
- Soltermann, F., et al. Quantifying protein-protein interactions by molecular counting with mass photometry. Angewandte Chemie International Edition in English. 59 (27), 10774-10779 (2020).
- Kemmer, G., Keller, S. Nonlinear least-squares data fitting in Excel spreadsheets. Nature Protocols. 5 (2), 267-281 (2010).
Reprints and Permissions
Request permission to reuse the text or figures of this JoVE article
Request PermissionExplore More Articles
This article has been published
Video Coming Soon
Copyright © 2025 MyJoVE Corporation. All rights reserved