
A subscription to JoVE is required to view this content. Sign in or start your free trial.
Method Article
Phospholipid Mediator Induced Transformation in Three-Dimensional Cultures
In This Article
Summary
The present protocol describes the setting up of 3D 'on top' cultures of a non-transformed breast epithelial cell line, MCF10A, that has been modified to study Platelet Activating Factor (PAF) induced transformation. Immuno-fluorescence has been used to assess the transformation and is discussed in detail.
Abstract
Several models have been developed to study cancer, such as rodent models and established cell lines. Valuable insights into carcinogenesis have been provided by studies using these models. Cell lines have provided an understanding of the deregulation of molecular signaling associated with breast tumorigenesis, while rodent models are widely used to study cellular and molecular characteristics of breast cancer in vivo. The establishment of 3D cultures of breast epithelial and cancerous cells aids in bridging the gap between in vivo and in vitro models by mimicking the in vivo conditions in vitro. This model can be used to understand the deregulation of complex molecular signaling events and the cellular characteristics during breast carcinogenesis. Here, a 3D culture system is modified to study a phospholipid mediator-induced (Platelet Activating Factor, PAF) transformation. Immunomodulators and other secreted molecules play a major role in tumor initiation and progression in the breast. In the present study, 3D acinar cultures of breast epithelial cells are exposed to PAF exhibited transformation characteristics such as loss of polarity and altered cellular characteristics. This 3D culture system will assist in shedding light on genetic and/or epigenetic perturbations induced by various small molecule entities in the tumor microenvironment. Additionally, this system will also provide a platform for the identification of novel as well as known genes that may be involved in the process of transformation.
Introduction
A myriad of models are available to study the progression of cancer, each of them being unique and representing a subtype of this complex disease. Each model provides unique and valuable insights into cancer biology and has improved the means to mimic the actual disease condition. Established cell lines grown as a monolayer have provided valuable insights into vital processes in vitro, such as proliferation, invasiveness, migration, and apoptosis1. Though two-dimensional (2D) cell culture has been the traditional tool to investigate the response of mammalian cells to several environmental perturbations, extrapolation of these findings to predict tissue-level responses does not seem sufficiently convincing. The major limitation of the 2D cultures is that the microenvironment created differs largely from that of the breast tissue itself2. 2D culture lacks the interaction of the cells with the extracellular matrix, which is vital for the growth of any tissue. Also, tensile forces experienced by the cell in monolayer cultures hinder the polarity of these cells, thus altering cell signaling and behavior3,4,5. Three-dimensional (3D) culture systems have opened up a new avenue in the field of cancer research with their ability to mimic the in vivo conditions in vitro. Many crucial microenvironmental cues that are lost in 2D cell culture could be re-established using 3D cultures of laminin-rich extracellular matrix (lrECM)6.
Various studies have identified the importance of the tumor microenvironment in carcinogenesis7,8. Inflammation-associated factors are a major part of the microenvironment. Platelet Activating Factor (PAF) is a phospholipid mediator secreted by various immune cells that mediates multiple immune responses9,10. High levels of PAF are secreted by different breast cancer cell lines and are associated with enhanced proliferation11. Studies from our lab have shown that the prolonged presence of PAF in acinar cultures leads to the transformation of breast epithelial cells12. PAF activates the PAF receptor (PAFR), activating the PI3K/Akt signaling axis13. PAFR is also reported to be associated with EMT, invasion, and metastasis14.
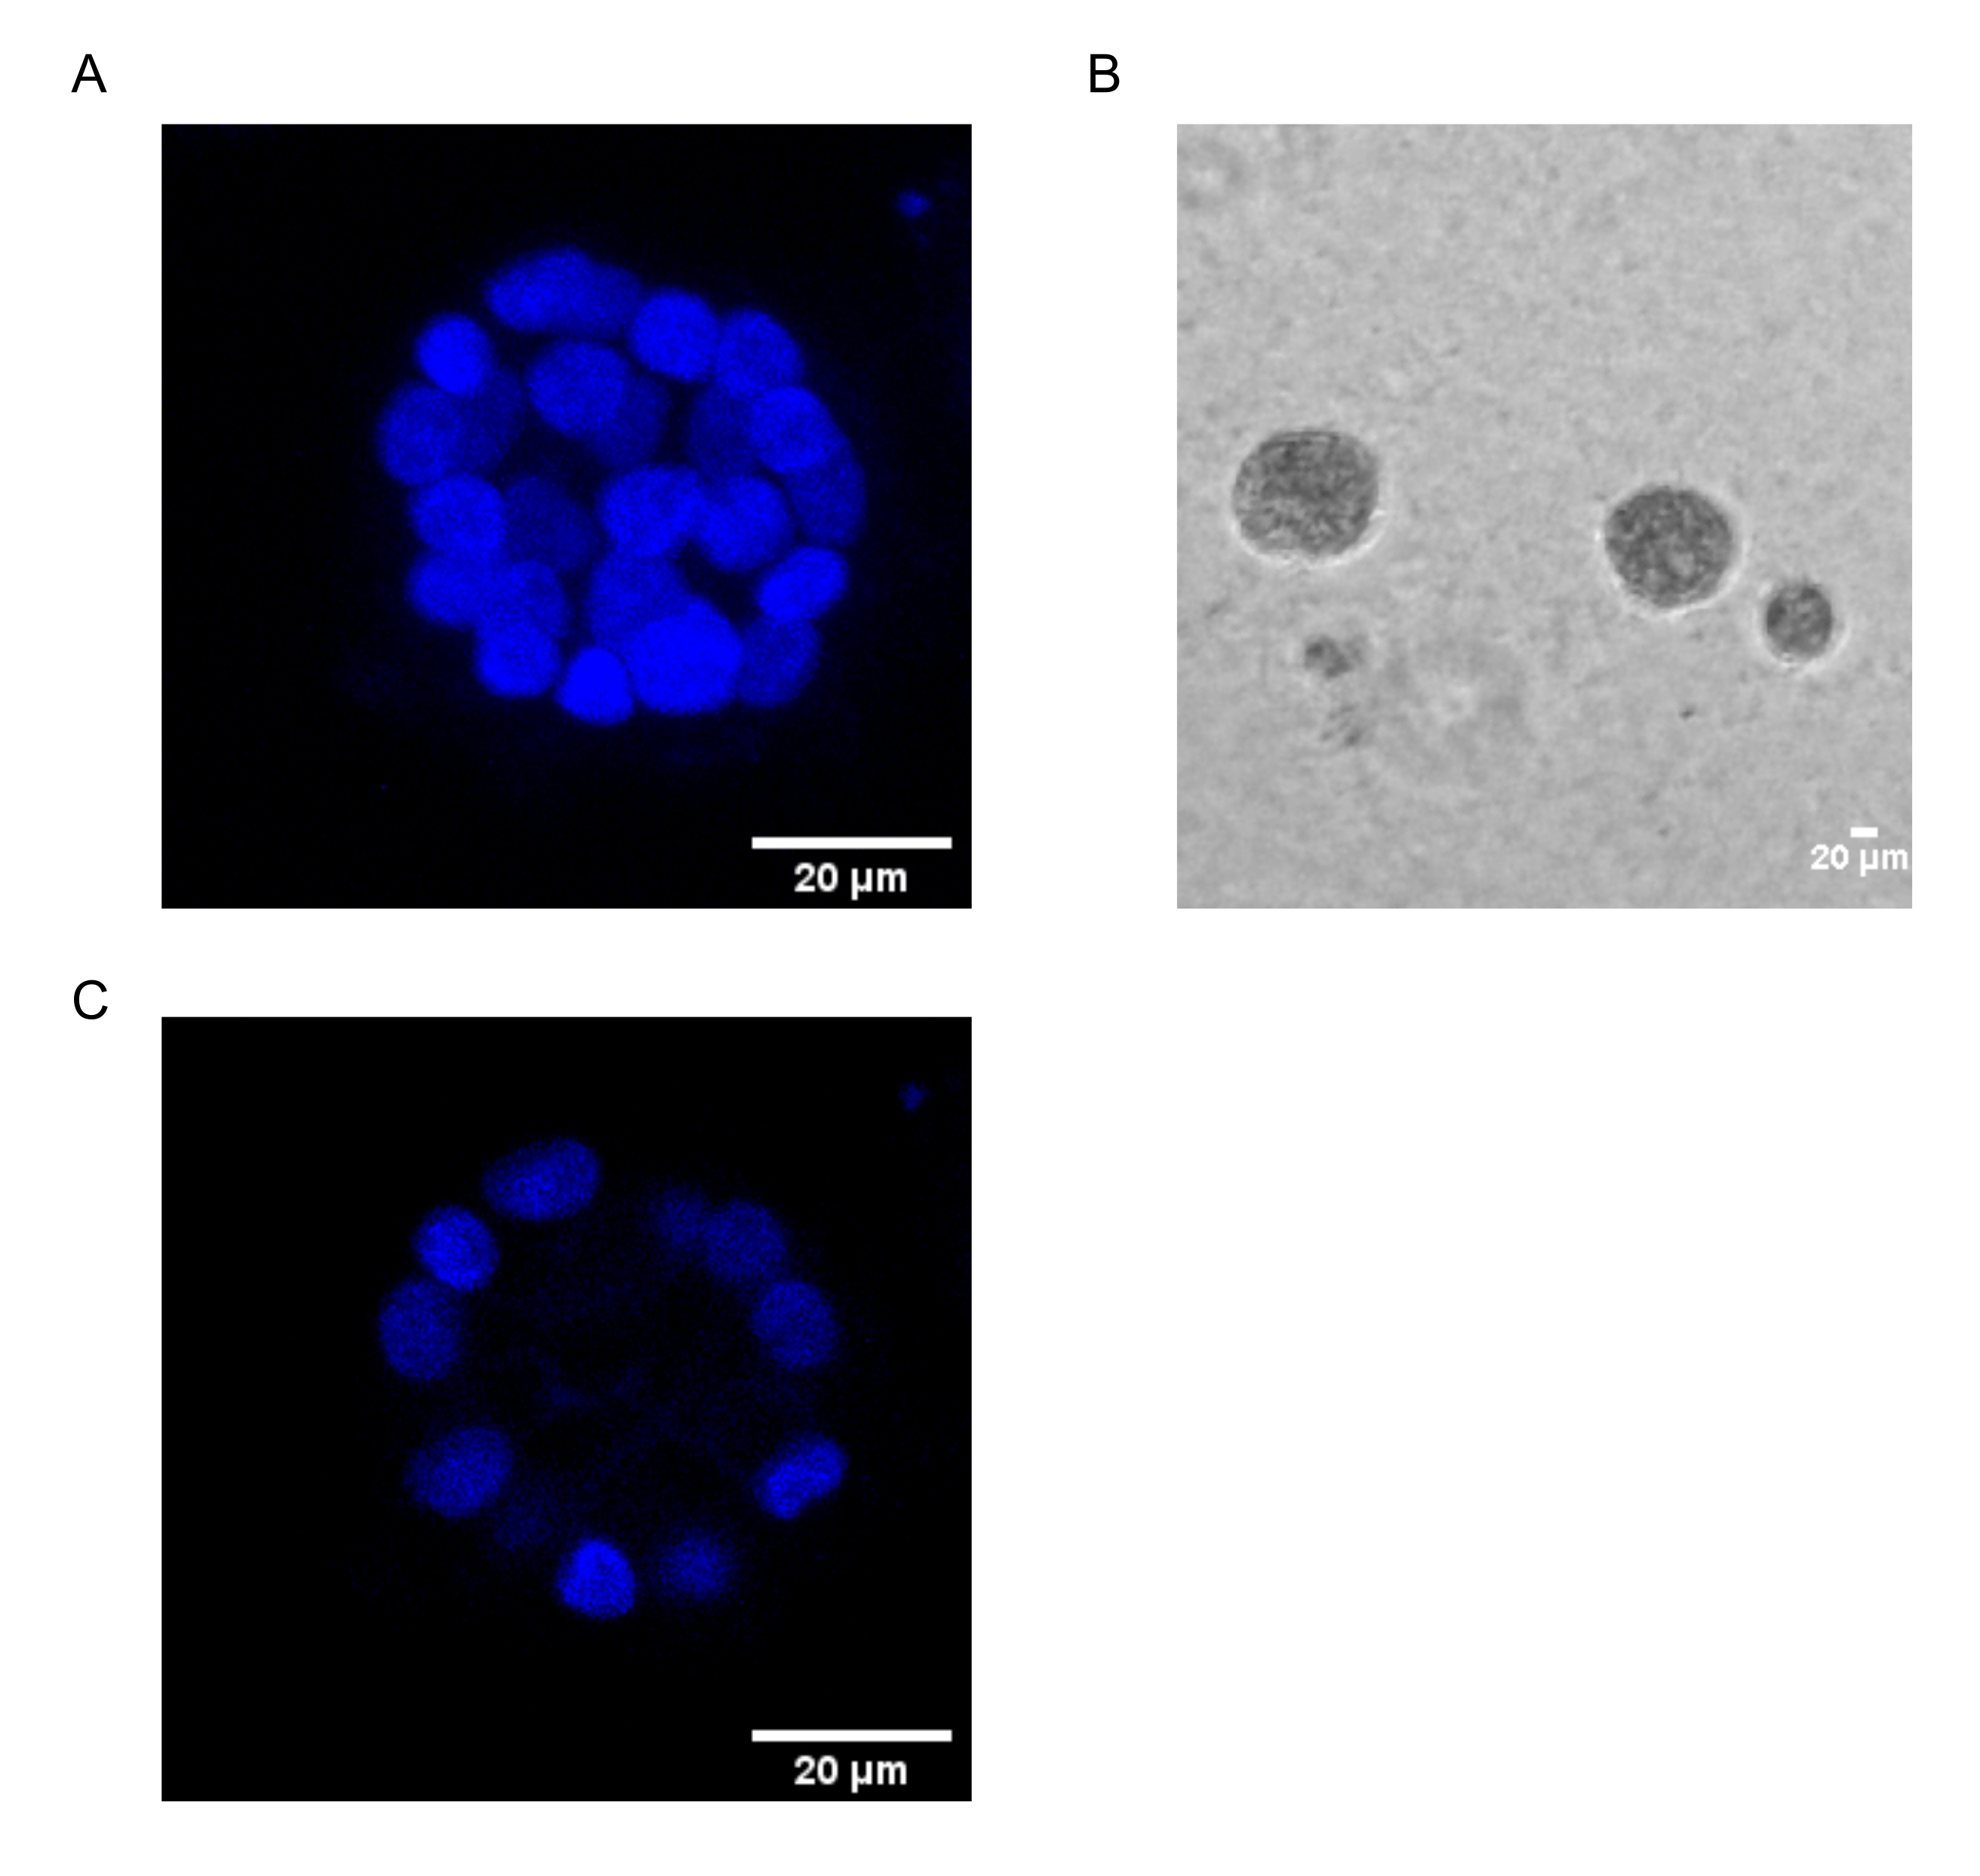
The present protocol demonstrates a model system to study PAF-induced transformation, using 3D cultures of breast epithelial cells, as has been previously described by Chakravarty et al.12. The breast epithelial cells grown on the extracellular matrix (3D cultures) tend to form polarized growth-arrested spheroids. These are called acini and closely resemble the acini of breast tissue, the smallest functional unit of the mammary gland, in vivo15. These spheroids (Figure 1A,B) consist of a monolayer of closely packed polarized epithelial cells surrounding a hollow lumen and attached to the basement membrane (Figure 1C). This process of morphogenesis has been well described in literature16. When seeded on lrECM, the cells undergo division and differentiation to form a cluster of cells, which then polarize from Day 4 onwards. By Day 8, the acini consist of a group of polarized cells that are in direct contact with the extracellular matrix and a cluster of unpolarized cells enclosed within the outer polarized cells, with no contact to the matrix. These unpolarized cells are known to undergo apoptosis by Day 12 of culture, forming a hollow lumen. By Day 16, growth-arrested structures are formed16.

Figure 1: Nuclei of cells in acini stained with a nuclear stain. (A) 3D construction of the acini. (B) Phase Contrast image of MCF10A acini grown on Matrigel for 20 days. (C) The centermost section shows the presence of a hollow lumen. Scale bar = 20 µm. Please click here to view a larger version of this figure.
Unlike 2D cultures, acinar cultures aid in distinguishing normal and transformed cells through apparent morphology changes. Non-transformed breast epithelial cells form acini with a hollow lumen, mimicking the normal human breast acini. These spheroids, upon transformation, show a disrupted morphology characterized by a major loss of polarity (one of the hallmarks of cancer), absence of a lumen, or disruption of the hollow lumen (due to evasion of apoptosis) that may be induced due to deregulation of various genes17,18,19,20. These transformations can be studied using commonly used techniques such as immunofluorescence. Thus, the 3D cell culture model can function as a simple method to investigate the process of breast acinar morphogenesis and breast carcinogenesis. Establishing a 3D culture system to understand the effect of a phospholipid mediator, PAF, will assist in high throughput preclinical drug screening.
This work has adapted the 3D 'on top' culture protocol16,21 for studying transformation induced by PAF22. The phenotypic changes induced by exposure of the acini to the phospholipid mediator were studied using immunofluorescence. Various polarity and epithelial to mesenchymal transition (EMT) markers12,16 were used in the study. Table 1 mentions their normal localization and their expected phenotype upon transformation.
| Antibodies | Marks | Normal localization | Transformed phenotype |
| α6-Integrin | Basolateral | Basal with weak lateral stain | Strong lateral / Apical stain |
| β-Catenin | Cell-cell junction | Basolateral | Abnormal / nuclear or cytoplasmic localization |
| Vimentin | EMT | Absent / weak presence | Up-regulation |
Table 1: Markers used in the study. Different markers used with their localization in the presence and absence of PAF treatment.
This method can be best utilized to study/screen plausible drugs and target genes for various breast cancer subtypes. This can provide a drug response data closer to the in vivo scenario, aiding in faster and more reliable drug development. Also, this system can be used to study the molecular signaling associated with drug response and drug resistance.
Access restricted. Please log in or start a trial to view this content.
Protocol
1. Seeding MCF10A cells in lrECM
- Maintain MCF10A cells (adherent breast epithelial cells) in the growth medium. Passage the cells every 4 days.
NOTE: Composition of growth medium: high glucose DMEM without sodium pyruvate containing horse serum (5%), insulin (10 µg/mL), hydrocortisone (0.5 µg/mL), epidermal growth factor, EGF (20 ng/mL), of cholera toxin (100 ng/mL), and penicillin-streptomycin (100 units/mL) (see Table of Materials). - Thaw lrECM (see Table of Materials) on ice 20 min before the start of the experiment. The day of seeding the cells is generally considered Day 0.
- For trypsinizing the cells, aspirate the medium, and wash with 2 mL of PBS. Add 900 µL of 0.05% Trypsin-EDTA and incubate at 37 °C for ~15 min or till the cells are completely trypsinized.
- Prepare a bed of lrECM in eight wells of a chambered cover glass slide (see Table of Materials).
- When the cells are trypsinizing, coat each well with 60 µL of lrECM and place it in a 37 °C CO2 incubator for a maximum of 15 min.
- Prepare the cell suspension following the steps below.
- Following the complete dislodging of cells, add 5 mL of re-suspension medium to quench trypsin activity and spin the cells at 112 x g for 10 min at 25 °C.
NOTE: Composition of re-suspension medium: high glucose DMEM without sodium pyruvate, supplemented with horse serum (20%) and penicillin-streptomycin (100 units/mL). - Aspirate the spent medium and re-suspend the cells in 2 mL of assay medium. Mix the suspension well to ensure the formation of a single cell suspension.
NOTE: Composition of assay medium: high glucose DMEM without sodium pyruvate, supplemented with horse serum (2%), hydrocortisone (0.5 µg/mL), cholera toxin (100 ng/mL), insulin (10 µg/mL), and penicillin-streptomycin (100 units/mL). - Count the cells using a hemocytometer and calculate the volume of cell suspension needed to seed 6 x 10³ cells in each well.
NOTE: It is generally preferred to include one extra well in the calculation to account for any pipetting errors. - According to the number of wells required, dilute the cell suspension in overlay medium.
NOTE: Overlay medium composition for a single well is as follows: 400 µL of assay medium, 8 µL of lrECM (2% final), and 0.02 µL of 100 µg/mL of EGF (5 ng/mL final).
- Following the complete dislodging of cells, add 5 mL of re-suspension medium to quench trypsin activity and spin the cells at 112 x g for 10 min at 25 °C.
- Perform seeding of the cells.
- Add 400 µL of the diluted cell suspension to the prepared lrECM beds (step 1.4), carefully ensuring not to disturb the lrECM bed. Incubate at 37 °C in a humidified 5% CO2 incubator.
2. PAF treatment
- Add PAF 3 h following the seeding of cells. Prepare a 100 µM stock of PAF in PBS and add the required volume of 0.2 µL in each well (which corresponds to 200 nM).
- Add the same concentration of PAF during every media change.
3. Re-feeding with fresh media
- Replenish the cells with fresh medium every 4 days (i.e., Day 4, Day 8, Day 12, and Day 16).
4. Immunofluorescence study to detect phenotypic changes induced by prolonged PAF exposure
- After 20 days of culturing, carefully pipette out the medium from each well and wash the wells with 400 µL of pre-warmed PBS.
- Fix the acinar structures by adding 400 µL of 4% paraformaldehyde (freshly prepared by diluting 16% paraformaldehyde in 1x PBS) and incubating for 20 min at room temperature.
- Rinse the wells once with ice-cold PBS and permeabilize with PBS containing 0.5% Triton X-100 for 10 min at 4 °C.
- After 10 min, immediately but carefully pipette out the Triton-X 100 solution and rinse with 400 µL of PBS-glycine (freshly prepared by adding a pinch of glycine in 1x PBS). This is repeated thrice for 15 min each.
- Add 400 µL of the primary blocking solution comprising 10% goat serum (see Table of Materials) in immunofluorescence (IF) buffer and incubate at room temperature for 60 min.
NOTE: Composition of IF buffer: 0.05% sodium azide, 0.1% BSA, 0.2% Triton-X 100, and 0.05% Tween (20 in 1 PBS). - Remove the primary blocking solution, add 200 µL of 2% secondary blocking antibody (F(ab')2 fragment of antibody raised in goat against mouse antigen, see Table of Materials) prepared in primary blocking solution, and leave it for 45-60 min at room temperature.
- Prepare the primary antibody (see Table of Materials) in 2% secondary blocking antibody solution in a 1:100 dilution. After removing the secondary blocking solution, add the freshly prepared antibody and incubate overnight at 4 °C.
- The previous step may elicit liquefaction of the basement membrane. Before proceeding with the experiment, wait until the slide reaches room temperature. Carefully pipette the primary antibody solution and wash it thrice with 400 µL of IF buffer.
- During the last wash with IF buffer, prepare a 1:200 dilution of the fluorophore-conjugated secondary antibody (see Table of Materials) in the primary blocking solution. Incubate the slides in the secondary antibody solution for 40-60 min at room temperature.
- Rinse the slides with 400 µL of IF buffer for 20 min, followed by two washes with PBS for 10 min each.
- Counter-stain the nuclei with PBS containing 0.5 ng/mL of nuclear stain (see Table of Materials) for 5-6 min at room temperature. Wash the slides thrice with 400 µL of PBS to remove excess stain.
- Carefully pipette out the entire PBS and ensure removal of the residual solution. Add one drop of mounting reagent (see Table of Materials) into each well and allow it to stand at room temperature overnight.
- Store the slides at room temperature and image the slides as soon as possible.
- Image under 40x or 63x magnification on a confocal microscope (see Table of Materials), taking optical Z-sections of 0.6 mm step size (NA = 1.4).
- Open the acquired images with an image processing software (see Table of Materials). Demonstrate the morphological differences using 3D projections.
NOTE: The centermost optical Z-section can be best used to show differences in the localization of polarity markers. These can be quantified manually to represent the percentage of spheroids showing that specific staining pattern. - To illustrate differences in the expression of proteins, perform a semi-quantitative analysis measuring the mean grey value or calculating corrected total cell fluorescence (CTCF)23. Represent the data as violin or dot plots.
Access restricted. Please log in or start a trial to view this content.
Results
MCF10A cells, upon exposure to PAF treatment, form acinar structures with very distinct phenotypes. α6-integrin was found to be mislocalized with more apical staining. A few acini also showed discontinuous staining (Figure 2A). Both these phenotypes indicate the loss of basal polarity, as evidenced from literature24,25. Earlier reports indicate the controversial role of α6-integrin in cancer metastasis. α6-integrin is ...
Access restricted. Please log in or start a trial to view this content.
Discussion
Established cell line-based models are widely used to study the process of carcinogenesis. Monolayer cultures of cells continue to provide insights into the various molecular signaling pathways that mediate characteristic changes in cancer cells32. Studies on the role of well-known oncogenes such as Ras, Myc, and mutated p53 were first reported using monolayer cultures as the model system33,34,35,
Access restricted. Please log in or start a trial to view this content.
Disclosures
The authors declare no potential conflicts of interest.
Acknowledgements
We thank the IISER Pune Microscopy Facility for access to equipment and infrastructure and support for the experiments. This study was supported by a grant from the Department of Biotechnology (DBT), Govt. of India (BT/PR8699/MED/30/1018/2013), Science and Engineering Research Board (SERB), Govt. of India (EMR/2016/001974) and partly by IISER, Pune Core funding. A. K. was funded by CSIR-SRF fellowship, L.A. was funded through DST-INSPIRE fellowship, V.C was funded by DBT (BT/PR8699/MED/30/1018/2013).
Access restricted. Please log in or start a trial to view this content.
Materials
| Name | Company | Catalog Number | Comments |
| 0.05% Trypsin EDTA | Invitrogen | 25300062 | |
| 16% paraformaldehyde | Alfa Aesar | AA433689M | |
| Anti Mouse Alexa Flour 488 | Invitrogen | A11029 | |
| Anti Rabbit Alexa Flour 488 | Invitrogen | A-11008 | |
| BSA | Sigma | A7030 | |
| Chamber Coverglass | Nunc | 155409 | |
| Cholera Toxin | Sigma | C8052-1MG | 1 mg/mL in dH2O |
| Confocal Microscope | Leica | Leica SP8 | |
| DMEM | Gibco | 11965126 | |
| EDTA | Sigma | E6758 | |
| EGF | Sigma | E9644-0.2MG | 100 mg/mL in dH2O |
| F(ab’)2 fragment of antibody raised in goat against mouse antigen | Jackson Immunoresearch | 115-006-006 | |
| GM130 antibody | Abcam | ab52649 | |
| Goat Serum | Abcam | ab7481 | |
| Hoechst | Invitrogen | 33258 | |
| Horse Serum | Gibco | 16050122 | |
| Hydrocortisone | Sigma | H0888 | 1 mg/mL in ethanol |
| Image Processing Software | ImageJ | ||
| Insulin | Sigma | I1882 | 10 mg/mL stock dH2O |
| lrECM (Matrigel) | Corning | 356231 | |
| Mounting reagent (Slow fade Gold Anti-fade) | Invitrogen | S36937 | |
| Nuclear Stain (Hoechst) | Invitrogen | 33258 | |
| PAF | Cayman Chemicals | 91575-58-5 | Methylcarbamyl PAF C-16, procured as a 10 mg/mL in ethanol |
| Penicillin-Streptomycin | Lonza | 17-602E | |
| Sodium Azide | Sigma | S2002 | |
| Tris Base | Sigma | B9754 | |
| Triton X-100 | Sigma | T8787 | |
| Tween 20 | Sigma | P9416 | |
| Vimentin antibody | Abcam | ab92547 | |
| α6-integrin antibody | Millipore | MAB1378 |
References
- Lacroix, M., Leclercq, G. Relevance of breast cancer cell lines as models for breast tumours: an update. Breast Cancer Research and Treatment. 83 (3), 249-289 (2004).
- Vargo-Gogola, T., Rosen, J. M. Modelling breast cancer: one size does not fit all. Nature Reviews Cancer. 7 (9), 659-672 (2007).
- Runswick, S. K., O'Hare, M. J., Jones, L., Streuli, C. H., Garrod, D. R. Desmosomal adhesion regulates epithelial morphogenesis and cell positioning. Nature Cell Biology. 3 (9), 823-830 (2001).
- Streuli, C. H., Bailey, N., Bissell, M. J. Control of mammary epithelial differentiation: basement membrane induces tissue-specific gene expression in the absence of cell-cell interaction and morphological polarity. Journal of Cell Biology. 115 (5), 1383-1395 (1991).
- Streuli, C. H., et al. Laminin mediates tissue-specific gene expression in mammary epithelia. Journal of Cell Biology. 129 (3), 591-603 (1995).
- Bissell, M. J., Kenny, P. A., Radisky, D. C. Microenvironmental regulators of tissue structure and function also regulate tumor induction and progression: the role of extracellular matrix and its degrading enzymes. Cold Spring Harbor Symposia on Quantitative Biology. 70, 343-356 (2005).
- Heinrich, E. L., et al. The inflammatory tumor microenvironment, epithelial mesenchymal transition and lung carcinogenesis. Cancer Microenvironment. 5 (1), 5-18 (2012).
- Gonda, T. A., Tu, S., Wang, T. C. Chronic inflammation, the tumor microenvironment and carcinogenesis. Cell Cycle. 8 (13), 2005-2013 (2009).
- Berdyshev, E. V., Schmid, P. C., Krebsbach, R. J., Schmid, H. H. Activation of PAF receptors results in enhanced synthesis of 2-arachidonoylglycerol (2-AG) in immune cells. The FASEB Journal. 15 (12), 2171-2178 (2001).
- Rola-Pleszczynski, M., Stankova, J. Cytokine gene regulation by PGE(2), LTB(4) and PAF. Mediators of Inflammation. 1 (2), 5-8 (1992).
- Bussolati, B., et al. PAF produced by human breast cancer cells promotes migration and proliferation of tumor cells and neo-angiogenesis. The American Journal of Pathology. 157 (5), 1713-1725 (2000).
- Chakravarty, V., et al. Prolonged exposure to platelet activating factor transforms breast epithelial cells. Frontiers in Genetics. 12, 634938(2021).
- Chen, J., et al. Platelet-activating factor receptor-mediated PI3K/AKT activation contributes to the malignant development of esophageal squamous cell carcinoma. Oncogene. 34 (40), 5114-5127 (2015).
- Chen, J., et al. Feed-forward reciprocal activation of PAFR and STAT3 regulates epithelial-mesenchymal transition in non-small cell lung cancer. Cancer Research. 75 (19), 4198-4210 (2015).
- Vidi, P. A., Bissell, M. J., Lelievre, S. A. Three-dimensional culture of human breast epithelial cells: the how and the why. Methods in Molecular Biology. 945, 193-219 (2013).
- Debnath, J., Muthuswamy, S. K., Brugge, J. S. Morphogenesis and oncogenesis of MCF-10A mammary epithelial acini grown in three-dimensional basement membrane cultures. Methods. 30 (3), 256-268 (2003).
- Barcellos-Hoff, M. H., Aggeler, J., Ram, T. G., Bissell, M. J. Functional differentiation and alveolar morphogenesis of primary mammary cultures on reconstituted basement membrane. Development. 105 (2), 223-235 (1989).
- Petersen, O. W., Ronnov-Jessen, L., Howlett, A. R., Bissell, M. J. Interaction with basement membrane serves to rapidly distinguish growth and differentiation pattern of normal and malignant human breast epithelial cells. Proceedings of the National Academy of Sciences. 89 (19), 9064-9068 (1992).
- Shaw, K. R., Wrobel, C. N., Brugge, J. S. Use of three-dimensional basement membrane cultures to model oncogene-induced changes in mammary epithelial morphogenesis. Journal of Mammary Gland Biology and Neoplasia. 9 (4), 297-310 (2004).
- Weaver, V. M., Fischer, A. H., Peterson, O. W., Bissell, M. J. The importance of the microenvironment in breast cancer progression: recapitulation of mammary tumorigenesis using a unique human mammary epithelial cell model and a three-dimensional culture assay. Biochemistry and Cell Biology. 74 (6), 833-851 (1996).
- Lee, G. Y., Kenny, P. A., Lee, E. H., Bissell, M. J. Three-dimensional culture models of normal and malignant breast epithelial cells. Nature Methods. 4 (4), 359-365 (2007).
- Bodakuntla, S., Libi, A. V., Sural, S., Trivedi, P., Lahiri, M. N-nitroso-N-ethylurea activates DNA damage surveillance pathways and induces transformation in mammalian cells. BMC Cancer. 14, 287(2014).
- Banerjee, A., et al. A rhodamine derivative as a "lock" and SCN− as a "key": visible light excitable SCN− sensing in living cells. Chemical Communications. 49 (25), 2527-2529 (2013).
- Ren, G., et al. Reduced basal nitric oxide production induces precancerous mammary lesions via ERBB2 and TGFbeta. Scientific Reports. 9 (1), 6688(2019).
- Anandi, L., Chakravarty, V., Ashiq, K. A., Bodakuntla, S., Lahiri, M. DNA-dependent protein kinase plays a central role in transformation of breast epithelial cells following alkylation damage. Journal of Cell Science. 130 (21), 3749-3763 (2017).
- Sonnenberg, A., et al. Integrin alpha 6/beta 4 complex is located in hemidesmosomes, suggesting a major role in epidermal cell-basement membrane adhesion. Journal of Cell Biology. 113 (4), 907-917 (1991).
- Pignatelli, M., Cardillo, M. R., Hanby, A., Stamp, G. W. Integrins and their accessory adhesion molecules in mammary carcinomas: loss of polarization in poorly differentiated tumors. Human Pathology. 23 (10), 1159-1166 (1992).
- Natali, P. G., et al. Changes in expression of alpha 6/beta 4 integrin heterodimer in primary and metastatic breast cancer. British Journal of Cancer. 66 (2), 318-322 (1992).
- Davis, T. L., Cress, A. E., Dalkin, B. L., Nagle, R. B. Unique expression pattern of the alpha6beta4 integrin and laminin-5 in human prostate carcinoma. Prostate. 46 (3), 240-248 (2001).
- Liu, J. S., Farlow, J. T., Paulson, A. K., Labarge, M. A., Gartner, Z. J. Programmed cell-to-cell variability in Ras activity triggers emergent behaviors during mammary epithelial morphogenesis. Cell Reports. 2 (5), 1461-1470 (2012).
- Liu, C. Y., Lin, H. H., Tang, M. J., Wang, Y. K. Vimentin contributes to epithelial-mesenchymal transition cancer cell mechanics by mediating cytoskeletal organization and focal adhesion maturation. Oncotarget. 6 (18), 15966-15983 (2015).
- Kapalczynska, M., et al. 2D and 3D cell cultures-a comparison of different types of cancer cell cultures. Archives of Medical Science. 14 (4), 910-919 (2018).
- Schulze, A., Lehmann, K., Jefferies, H. B., McMahon, M., Downward, J. Analysis of the transcriptional program induced by Raf in epithelial cells. Genes & Development. 15 (8), 981-994 (2001).
- McCarthy, S. A., Samuels, M. L., Pritchard, C. A., Abraham, J. A., McMahon, M. Rapid induction of heparin-binding epidermal growth factor/diphtheria toxin receptor expression by Raf and Ras oncogenes. Genes & Development. 9 (16), 1953-1964 (1995).
- Willis, A., Jung, E. J., Wakefield, T., Chen, X. Mutant p53 exerts a dominant negative effect by preventing wild-type p53 from binding to the promoter of its target genes. Oncogene. 23 (13), 2330-2338 (2004).
- Haupt, S., Raghu, D., Haupt, Y. Mutant p53 drives cancer by subverting multiple tumor suppression pathways. Frontiers in Oncology. 6, 12(2016).
- Langhans, S. A. Three-dimensional in vitro cell culture models in drug discovery and drug repositioning. Frontiers in Pharmacology. 9, 6(2018).
- Edmondson, R., Broglie, J. J., Adcock, A. F., Yang, L. Three-dimensional cell culture systems and their applications in drug discovery and cell-based biosensors. ASSAY and Drug Development Technologies. 12 (4), 207-218 (2014).
- Lv, D., Hu, Z., Lu, L., Lu, H., Xu, X. Three-dimensional cell culture: A powerful tool in tumor research and drug discovery. Oncology Letters. 14 (6), 6999-7010 (2017).
- Jensen, C., Teng, Y. Is it time to start transitioning from 2D to 3D cell culture. Frontiers in Molecular Biosciences. 7, 33(2020).
- Saraiva, D. P., Matias, A. T., Braga, S., Jacinto, A., Cabral, M. G. Establishment of a 3D co-culture with MDA-MB-231 breast cancer cell line and patient-derived immune cells for application in the development of immunotherapies. Frontiers in Oncology. 10, 1543(2020).
Access restricted. Please log in or start a trial to view this content.
Reprints and Permissions
Request permission to reuse the text or figures of this JoVE article
Request PermissionThis article has been published
Video Coming Soon
Copyright © 2025 MyJoVE Corporation. All rights reserved