
A subscription to JoVE is required to view this content. Sign in or start your free trial.
Method Article
Imaging of the Microstructural Failure Mechanism in the Human Hip
In This Article
Summary
The protocol enables the measurement of the deformation of the bone microstructure in the entire proximal human femur and its toughness by combining large-volume micro-CT scanning, a custom-made compressive stage, and advanced image processing tools.
Abstract
Imaging the bone microstructure under progressively increasing loads allows for observing the microstructural failure behavior of bone. Here, we describe a protocol for obtaining a sequence of three-dimensional microstructural images of the entire proximal femur under progressively increasing deformation, causing clinically relevant fractures of the femoral neck. The protocol is demonstrated using four femora from female donors aged 66-80 years at the lower end of bone mineral density in the population (T-score range = −2.09 to −4.75). A radio-transparent compressive stage was designed for loading the specimens replicating a one-leg stance, while recording the applied load during micro-computed tomography (micro-CT) imaging. The field of view was 146 mm wide and 132 mm high, and the isotropic pixel size was 0.03 mm. The force increment was based on finite-element predictions of the fracture load. The compressive stage was used to apply the displacement to the specimen and enact the prescribed force increments. Sub-capital fractures due to opening and shear of the femoral neck occurred after four to five load increments. The micro-CT images and the reaction force measurements were processed to study the bone strain and energy absorption capacity. Instability of the cortex appeared at the early loading steps. The subchondral bone in the femoral head displayed large deformations reaching 16% before fracture, and a progressive increase in the support capacity up to fracture. The deformation energy linearly increased with the displacement up to fracture, while the stiffness decreased to near-zero values immediately before fracture. Three-fourths of the fracture energy was taken by the specimen during the final 25% force increment. In conclusion, the protocol developed revealed a remarkable energy absorption capacity, or damage tolerance, and a synergic interaction between the cortical and trabecular bone at an advanced donor age.
Introduction
Fractures of the femoral neck are a major burden to the aging population. Micro-computed tomography (micro-CT) imaging and concomitant mechanical testing allow for observing the bone microstructure and studying its relationship to bone strength, its age-related changes, and displacements under load1,2. However, until recently, micro-CT studies of bone under load were limited to excised bone cores3, small animals4, and human spine units5. The present protocol can quantify the displacement of the microstructure of the entire proximal human femur under load and after a fracture.
Several studies have been conducted to investigate the failure of the human femur, and at times, these have reached contrasting conclusions. For example, the age-related thinning of the cortical and trabecular structures is thought to determine the age-related susceptibility to fracture by causing elastic instability of the bone6,7, which is in apparent contrast with the high coefficient of determination of cortical strain and femoral strength predictions assuming no elastic instability (R2 = 0.80-0.97)8,9. Nevertheless, such studies have systematically underestimated the femoral strength (by 21%-29%), thus bringing into question the brittle and quasi-brittle bone responses implemented in the models8,10. One possible explanation for these apparently contrasting findings may reside in a different fracture behavior of entire bones compared to isolated bone cores. Therefore, observing the deformation and fracture responses of the bone microstructure in entire proximal femurs may advance knowledge of hip fracture mechanics and related applications.
Current methods for imaging entire human bones with micrometric resolution are limited. The gantry and the detector size must provide a suitable working volume to host the human proximal femur (approximately 13 cm x 10 cm, width x length) and possibly a pixel size in the order of 0.02-0.03 mm to ensure that relevant micro-architectural features can be captured11. These specifications can currently be met by some synchrotron facilities1 and some commercially available large-volume micro-CT scanners12,13. The compressive stage has to be radio-transparent in order to minimize X-ray attenuation while generating a force sufficient for causing a fracture to the human femur (e.g., between 0.9 kN and 14.3 kN for elderly white women)14. This large fracture load variation complicates the planning of the number of load steps to fracture, the overall experiment time, and the corresponding amount of data produced. To address this problem, the fracture load and location can be estimated via finite-element modeling by using the bone density distribution of the specimen from clinical computed tomography (CT) images1,2. Finally, after the experiment, the large volume of data generated needs to be processed for studying the failure mechanisms and energy dissipation capacity in the entire human femur.
Here, we describe a protocol for obtaining a sequence of three-dimensional microstructural images of the entire proximal femur under progressively increasing deformation, which causes clinically relevant fractures of the femoral neck2. The protocol includes planning the stepwise increment of the specimen compression, loading via a custom radio-transparent compressive stage, imaging via a large-volume micro-CT scanner, and processing the images and the load profiles.
Protocol
The protocol was developed and tested with 12 femur specimens received from a body donation program. The specimens were obtained fresh and stored at −20 °C at the Biomechanics and Implants Laboratory of Flinders University (Tonsley, South Australia, Australia). Bone moisture was maintained throughout the experiment. The donors were Caucasian women (66-80 years of age). Ethics clearance was obtained from the Social and Behavioural Research Ethics Committee (SBREC) of Flinders University (Project # 6380).
1. Planning a specimen-specific load step increment
- Scan the femur specimen using a clinical CT scanner targeting a slice thickness and an in-plane pixel size of approximately 0.5-0.7 mm. This step can be completed by an expert radiographer at any public imaging facility using standard pre-recorded imaging protocols for bone visualization.
- Together with the specimen, scan a CT densitometry calibration phantom with five known concentrations of dipotassium hydrogen phosphate (K2HPO4, equivalent density range approximately between 59 mg∙cm−3 and 375 mg∙cm−3).
- Segment the bone geometry from the clinical CT images15, mesh the segmented geometry of the bone, and map the isotropic material properties element by element to the calibrated bone density values by using the density-to-elastic modulus relationship reported by Schileo et al.8. Save the mesh for further analysis in the finite-element software. Complete each step by following the relevant guidelines provided with the segmentation and finite-element software.
- Import the mesh into the finite-element software. Fully constrain the 3-6 mm distal end of the model. Apply a nominal force of 1,000 N, adducted by 8° from the femoral shaft axis in the coronal plane and passing through the center of the femoral head. This loading condition mimics a static one-leg stance task (orthoload.com).
- Solve the finite-element model using the built-in PCG solver (convergence tolerance: 1 x 10⁻⁷).
NOTE: Here the finite element software ANSYS was used.- Generate an element table containing the first and third principal strain components at the element centroid by executing the following commands:
/POST1
ETABLE,, EPTO1,1
ETABLE,, EPTO3,3 - Calculate the strain ratio between the first and third principal strain components in the model and the bone yield strain in tension (0.73% strain) and compression (1.04% strain)8 (Figure 1) by executing the following commands:
SMULT,RFT,EPTO1, ,1/0.0074,1,
SMULT, RFT,EPTO3, ,1/0.0104,1,
- Generate an element table containing the first and third principal strain components at the element centroid by executing the following commands:
- Scale the nominal force by the peak strain ratio in both tension and compression, and discard the biggest of the two in order to obtain an estimate of the fracture load. Determine the load increment as 1/4 of the calculated fracture load1.

Figure 1: The calculation of the fracture load. The finite-element strain map, the equations used to convert the nominal force into the fracture load (left), and the loading scheme displaying the femur (center right), the distal aluminum (top right) cup, and the polyethylene pressure socket (bottom right). Please click here to view a larger version of this figure.
2. Preparation of the femur specimen assembly (Figure 2)
- Remove the specimen from the freezer (−20 °C).
- Thaw at room temperature (RT) for 24 h while keeping the specimen in a waterproof plastic bag wrapped in absorbent material soaked in a physiological solution to maintain the bone moisture.
- Cut the femoral diaphysis at 180 mm from the proximal femoral head.
- Center the femoral head on the vertical axis of the alignment rig by aligning the concave-shaped polyethylene pressure socket (Figure 2D) and the femur head.
- Align the plane containing the femoral neck and the diaphysis axis with the frontal plane (Figure 2).
- Rotate the diaphyseal axis to 8° adduction so that the vertical axis represents the orientation of the hip reaction force during a static single-leg stance (Figure 2).
- Prepare the dental cement by following manufacturer's instructions.
- Pot the distal end of the specimen in an aluminum potting cup that is 55 mm deep, filling up the aluminium cup with dental cement. Allow no less than 30 min for the cement to complete curing.
- Store the specimen assembly at −20 °C.

Figure 2: The alignment rig. A frontal (left) and lateral (right) photo of the alignment rig displaying (A) the frame, (B) the aluminum potting cup, (C) a synthetic femur model, and (D) the spherically shaped pressure socket. Please click here to view a larger version of this figure.
3. Compression stage assembly
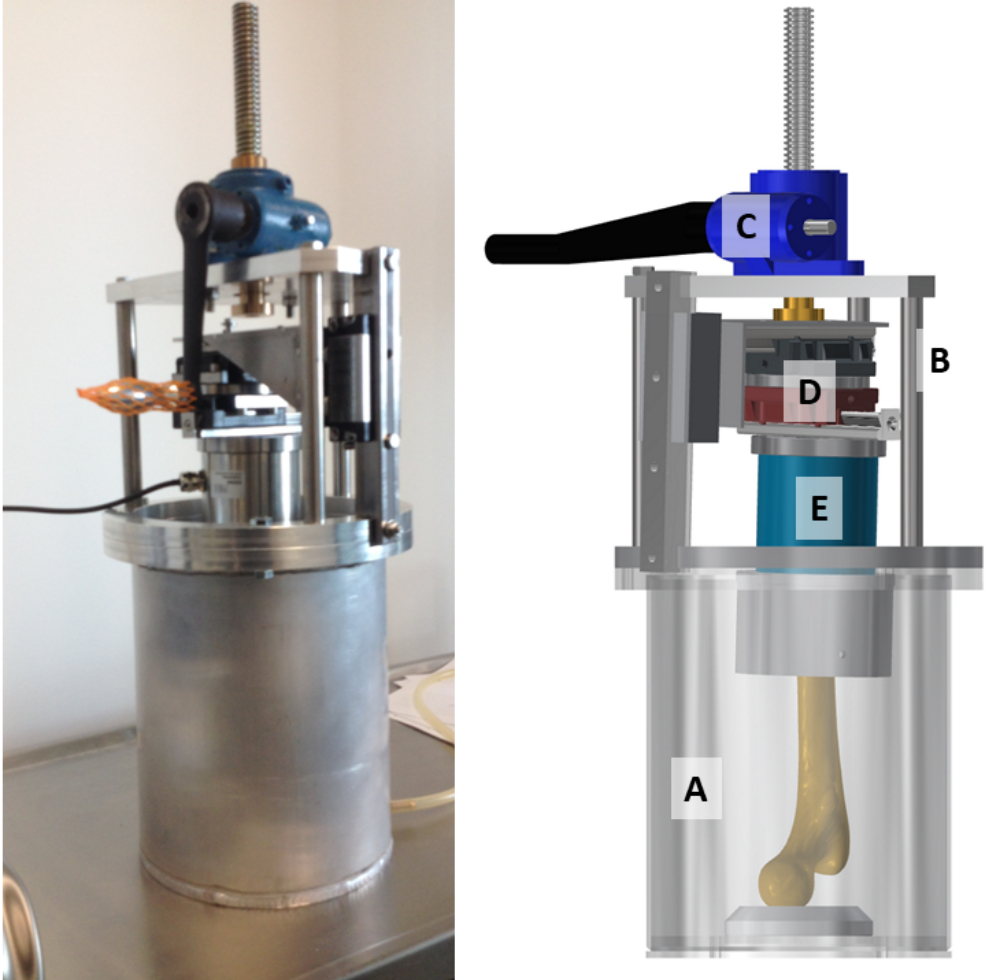
NOTE: The compression stage's external dimensions are 245 mm diameter, 576 mm height, and 14 kg weight, excluding the sample. The compression stage consists of two main parts: the compression chamber and the actuator, which are assembled as follows:
- Compression chamber
- Mount the polyethylene pressure socket (104 mm diameter, 60 mm height) at the bottom of the aluminum cylinder (203 mm diameter, 3 mm wall thickness), which is closed by a welded aluminum plate at one end (bottom).
- Actuator
- Assemble the top structure using the disk, the three rods, the triangular plate, and the vertical rail (Figure 3).
- Mount the screw-jack mechanism (stroke: 150 mm, maximal load: 10,000 N, gear ratio: 27:1, displacement per revolution: 0.148 mm) on the triangular plate.
- Mount the angular adaptor onto the linear rail.
- Mount the low-friction x-y table onto the angular adaptor.
- Mount the six degrees of freedom load cell (maximal measurement error: 0.005%; maximal force: 10,000 N; maximal torque: 500 Nm) onto the low-friction table by aligning the x-z plane of the load cell to the frontal plane of the top structure.
- Connect the actuator screw to the angular adaptor.

Figure 3: The custom-made radiotransparent compression stage assembly. A photo (left) and a model (right) of the compressive stage. (A) The compression chamber, which is a 3 mm thick aluminium cylinder closed at the bottom; (B) the actuator assembly with the top structure; (C) the screw-jack mechanism; (D) the low-friction x-y table; and (E) the six-axis load cell are displayed and indicated on the model. Please click here to view a larger version of this figure.
4. Setting up the experiment
- Thaw the specimen at RT for 24 h while keeping it in a waterproof plastic bag wrapped in absorbent material soaked in a physiological solution to maintain the bone moisture.
- Mount the aluminium cup specimen assembly to the load cell by aligning the frontal plane of the specimen assembly with that of the actuator.
- Assemble the top structure, including the specimen, into the compression chamber. Take care to align the femoral head with the spherical concavity on the polyethylene pressure socket. Ensure that the femoral head is engaged but slack within the spherical cavity of the pressure socket.
- Place the compressive stage on the rotation stage of the micro-CT scanner at Imaging and Medical Beamline (IMBL).
- Connect the load cell (error < 0.005%; maximum force: 10,000 N; maximum torque: 500 Nm) to the strain amplifier.
- Connect, via USB, the strain amplifier to a laptop computer equipped with the application software provided with the load cell.
- Actuate the screw mechanism in the compression stage by moving the specimen downward toward the pressure socket while monitoring the reaction force measured by the load cell in the laptop. Stop the screw mechanism once a compression force equal to 100 N is achieved. Unload the specimen to 50 N pre-load.
- Select the single pco.edge sensor lens-coupled scintillator "Ruby" (http://archive.synchrotron.org.au/31-australian-synchrotron/imbl/811-preparation-for-imaging-experiments).
- Set the field of view to 76.31 mm x 64.39 mm, which for the 2,560 pixels x 2,160 pixels array size provides a pixel size of 29.81 μm.
- Set the axis of the rotating stage to 8 mm (horizontally) from the axis of the field of view (off-set scanning mode) to extend the field of view to 145.71 mm x 64.39 mm at a pixel size of 29.81 μm.
- Set the scanning parameters to a beam energy of 60 keV, a rotational increment of 0.1°, two batches of 180° rotation (off-set scanning), an exposure time of 50 μs, and a frame-averaging of two per rotational position.
- Set the scan to acquire five consecutive, vertically stacked scans, with a 26 mm vertical shift each, so that the total height of the scanned volume is 132.2 mm for a total scanning time of 30 min.
5. Mechanical testing with concomitant microstructural imaging
- Perform micro-CT (pixel size: 0.03 mm) imaging twice in the reference condition (taken as a zero-strain condition).
- Apply the force increment by manually actuating the screw-jack mechanism at a constant rate of approximately 1 s per round (0.1-0.2 mm/s).
- Perform micro-CT imaging.
- Repeat step 5.2 and step 5.3 up to causing the fracture of the specimen, as indicated by a sudden drop in the reaction force.
- Perform micro-CT imaging of the fractured specimen.
- Stitch the 1,800 projection images (2,560 pixels x 896 pixels in size, 76.8 mm x 26.88 mm, width x height, 32-bit floating point images). The process stitches two projection images (taken in horizontal off-set scanning mode), and the five vertically shifted images, hence producing a single projection image.
- Reconstruct the volume of the cross-section images (4,407 images, each image 4,888 x 4,888 pixels in size), and save them as 32-bit, floating point files in .TIFF format (occupying 392 GB of disk space).
- Apply a 3 x 3 Gaussian filter to reduce noise. Convert the images into 8-bit (256 greylevel images, saved in bitmap format, occupying approximately 100 GB per volume).
NOTE: In this work, the processing of the images was conducted using software available at the Australian Synchrotron under the guidance of the operator of the IMBL.
6. Calculation of the displacement and strain field
- Subsample the cross-section images by four (120 μm/pixel) to reduce the computation time.
- Rigidly co-register in space the images of the specimen under load to those of the specimen in the unloaded reference condition. Use the distal diaphysis as the target of the co-registration (Supplementary File 1 and Supplementary File 2).
- Create surface three-dimensional models (.STL files) for visualization after binarizing the micro-CT images11.
- Elastically register the image volume to the reference volume using a grid size equal to 50 pixels (SDER = 0.076% strain error, BoneDVC, https://bonedvc.insigneo.org/dvc/) to determine the displacements at the nodes of the grid.
- Convert the grid into a finite-element model. Apply the nodal displacement calculated by BoneDVC to the model. Solve the model to determine the strain tensor over the entire bone volume.
- Repeat the analysis in the region showing the highest strain levels using the full-resolution images.
- Map the DVC strain maps to the full-resolution images using cubic interpolation with the interp3 function (Matlab)2.
- Visualize the displacements, strain, and microstructural images for large-volume visualization and animation (Matlab)2.
7. Analysis
- Display the permanent deformation of the bone (damage) by overlaying the images obtained in the unloaded conditions and after the fracture2.
- Display the progressive microstructural deformation of the bone by overlaying the three-dimensional models in unloaded conditions, at increasing load levels, and post-fracture2.
- Display the strain of the bone at the fracture location2.
- Analyze the deformation energy, stiffness, and displacement using descriptive statistics and regression methods2.
Results
The images display the entire proximal femur, the pressure socket, the dental cement, the aluminum cup, and the wrapping tissue. The bone micro-architecture can be seen progressively deforming as the load increases before fracture and after fracture (Figure 4).

Figure 4: The compressive stage con...
Discussion
The present protocol allows for studying the time-elapsed micromechanics of hip fractures in three dimensions ex vivo. A radiotransparent (aluminium) compressive stage capable of applying a progressive deformation to the proximal half of the human femur and measuring the reaction force has been custom-designed, manufactured, and tested. A large-volume micro-CT scanner is employed in this protocol to provide a temporal sequence of image volumes displaying the entire proximal femur with progressive loading at...
Disclosures
All the authors declare no conflicts of interest.
Acknowledgements
Funding from the Australian Research Council (FT180100338; IC190100020) is gratefully acknowledged.
Materials
| Name | Company | Catalog Number | Comments |
| Absorbent tissue | N/A | Maintain the bone moisture throughout the experiment | |
| Alignment rig | Custom-made | Rig for positioning the specimen in the potting cup | |
| Aluminium potting cup | Custom-made | Potting cup | |
| Bone saw | N/A | Cut the specimen to size | |
| Calibration phantom QCT Pro | Mindways Software, Inc., Austin, USA | CT Calibration 13002 | Calibrate grey levels in the images into equivalent bone mineral (ash) density levels |
| Clinical Computed-Tmography scanner | General Electric Medical Systems Co., Wisconsin, USA | Optima CT660 | Preliminary imaging for the prediction of the load step to fracture |
| Compressive stage | Custom-made | A 10 kg, radiotransparent compressive stage for applying and maintaining throught imaging a prescribed deformation to the specimen. | |
| Dental cement | Soesterberg, The Netherlands | Vertex RS | |
| Femur specimen | Science Care, Phoenix, USA | ||
| Finite-element analysis software | ANSYS Inc., Canonsburg, USA | ANSYS Mechanical APDL | Finite-element software package |
| Freezer | N/A | Store specimens at -20 °C | |
| Hard Drive | Dell | Disk space: 500 GB per volume | |
| Image bnarization and segmentation software | Skyscan-Bruker, Kontich, Belgium | CT analyzer | Image processing software |
| Image elastic segmentation | The University of Sheffield | Bone DVC | https://bonedvc.insigneo.org/dvc/ |
| Image processing and automation software | The MathWork Inc. | Matlab | Image processing software |
| Image registration software | Skyscan-Bruker, Kontich, Belgium | DataViewer | Image processing software |
| Image segmentation and FE modelling software | Simpleware, Exeter, UK | Scan IP | Bone egmentation software |
| Image stiching script | Australian syncrotron, Clayton, VIC, AU | The script is available at IMBL | |
| Image visualization | Kitware, Clifton Park, NY, USA | Paraview | Image visualization |
| Image visualization | Australian National University | Dristhi | Image visualization: doi:10.1117/12.935640 |
| Imaging and Medical beamline | Australian syncrotron, Clayton, VIC, AU | Large object micro-CT beamline at the Australian Synchrotron | |
| Laptop | Dell Inc., USA | ||
| Low-friction x-y table | THK Co., Tokyo, Japan | ||
| NI signal acquisition software | National Instruments, Austin, TX | NI-DAQmx | |
| Phosphate-buffered saline solution | Custom-made | Maintain the bone moisture throughout the experiment | |
| Plastic bag | N/A | Maintain the bone moisture throughout the experiment | |
| Rail | SKF Inc., Lansdale, PA, USA | ||
| Screw-jack mechanism | Benzlers, Örebro, Sweden | Serie BD (warm gear unit) | stroke: 150 mm, maximal load: 10,000 N, gear ratio: 27:1, a displacement per revolution: 0.148 mm |
| Single pco.edge sensor, lens coupled scintillator | Australian syncrotron, Clayton, VIC, AU | Detector Ruby FOV: 141 x 119 mm; 2560 x 2160 px; 55 µm/px; 50 fps | |
| Six axis load cell | ME-Meßsysteme GmbH, Hennigsdorf, GE | K6D6 | Maximal measurement error: 0.005%; maximal force: 10000 N; maximal torque: 500 Nm |
| Strain amplifier | ME-Meßsysteme GmbH, Hennigsdorf, GE | GSV-1A8USB K6D/M16 |
References
- Martelli, S., Perilli, E. Time-elapsed synchrotron-light microstructural imaging of femoral neck fracture. Journal of the Mechanical Behavior of Biomedical Materials. 84, 265-272 (2018).
- Martelli, S., Giorgi, M., Dall' Ara, E., Perilli, E. Damage tolerance and toughness of elderly human femora. Acta Biomaterialia. 123, 167-177 (2021).
- Perilli, E., et al. Dependence of mechanical compressive strength on local variations in microarchitecture in cancellous bone of proximal human femur. Journal of Biomechanics. 41 (2), 438-446 (2008).
- Thurner, P. J., et al. Time-lapsed investigation of three-dimensional failure and damage accumulation in trabecular bone using synchrotron light. Bone. 39 (2), 289-299 (2006).
- Jackman, T. M. Quantitative, 3D visualization of the initiation and progression of vertebral fractures under compression and anterior flexion. Journal of Bone and Mineral Research. 31 (4), 777-788 (2016).
- Mayhew, P. M., et al. Relation between age, femoral neck cortical stability, and hip fracture risk. Lancet. 366 (9480), 129-135 (2005).
- Nazarian, A., Stauber, M., Zurakowski, D., Snyder, B. D., Müller, R. The interaction of microstructure and volume fraction in predicting failure in cancellous bone. Bone. 39 (6), 1196-1202 (2006).
- Schileo, E., et al. To what extent can linear finite element models of human femora predict failure under stance and fall loading configurations. Journal of Biomechanics. 47 (14), 3531-3538 (2014).
- Schileo, E., et al. An accurate estimation of bone density improves the accuracy of subject-specific finite element models. Journal of Biomechanics. 41 (11), 2483-2491 (2008).
- Dall'ara, E., et al. A nonlinear QCT-based finite element model validation study for the human femur tested in two configurations in vitro. Bone. 52 (1), 27-38 (2013).
- Perilli, E., Parkinson, I. H., Reynolds, K. J. Micro-CT examination of human bone: from biopsies towards the entire organ. Annali dell'Istituto Superiore di Sanità. 48 (1), 75-82 (2012).
- Wearne, L. S., Rapagna, S., Taylor, M., Perilli, E. Micro-CT scan optimisation for mechanical loading of tibia with titanium tibial tray: A digital volume correlation zero strain error analysis. Journal of the Mechanical Behavior of Biomedical Materials. 134, 105336 (2022).
- Bennett, K. J., et al. Ex vivo assessment of surgically repaired tibial plateau fracture displacement under axial load using large-volume micro-CT. Journal of Biomechanics. 144, 111275 (2022).
- Falcinelli, C., et al. Multiple loading conditions analysis can improve the association between finite element bone strength estimates and proximal femur fractures: A preliminary study in elderly women. Bone. 67, 71-80 (2014).
- Orthopedic Image Segmentation. Synopsys Available from: https://www.synopsys.com/simpleware/news-and-events/ortho-medical-image-segmentation.html (2020)
Reprints and Permissions
Request permission to reuse the text or figures of this JoVE article
Request PermissionThis article has been published
Video Coming Soon
Copyright © 2025 MyJoVE Corporation. All rights reserved