
Aby wyświetlić tę treść, wymagana jest subskrypcja JoVE. Zaloguj się lub rozpocznij bezpłatny okres próbny.
Method Article
Measuring the Rate of Lipolysis in Ex Vivo Murine Adipose Tissue and Primary Preadipocytes Differentiated In Vitro
W tym Artykule
Podsumowanie
Triglyceride lipolysis in adipocytes is an important metabolic process resulting in the liberation of free fatty acids and glycerol. Here, we provide a detailed protocol to measure basal and stimulated lipolysis in adipocytes and ex vivo adipose tissue from mice.
Streszczenie
Adipocytes store energy in the form of triglycerides in lipid droplets. This energy can be mobilized via lipolysis, where the fatty acid side chains are sequentially cleaved from the glycerol backbone, resulting in the release of free fatty acids and glycerol. Due to the low expression of glycerol kinase in white adipocytes, glycerol re-uptake rates are negligible, while fatty acid re-uptake is dictated by the fatty acid binding capacity of media components such as albumin. Both glycerol and fatty acid release into media can be quantified by colorimetric assays to determine the lipolytic rate. By measuring these factors at multiple time points, one can determine the linear rate of lipolysis with high confidence. Here, we provide a detailed protocol for the measurement of lipolysis in in vitro differentiated adipocytes and ex vivo adipose tissue from mice. This protocol may also be optimized for other preadipocyte cell lines or adipose tissue from other organisms; considerations and optimization parameters are discussed. This protocol is designed to be useful in determining and comparing the rate of adipocyte lipolysis between mouse models and treatments.
Wprowadzenie
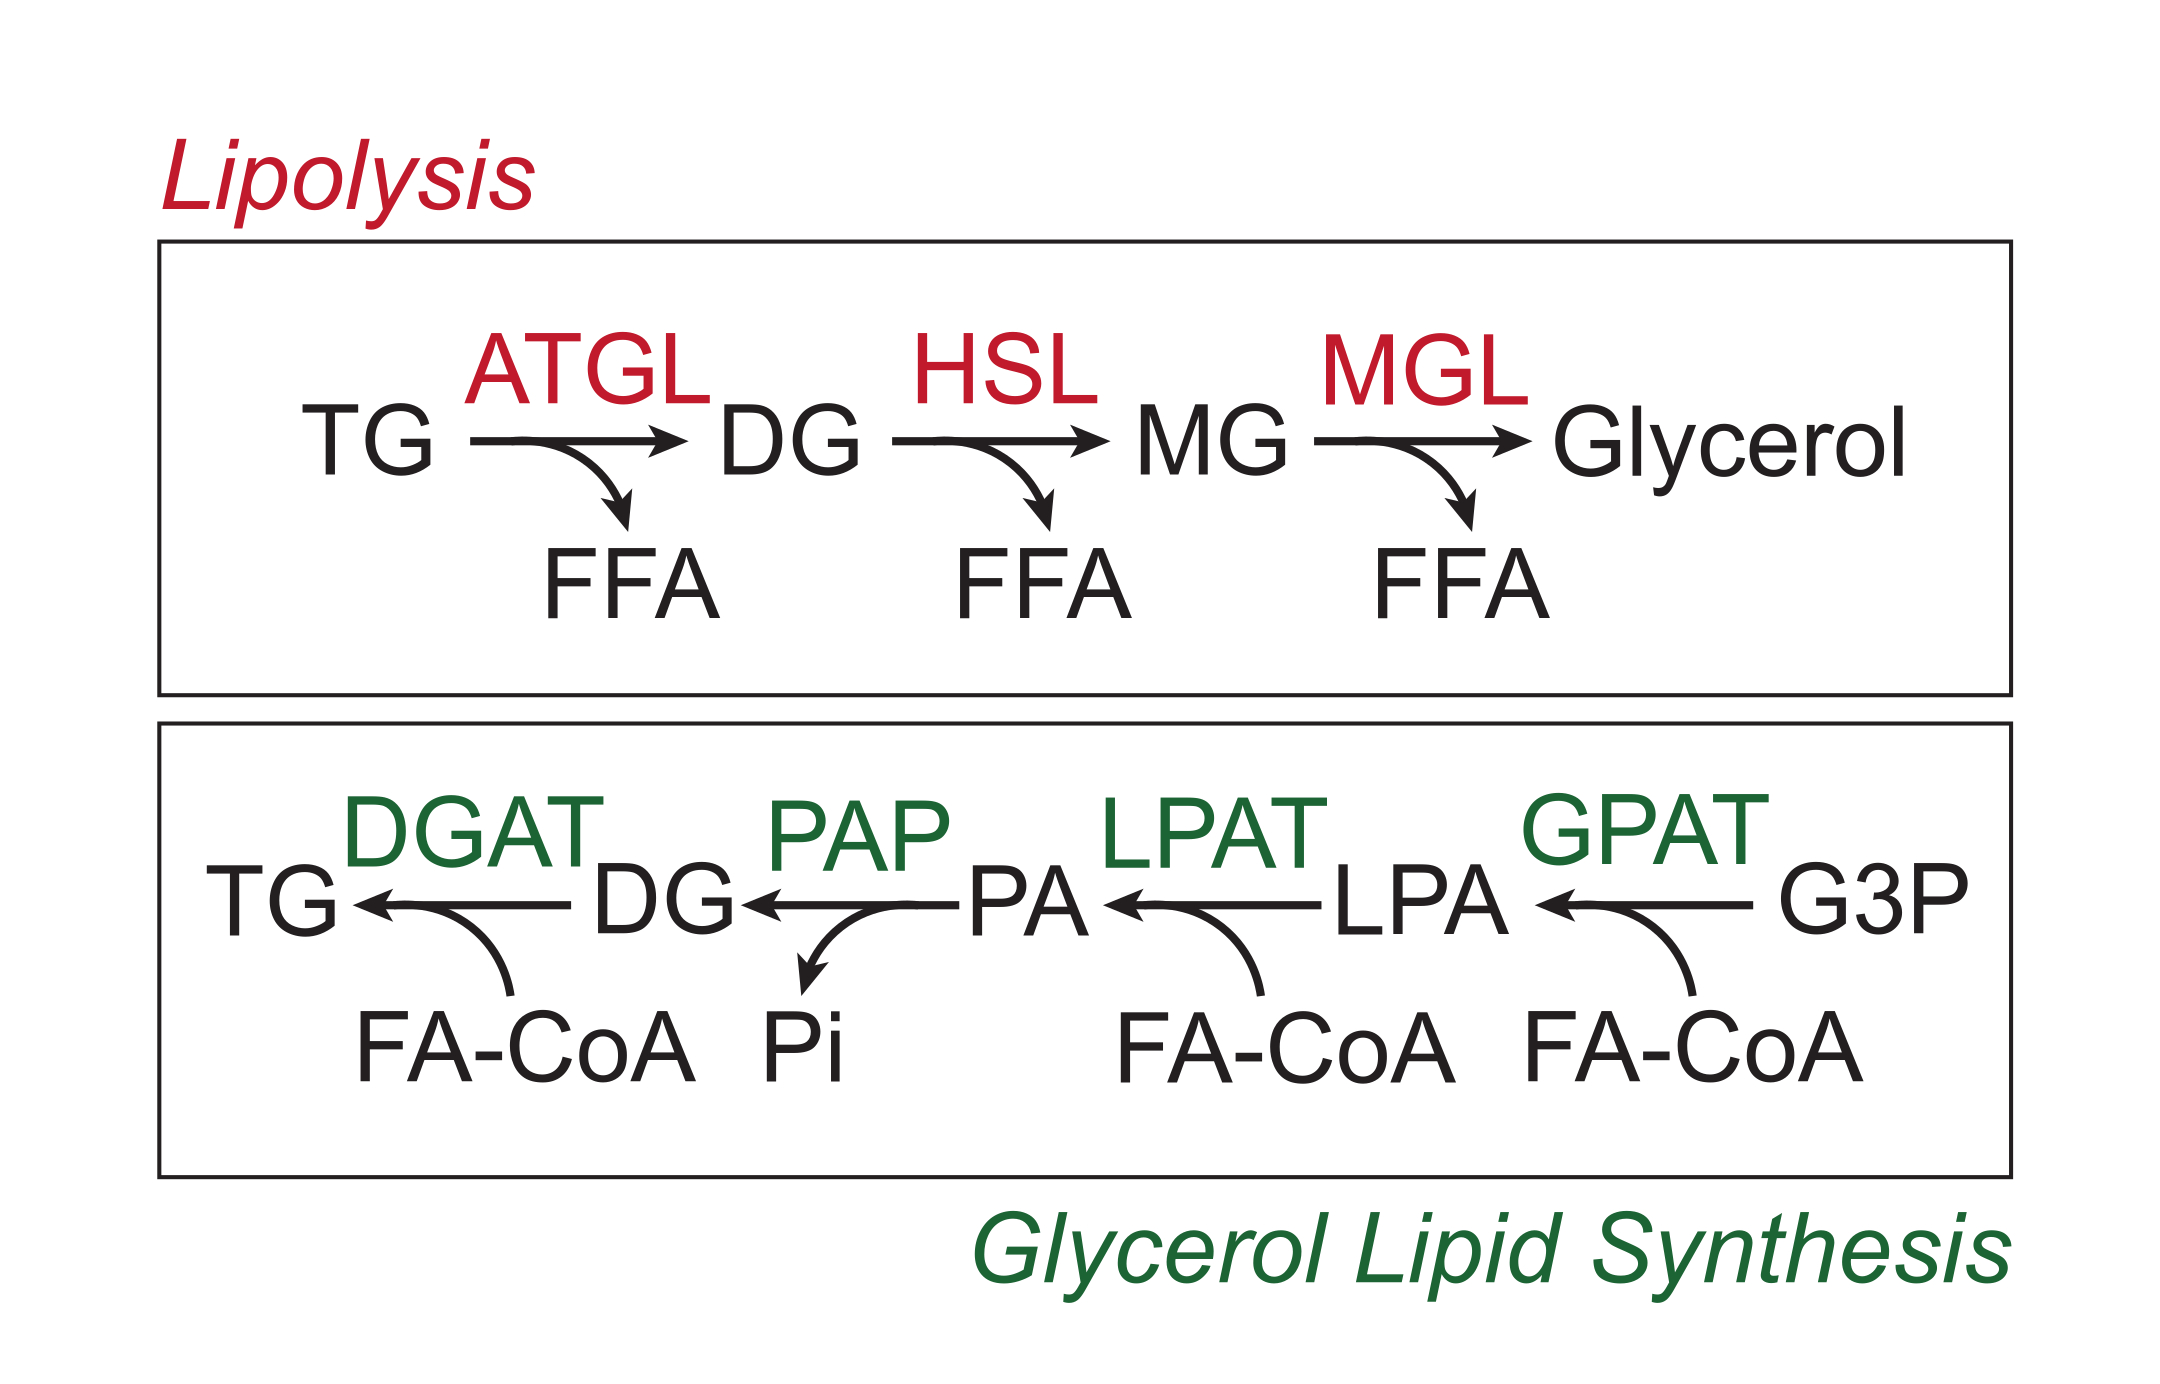
Excess nutrients are stored in white adipose tissue in the form of triglycerides in the neutral lipid core of lipid droplets. Triglyceride stores are mobilized via lipolysis, a process by which the fatty acid side chains are sequentially cleaved by adipose tissue triglyceride lipase (ATGL), hormone-sensitive lipase (HSL), and monoglyceride lipase (MGL), resulting in the release of free fatty acids (FFAs) and the glycerol backbone1,2. Lipolysis is activated by catecholamine signaling in the adipose tissue. Sympathetic nerve terminals locally release catecholamines, which bind to β-adrenergic receptors on the adipocyte plasma membrane. Upon ligand binding, these G-protein coupled receptors (GPCRs) activate adenylyl cyclase via Gαs. Subsequent activation of protein kinase A (PKA) by cAMP results in the upregulation of both ATGL and HSL. The phosphorylation of perilipin-1 by PKA causes the dissociation of ABHD5 (also known as CGI-58), which binds and coactivates ATGL3. PKA directly phosphorylates HSL, promoting its translocation from the cytosol to the lipid droplet, where interaction with phosphorylated perilipin-1 further promotes its lipase activity4,5,6,7. The third lipase involved in lipolysis, MGL, does not appear to be regulated by catecholamine signaling8. Importantly, triglyceride synthesis in adipocytes is mediated by the glycerol lipid synthesis pathway, which does not involve the formation of monoglycerides as an intermediate; instead, glycerol-3-phosphate acyl transferases catalyze the formation of lysophosphatidic acid, which is combined with another fatty acyl-CoA to form phosphatidic acid, and then isomerized to diglycerides before the final synthesis of triglycerides (Figure 1)9,10,11.

Figure 1: Lipolysis and glycerol lipid synthesis pathways. Top: Lipolytic pathway; enzymes shown in red: adipose tissue triglyceride lipase (ATGL), hormone sensitive lipase (HSL), and monoglyceride lipase (MGL). Bottom: glycerol lipid synthesis pathway; enzymes shown in green: diglyceride acyltransferase (DGAT), phosphatidic acid phosphatase (PAP), lysophosphatidic acid acyltransferase (LPAT, also known as LPAATs), and glycerol-3-phosphate acyltransferase (GPAT). Lipids: triglyceride (TG), diglyceride (DG), monoglyceride (MG), free fatty acid (FFA), fatty acyl-CoA (FA-CoA), lysophosphatidic acid (LPA), and phosphatidic acid (PA). Other metabolites: inorganic phosphate (Pi) and glycerol 3-phosphate (G3P). Please click here to view a larger version of this figure.
Extracellular adenosine is another important regulator of lipolysis, working through Gs- and Gi-coupled GPCRs to impact adenyl cyclase activity. The predominant adenosine receptor in adipocytes, ADORA1, inhibits adenylyl cyclase, and thus lipolysis through the activation of Gi12. Expressed at lower levels, and primarily in brown adipocytes, ADORA2A activates lipolysis via Gs signaling13. ADORA1 impacts both basal lipolysis and the response to adrenergic agonists. The effect of adenosine on lipolysis can be controlled by adding adenosine deaminase to neutralize adenosine, as well as the ADORA1-specific agonist phenylisopropyladenosine14,15. Hormonal activation of Gq-coupled GPCRs can also affect lipolysis via the activation of phospholipase C and protein kinase C16,17,18,19. Inflammatory signals also impact lipolytic rates. TLR4 activation by LPS (and other endotoxins) increases the lipolytic rate by activating ERK, which phosphorylates perilipin-1 and HSL20. TNF-α also activates lipolysis via ERK and NF-κB activation, as well as transcriptional downregulation of the phosphodiesterase PDE-3B and CIDEC21,22,23. IL-6 has also been associated with increased adipocyte lipolysis, especially in mesenteric adipose tissue, whose FFA release impacts hepatic steatosis and gluconeogenesis24,25,26.
Lipolysis is suppressed during the fed state by insulin. AKT phosphorylates and activates PDE-3B to suppress cAMP signaling and prevent PKA activation27. Insulin also transcriptionally downregulates ATGL28. Obesity promotes catecholamine resistance through a variety of mechanisms, including the downregulation of β-adrenergic receptors in adipocytes29,30,31,32,33. Adipocytes express all three β-adrenergic receptors (β-1, β-2, and β-3). While β-1 and β-2 adrenergic receptors are ubiquitously expressed, the β-3 adrenergic receptor is predominately expressed in adipocytes in mice34,35. Adrb3 expression is induced by C/EBPα during adipogenesis36. The β-3 adrenergic receptor is highly expressed in mature adipocytes. The activation of β-1 and β-2 adrenergic receptors is self-limiting due to feedback inhibition by β-arrestin37. Feedback inhibition of the β-3 adrenergic receptor is mediated by other signaling pathways, which reduce Adrb3 expression33,38,39.
Numerous compounds can be used to activate adipocyte lipolysis. Catecholamines are major physiological activators of lipolysis. Norepinephrine (or noradrenaline) and epinephrine (or adrenaline) activate all three β-adrenergic receptors40. Norepinephrine and epinephrine also effect lipolysis via activation of α-adrenergic receptor signaling41. Commonly used β-adrenergic receptor agonists include isoproterenol, which is a non-selective β-adrenergic receptor agonist, and the β-3 adrenergic receptor agonists CL-316,243 and mirabegron42. Given that adipocytes predominantly express the β-3 adrenergic receptor, we use CL-316,243 as an example here. Its specificity for the β-3 adrenergic receptor also makes it a relatively specific activator of adipocyte catecholamine signaling, that can also be safely used in vivo. Note that the commonly used concentration of 10 µM CL-316,243 in cell culture is orders of magnitude higher than the ~0.1 µM dose required to achieve a maximal response33. Forskolin bypasses the adrenergic receptor, directly activating adenylyl cyclase and downstream lipolytic signaling. There are many more activators, as well as suppressors of lipolysis. When selecting a compound to stimulate lipolysis, the receptor-specificity and downstream signaling pathways should be carefully considered within the experimental design.
The rate of lipolysis in white adipose tissue is an important metabolic factor impacting cold tolerance and nutrient availability during fasting or exercise43,44,45,46. The purpose of this protocol is to measure the rate of lipolysis in adipocytes and adipose tissue, which will facilitate the understanding of adipocyte metabolism and how it may impact the metabolic phenotype of various murine models. To quantify the lipolytic rate, we measure the appearance of lipolytic products in the media (i.e., FFAs and glycerol). The method relies on the release of lipolytic products from the adipocyte into the media. Since white adipocytes express low levels of glycerol kinase, glycerol reuptake rates are low47. Conversely, the production of FFAs and glycerol by metabolic pathways other than lipolysis should also be considered. Adipocytes appear to express a phosphatase with activity against glycerol-3 phosphate, enabling the production of glycerol from glycerol-3-phosphate derived from glucose48,49,50. Glycolysis is a source of glycerol-3-phosphate used for FFA re-esterification in white adipocytes. When glucose levels are limited, glyceroneogenesis requires other 3-carbon sources, such as lactate and pyruvate51. The channeling of FFAs released by lipolysis within the cell and their metabolic fate is poorly understood; FFAs released by lipolysis must be converted to fatty acyl-CoA, before being re-esterified or undergoing β-oxidation. It appears that FFAs released by lipolysis likely exit the cell before being taken back up and converted to fatty acyl-CoA52,53,54,55,56,57,58,59,60,61,62. FFAs can be sequestered outside of the cell by albumin. Importantly, long-chain FFAs are known to feedback-inhibit lipolysis if they are not sequestered by albumin63,64,65,66,67. Thus, optimizing the FFA buffering capacity of the media during the lipolysis assay is critical. The procedure described here is similar to previously published methods to measure the lipolytic rate in adipocytes and ex vivo adipose tissue from mice and humans15,68,69,70,71. This protocol differs through the use of serial sampling; by performing serial sampling, we can internally validate that lipolysis is being measured in the linear phase and utilize multiple measurements to calculate the rate of lipolysis, thereby reducing measurement error to increase confidence in the final calculated value. The drawback of serial sampling is that the assay requires more time and reagents; however, the longer timeframe reduces impact of measurement error on the standard error of the estimates of the rate. Additionally, this protocol measures both FFA and glycerol release, and considers the ratio of FFA:glycerol release with the goal of achieving a 3:1 ratio, as would be expected from complete lipolysis and release of lipolytic products into the media72.
Protokół
The use of all animals was approved by the Institutional Animal Care and Use Committee (IACUC) at Weill Cornell Medical College of Cornell University.
1. Preparation of buffers and collection plates
- Make 5% bovine serum albumin (BSA) by dissolving 5 g of BSA in 100 mL of Dulbecco's modified Eagle's medium (DMEM) without phenol red. Gently stir the BSA to dissolve (shaking is counterproductive). Once the BSA is fully dissolved, filter-sterilize the media with a 0.2 µm filter. Store the BSA media at 4 °C for up to 1 month.
- Make working concentrations of control and stimulation media. Control media: 5% BSA media with vehicle control. Stimulation media: 5% BSA media with 0.5 µM CL-316,243. Make fresh stimulation media for each experiment.
- Warm the media to be used to 37 °C. Label a 96-well plate for media collection.
2. Sample preparation
- Perform cell culture as described below. Undertake all cell work in a sterile fume hood to minimize outside contamination.
- Isolate and differentiate primary preadipocytes, as in73,74.
- Plate primary preadipocytes at a high density, such as 1 x 10⁵ cells/well in a 24-well plate in 1 mL/well culture media (15% fetal bovine serum (FBS) and 1x penicillin-streptomycin-glutamine in DMEM/F12).
- After the cells reach 100% confluency, differentiate with 5 µM dexamethasone, 0.5 mM 3-isobutyl-1-methylxanthine, 1 µg/mL insulin, and 1 µM thiazolidinedione (TZD) in culture media for 3 days. Then, change to culture media with 1 µg/mL insulin for at least 3 days to grow lipid droplets. Use 1 mL/well of media in the 24-well plate.
- Change the culture media (1 ml/well) with insulin every 2 or 3 days. The cells can be maintained in media with insulin for up to 2 weeks. Use only cultures in which differentiation rates are over 90% and are similar across groups for this assay, as reduced differentiation could be misinterpreted as a reduction in lipolytic rate.
- Culture the cells in insulin free media for 24 h prior to measuring lipolysis.
NOTE: Insulin in the media maintains lipid droplets, but also inhibits lipolysis. Incubation without insulin for 24 h allows for full lipolytic activation without a loss of lipid droplet volume. In some systems, the culture time without insulin may need to be shortened or extended.
- Wash the cells with DPBS once to remove residual serum from the culture media.
NOTE: This protocol does not include serum starvation, which can activate lipolysis. Serum starvation may be employed at the researcher's discretion.
- Isolate and differentiate primary preadipocytes, as in73,74.
- Perform ex vivo culture as described below.
- Prepare a 6-well plate, with one well for each tissue to be collected from each mouse. Place 4 mL of room temperature DMEM in each well to be used.
NOTE: BSA in the collection media is not necessary. - Prepare a 48-well plate for the lipolysis assay, with one well for each replicate. Place 400 µL of room temperature DMEM in each well to be used. Use two to four control and two to four stimulated wells per tissue per mouse.
- Euthanize the mouse by cervical dislocation under anesthesia, with a secondary method such as bilateral pneumothorax. Here, we used a 32 g, 7-month-old female C57BL/6J mouse, fed with a 45% high fat diet for 4 months.
NOTE: This protocol can also be used for males, as well as other strains, diets, and ages. - Spray with 70% ethanol and use scissors to make a small (~ 1 cm) lateral incision at the center of the abdominal skin, pull the skin apart by pinching either side with thumb and forefinger and fold the lower abdominal skin over to reveal the posterior subcutaneous depots. Locate and remove the inguinal lymph node and blunt dissect the inguinal adipose tissue immediately posterior to the inguinal lymph node using forceps.
- To collect the gonadal adipose tissue, make a lateral and a vertical incision in the peritoneum to access the peritoneal cavity. Hold the gonadal fat pad with tweezers and cut along the uterus (or epididymis for males) to remove the gonadal adipose tissue. Place the collected depots into a 6-well plate.
- Remove the tissue from well, place on a silicone mat, and cut into 5 to 7 mg chunks with scissors.
- Weigh out 25 to 30 mg (five or six chunks) for each assay well and place into a 48-well assay plate. Blot the tissue on a clean towel before weighing to remove any media. Weigh the weight boat after removal of the tissue and record the weight of any residue left behind. Wipe the weight boat clean between samples and re-tare if necessary. Use a new weight boat for each tissue.
- Once all the tissue samples have been weighed, place the 48-well assay plate in a 37 °C, 10% CO2 incubator for 15 min.
- Prepare a 6-well plate, with one well for each tissue to be collected from each mouse. Place 4 mL of room temperature DMEM in each well to be used.
3. Lipolysis assay
- Perform media collection. Undertake transfer of the media and subsequent sample collection in a sterile fume hood to minimize potential contamination from outside sources.
- At t = 0, remove the media and add 400 µL per well of control or stimulation media, and place assay the plate into a 37 °C, 10% CO2 incubator. For ex vivo tissue culture, carefully remove media using a pipette; suction should never be used.
NOTE: Alternatively, prepare a second plate with control and stimulation media, and transfer the tissues. - At t = 1, 2, 3 and 4 h, collect 200 µL of media, replace with 200 µL of the appropriate control or stimulation media, and return the assay plate to the incubator. Store the collection plate at 4 °C. To determine the FFA buffering capacity of the BSA media, use an additional collection at 24 h.
NOTE: The experiments can be stopped here, and the collected media can be stored at -20 °C.
- At t = 0, remove the media and add 400 µL per well of control or stimulation media, and place assay the plate into a 37 °C, 10% CO2 incubator. For ex vivo tissue culture, carefully remove media using a pipette; suction should never be used.
4. FFA colorimetric assay
- Warm the reagents to room temperature and dissolve one bottle of color reagent A with one bottle of solvent A, and one bottle of color reagent B with one bottle of solvent B. From the date of reconstitution, these reagents are best used within 1 week. Discard 1 month after reconstitution.
- Thaw and mix the samples.
- Create an FFA standard curve. The standard solution is 1 mM. Use the following volume with the reagents for the standard curve: 25 µL, 20 µL, 15 µL, 10 µL, 10 µL (1:2 dilution), 10 µL (1:4 dilution), 10 µL (1:8 dilution), and 10 µL water for maximal range. For low FFA levels, 10 µL of 1 mM, 0.8 mM, 0.6 mM, 0.4 mM, 0.2 mM, 0.1 mM, and 0.05 mM standard may be more applicable.
- Pipette standards and samples into a 96-well assay plate. The recommended sample volume is 10 µL. Include three wells with the same volume of BSA media as the samples for background correction.
NOTE: If sample concentrations fall outside the range of the standard curve, repeat the assay, adjusting the sample volume to 2-25 µL. - Add 150 µL of reagent A to each well and mix. Avoid generating bubbles. Pop any bubbles with a fine gauge needle. Incubate the assay plate at 37 °C for 5 min.
- Read the absorbance of the plate at 550 nm and 660 nm reference (Reading A).
- Add 75 µL of reagent B to each well and mix. Avoid generating bubbles. Pop any bubbles with a fine gauge needle. Incubate the assay plate at 37 °C for 5 min.
- Read the absorbance of the plate again at 550 nm and 660 nm reference (Reading B).
5. Glycerol colorimetric assay
- Reconstitute the free glycerol reagent with 36 mL of ultrapure water and acclimatize to room temperature. These reagents are best used within a few weeks. Discard 2 months after reconstitution.
- Thaw and mix the samples.
- Create a glycerol standard curve by making a seven point, 2-fold serial dilution of the glycerol standard solution and a water blank.
NOTE: The standard curve is relatively linear up to 25 µL of 2.8 mM glycerol, but not linear at higher concentrations. - Pipette 25 µL each of standard and samples into the 96-well assay plate. Include three wells with the BSA media for background correction.
- Add 175 µL of free glycerol reagent to each well and mix. Avoid generating bubbles. Pop any bubbles with a fine gauge needle. Incubate the assay plate at 37 °C for 5 min.
- Read the absorbance of the plate at 540 nm.
6. Calculation of lipolytic rate
- Start with optical density (OD) values. For glycerol, use A540 OD values directly. Calculate the OD of the FFA assay according to the following formula:
OD = (Reading B: A550 - A660) - (Reading A: A550 - A660) - Use the standard curve to calculate the FFA and glycerol levels in the collected samples. Plot the standard OD values on the y-axis, and on the x-axis, use standard concentrations relative to the sample volume (i.e., the concentration of the wells with 20 µL of 1 mM FFA standard on a plate with 10 µL samples is equal to 2 mM). Fit a linear trendline:
y = mx + b - Visually inspect the standard curve and remove any points outside the linear range of the assay. Calculate sample concentrations using the equation:
Sample concentration: x = (OD - b) ÷ m - Adjust and re-assay samples falling outside the linear assay range. To get the final sample concentration, subtract the concentration of the background wells containing only BSA media from the concentration of the samples.
- Calculate the moles of FFA and glycerol produced by each sample at each time point, according to the formula:

where Cn = concentration at time t = n; Vt = total volume in the well; Vs = sample collection volume; and Mn = moles produced at time t = n (when concentrations are in mM and volumes are in mL the output is µMol).
For examples, at various time points:
M1 = C1 × Vt
M4 = C4 × Vt + (C1 + C2+ C3)Vs
or
M4 = C4 × Vt + C3 × Vs + C2 × Vs + C1 ×Vs - Normalize to tissue weight by dividing by the tissue weight for each sample in grams to obtain units of µmol/g. For cultured cells, values are presented as µmol/well. Ensure that the cell number and differentiation efficiency are comparable from well to well.
NOTE: Differences in proliferation or differentiation efficiency will complicate the interpretation of results and require another method of normalization (e.g., normalization to protein; see discussion). - Calculate the slope of the µmol/g produced (y-axis) versus time (x-axis) for each sample individually.
- In a spreadsheet, this can be done using the =SLOPE(known_ys,known_xs) function. In a new cell, type "=SLOPE" (then use the cursor to highlight the sample glycerol or FFA values in µmol/g, then to highlight the corresponding time values).
- Verify the linearity of the data. R2 values are a quick way to determine linearity of the samples. In a spreadsheet, this can be done using the =RSQ(known_ys,known_xs) function, in the same manner as described in step 6.7.1, but the initial input is =RSQ. Ensure that the R2 values are > 0.98; lower values indicate deviation from linearity. This can result from a measurement/sampling error or loss of linearity.
- Another way to test linearity is to perform a linear regression for each sample and plot the residuals. In a statistical analysis software, generate an XY table with a single Y value for each time point. Select Analyze > Simple linear regression and select the box for Residual Plot before hitting OK. The residual plot will appear as a new graph.
- Use the FFA and glycerol production rate (i.e., slope [(µmol/g/h]) for each sample as an individual data point to perform statistical analysis, and plot values if different lipolytic conditions are being compared. If lipolytic rates are being compared across genotypes, use two or three samples per animal as technical replicates, and use the average for one data point per animal, so that the sample size is equal to the number of animals.
Wyniki
We measured the basal and stimulated lipolytic rate of in vitro differentiated adipocytes. Primary preadipocytes from inguinal white adipose tissue were differentiated into adipocytes by the treatment of confluent cells with 5 µM dexamethasone, 0.5 mM IBMX, 1 µg/mL insulin, and 1 µM troglitazone for 4 days, followed by an additional 3 day treatment with 1 µg/mL insulin. Cells were incubated in media without insulin for 24 h prior to the lipolysis assay. At time = 0h, the cells were washed onc...
Dyskusje
Here, we provide a basic protocol for measuring the rate of lipolysis in adipocytes and ex vivo adipose tissue. To quantify lipolysis, it is important to measure lipolytic rate in the linear phase. We use a serial sampling technique, where a large fraction of media is collected and replaced with fresh media at regular intervals. This semiconservative method allows for the addition of fresh BSA with FFA buffering capacity and delays feedback inhibition, extending the duration of linear lipolysis. This experimenta...
Ujawnienia
The authors have nothing to disclose.
Podziękowania
This work was supported by the US National Institutes of Health grant R01DK126944 to S.M.R.
Materiały
| Name | Company | Catalog Number | Comments |
| 24-Well tissue culture treated plate | Corning Inc | 3527 | Must be tissue culture treated for adipocyte differntiation |
| 48-Well flat bottom plate with lid | Corning Inc | 353078 | Can be tissue culture treated |
| 6-Well flat bottom plate with lid | Corning Inc | 353046 | Can be tissue culture treated |
| 96-Well PCR Plate | USA sceintific | 1402-9100 | Any conical 0.2 mL PCR plate will be convenient |
| Bovine Serum Albumin | Sigma Aldrich | A9418 | FFA free BSA such as A8806, is also commonly used. The BSA should not have detectable FFA, also lot to lot variations in BSA can impact the observed rate of lipolysis |
| CL-316,243 | Sigma Aldrich | C5976 | CAS #: 138908-40-4 availaible from other suppliers |
| CO2 incubator | PHCBI | MCO-170AICUVH | CO2 should ideally be set to 10% for adipose tissue, however 5% CO2 will also work |
| DMEM, low glucose, no phenol red | Thermofischer | 11054020 | Any phenol red free media should work, DMEM/F12, RPMI, but should contain volatile buffering capacity, i.e. biocarbonate |
| FFA-free Bovine serum albumin | Equitech-Bio, Inc, | BAH66 | |
| Free Glycerol Reagent | Sigma Aldrich | F6428 | |
| Glycerol Standard Solution | Sigma Aldrich | G7793 | This can also be made by diluting glycerol to the desired concentration |
| HR Series NEFA Standard Solution | Fujifilm | 276-76491 | |
| HR Series NEFA-HR (2) Color Reagent A | Fujifilm | 999-34691 | |
| HR Series NEFA-HR (2) Color Reagent B | Fujifilm | 991-34891 | |
| HR Series NEFA-HR (2) Solvent A | Fujifilm | 995-34791 | |
| HR Series NEFA-HR (2) Solvent B | Fujifilm | 993-35191 | |
| Microbiological Incubator | Fischer Scientific | S28668 | Any incubator at 37C can be used |
| Nunc MicroWell 96-Well Plates | Thermo Scientific | 269620 | Any optically clear, flat bottom 96-well plate works |
| Silicone Laboratory Benchtop Mat | VWR | 76045-300 | Glass plate can also be used. Absorbant surfaces are not recommended |
| Spectrophotometer/Microplate Reader | Molecular devices | SpectraMax i3x | Any plate reader that can read at 540, 550 and 660 mm will work |
| V Bovine serum albumin | Sigma-Aldrich | 810531 | |
| WypAll X70 Wipers | Kimberly-Clark | 41200 | Any high quality paper towel will work |
Odniesienia
- Vaughan, M., Berger, J. E., Steinberg, D. Hormone-sensitive lipase and monoglyceride lipase activities in adipose tissue. The Journal of Biological Chemistry. 239, 401-409 (1964).
- Zimmermann, R., et al. Fat mobilization in adipose tissue is promoted by adipose triglyceride lipase. Science. 306 (5700), 1383-1386 (2004).
- Lass, A., et al. Adipose triglyceride lipase-mediated lipolysis of cellular fat stores is activated by CGI-58 and defective in Chanarin-Dorfman syndrome. Cell Metabolism. 3 (5), 309-319 (2006).
- Stralfors, P., Bjorgell, P., Belfrage, P. Hormonal regulation of hormone-sensitive lipase in intact adipocytes: identification of phosphorylated sites and effects on the phosphorylation by lipolytic hormones and insulin. Proceedings of the National Academy of Sciences. 81 (11), 3317-3321 (1984).
- Miyoshi, H., et al. Perilipin promotes hormone-sensitive lipase-mediated adipocyte lipolysis via phosphorylation-dependent and -independent mechanisms. The Journal of Biological Chemistry. 281 (23), 15837-15844 (2006).
- Sztalryd, C., et al. Perilipin A is essential for the translocation of hormone-sensitive lipase during lipolytic activation. The Journal of Cell Biology. 161 (6), 1093-1103 (2003).
- Lafontan, M., Langin, D. Lipolysis and lipid mobilization in human adipose tissue. Progress in Lipid Research. 48 (5), 275-297 (2009).
- Grabner, G. F., Xie, H., Schweiger, M., Zechner, R. Lipolysis: cellular mechanisms for lipid mobilization from fat stores. Nature Metabolism. 3 (11), 1445-1465 (2021).
- Weiss, S. B., Kennedy, E. P., Kiyasu, J. Y. The enzymatic synthesis of triglycerides. The Journal of Biological Chemistry. 235, 40-44 (1960).
- Kennedy, E. P. Biosynthesis of complex lipids. Federation Proceedings. 20, 934-940 (1961).
- Wendel, A. A., Lewin, T. M., Coleman, R. A. Glycerol-3-phosphate acyltransferases: rate limiting enzymes of triacylglycerol biosynthesis. Biochimica et Biophysica Acta. 1791 (6), 501-506 (2009).
- Johansson, S. M., Lindgren, E., Yang, J. N., Herling, A. W., Fredholm, B. B. Adenosine A1 receptors regulate lipolysis and lipogenesis in mouse adipose tissue-interactions with insulin. European Journal of Pharmacology. 597 (1-3), 92-101 (2008).
- Gnad, T., et al. Adenosine activates brown adipose tissue and recruits beige adipocytes via A2A receptors. Nature. 516 (7531), 395-399 (2014).
- Fried, S. K., et al. Resistance to the antilipolytic effect of insulin in adipocytes of African-American compared to Caucasian postmenopausal women. Journal of Lipid Research. 51 (5), 1193-1200 (2010).
- Lee, M. J., Fried, S. K. Optimal protocol for the differentiation and metabolic analysis of human adipose stromal cells. Methods in Enzymology. 538, 49-65 (2014).
- Fricke, K., Heitland, A., Maronde, E. Cooperative activation of lipolysis by protein kinase A and protein kinase C pathways in 3T3-L1 adipocytes. Endocrinology. 145 (11), 4940-4947 (2004).
- Bergan, H. E., Kittilson, J. D., Sheridan, M. A. PKC and ERK mediate GH-stimulated lipolysis. Journal of Molecular Endocrinology. 51 (2), 213-224 (2013).
- Schmitz-Peiffer, C. The tail wagging the dog--regulation of lipid metabolism by protein kinase C. The FEBS Journal. 280 (21), 5371-5383 (2013).
- Carmen, G. Y., Victor, S. M. Signalling mechanisms regulating lipolysis. Cellular Signalling. 18 (4), 401-408 (2006).
- Zu, L., et al. Bacterial endotoxin stimulates adipose lipolysis via toll-like receptor 4 and extracellular signal-regulated kinase pathway. The Journal of Biological Chemistry. 284 (9), 5915-5926 (2009).
- Zhang, H. H., Halbleib, M., Ahmad, F., Manganiello, V. C., Greenberg, A. S. Tumor necrosis factor-alpha stimulates lipolysis in differentiated human adipocytes through activation of extracellular signal-related kinase and elevation of intracellular cAMP. Diabetes. 51 (10), 2929-2935 (2002).
- Tan, X., et al. TNF-α downregulates CIDEC via MEK/ERK pathway in human adipocytes. Obesity. 24 (5), 1070-1080 (2016).
- Laurencikiene, J., et al. NF-kappaB is important for TNF-alpha-induced lipolysis in human adipocytes. Journal of Lipid Research. 48 (5), 1069-1077 (2007).
- van Hall, G., et al. Interleukin-6 stimulates lipolysis and fat oxidation in humans. The Journal of Clinical Endocrinology and Metabolism. 88 (7), 3005-3010 (2003).
- Wueest, S., et al. Mesenteric fat lipolysis mediates obesity-associated hepatic steatosis and insulin resistance. Diabetes. 65 (1), 140-148 (2016).
- Trujillo, M. E., et al. Interleukin-6 regulates human adipose tissue lipid metabolism and leptin production in vitro. The Journal of Clinical Endocrinology and Metabolism. 89 (11), 5577-5582 (2004).
- Kitamura, T., et al. Insulin-induced phosphorylation and activation of cyclic nucleotide phosphodiesterase 3B by the serine-threonine kinase Akt. Molecular and Cellular Biology. 19 (9), 6286-6296 (1999).
- Chakrabarti, P., et al. Insulin inhibits lipolysis in adipocytes via the evolutionarily conserved mTORC1-Egr1-ATGL-mediated pathway. Molecular and Cellular Biology. 33 (18), 3659-3666 (2013).
- Collins, S., Daniel, K. W., Petro, A. E., Surwit, R. S. Strain-specific response to beta 3-adrenergic receptor agonist treatment of diet-induced obesity in mice. Endocrinology. 138 (1), 405-413 (1997).
- Surwit, R. S., Dixon, T. M., Petro, A. E., Daniel, K. W., Collins, S. Diazoxide restores beta3-adrenergic receptor function in diet-induced obesity and diabetes. Endocrinology. 141 (10), 3630-3637 (2000).
- Gettys, T. W., et al. Age-dependent changes in beta-adrenergic receptor subtypes and adenylyl cyclase activation in adipocytes from Fischer 344 rats. Endocrinology. 136 (5), 2022-2032 (1995).
- Mowers, J., et al. Inflammation produces catecholamine resistance in obesity via activation of PDE3B by the protein kinases IKKε and TBK1. eLife. 2, e01119 (2013).
- Valentine, J. M., et al. β3-Adrenergic receptor downregulation leads to adipocyte catecholamine resistance in obesity. The Journal of Clinical Investigation. 132 (2), e153357 (2022).
- Collins, S., et al. Impaired expression and functional activity of the beta 3- and beta 1-adrenergic receptors in adipose tissue of congenitally obese (C57BL/6J ob/ob) mice. Molecular Endocrinology. 8 (4), 518-527 (1994).
- Collins, S., Surwit, R. S. The beta-adrenergic receptors and the control of adipose tissue metabolism and thermogenesis. Recent Progress in Hormone Research. 56, 309-328 (2001).
- Dixon, T. M., Daniel, K. W., Farmer, S. R., Collins, S. CCAAT/enhancer-binding protein alpha is required for transcription of the beta 3-adrenergic receptor gene during adipogenesis. The Journal of Biological Chemistry. 276 (1), 722-728 (2001).
- Lohse, M. J., Benovic, J. L., Codina, J., Caron, M. G., Lefkowitz, R. J. beta-Arrestin: a protein that regulates beta-adrenergic receptor function. Science. 248 (4962), 1547-1550 (1990).
- Nantel, F., et al. The human beta 3-adrenergic receptor is resistant to short term agonist-promoted desensitization. Molecular Pharmacology. 43 (4), 548-555 (1993).
- Liggett, S. B., Freedman, N. J., Schwinn, D. A., Lefkowitz, R. J. Structural basis for receptor subtype-specific regulation revealed by a chimeric beta 3/beta 2-adrenergic receptor. Proceedings of the National Academy of Sciences. 90 (8), 3665-3669 (1993).
- Baker, J. G. The selectivity of beta-adrenoceptor agonists at human beta1-, beta2- and beta3-adrenoceptors. British Journal of Pharmacology. 160 (5), 1048-1061 (2010).
- Lafontan, M. Inhibition of epinephrine-induced lipolysis in isolated white adipocytes of aging rabbits by increased alpha-adrenergic responsiveness. Journal of Lipid Research. 20 (2), 208-216 (1979).
- Baker, J. G. The selectivity of beta-adrenoceptor antagonists at the human beta1, beta2 and beta3 adrenoceptors. British Journal of Pharmacology. 144 (3), 317-322 (2005).
- Jensen, M. D., Nielsen, S. Insulin dose response analysis of free fatty acid kinetics. Metabolism. 56 (1), 68-76 (2007).
- Jensen, M. D., Haymond, M. W., Gerich, J. E., Cryer, P. E., Miles, J. M. Lipolysis during fasting. Decreased suppression by insulin and increased stimulation by epinephrine. The Journal of Clinical Investigation. 79 (1), 207-213 (1987).
- Heckmann, B. L., et al. Defective adipose lipolysis and altered global energy metabolism in mice with adipose overexpression of the lipolytic inhibitor G0/G1 switch gene 2 (G0S2). The Journal of Biological Chemistry. 289 (4), 1905-1916 (2014).
- Shin, H., et al. Lipolysis in brown adipocytes is not essential for cold-induced thermogenesis in mice. Cell Metabolism. 26 (5), 764.e5-777.e5 (2017).
- Treble, D. H., Mayer, J. Glycerolkinase activity in white adipose tissue of obese-hyperglycaemic mice. Nature. 200, 363-364 (1963).
- Possik, E., et al. New mammalian glycerol-3-phosphate phosphatase: role in beta-cell, liver and adipocyte metabolism. Frontiers in Endocrinology. 12, 706607 (2021).
- Romero Mdel, M., Sabater, D., Fernandez-Lopez, J. A., Remesar, X., Alemany, M. Glycerol production from glucose and fructose by 3T3-L1 cells: a mechanism of adipocyte defense from excess substrate. PLoS One. 10 (10), e0139502 (2015).
- Mugabo, Y., et al. Identification of a mammalian glycerol-3-phosphate phosphatase: Role in metabolism and signaling in pancreatic beta-cells and hepatocytes. Proceedings of the National Academy of Sciences. 113 (4), E430-E439 (2016).
- Hanson, R. W., Reshef, L. Glyceroneogenesis revisited. Biochimie. 85 (12), 1199-1205 (2003).
- Vaughan, M. The production and release of glycerol by adipose tissue incubated in vitro. The Journal of Biological Chemistry. 237, 3354-3358 (1962).
- Jensen, M. D., Ekberg, K., Landau, B. R. Lipid metabolism during fasting. American Journal of Physiology-Endocrinology and Metabolism. 281 (4), E789-E793 (2001).
- Ballard, F. J., Hanson, R. W., Leveille, G. A. Phosphoenolpyruvate carboxykinase and the synthesis of glyceride-glycerol from pyruvate in adipose tissue. The Journal of Biological Chemistry. 242 (11), 2746-2750 (1967).
- Reshef, L., Hanson, R. W., Ballard, F. J. A possible physiological role for glyceroneogenesis in rat adipose tissue. The Journal of Biological Chemistry. 245 (22), 5979-5984 (1970).
- Gorin, E., Tal-Or, Z., Shafrir, E. Glyceroneogenesis in adipose tissue of fasted, diabetic and triamcinolone treated rats. European Journal of Biochemistry. 8 (3), 370-375 (1969).
- Elia, M., Zed, C., Neale, G., Livesey, G. The energy cost of triglyceride-fatty acid recycling in nonobese subjects after an overnight fast and four days of starvation. Metabolism. 36 (3), 251-255 (1987).
- Reshef, L., et al. Glyceroneogenesis and the triglyceride/fatty acid cycle. Journal of Biological Chemistry. 278 (33), 30413-30416 (2003).
- Edens, N. K., Leibel, R. L., Hirsch, J. Mechanism of free fatty acid re-esterification in human adipocytes in vitro. Journal of Lipid Research. 31 (8), 1423-1431 (1990).
- Vaughan, M., Steinberg, D. Effect of hormones on lipolysis and esterification of free fatty acids during incubation of adipose tissue in vitro. Journal of Lipid Research. 4, 193-199 (1963).
- Brooks, B., Arch, J. R., Newsholme, E. A. Effects of hormones on the rate of the triacylglycerol/fatty acid substrate cycle in adipocytes and epididymal fat pads. Federation of European Biochemical Societies Letters. 146 (2), 327-330 (1982).
- Bjorntorp, P., Karlsson, M., Hovden, A. Quantitative aspects of lipolysis and reesterification in human adipose tissue in vitro. Acta Medica Scandinavica. 185 (1-2), 89-97 (1969).
- Angel, A., Desai, K., Halperin, M. L. Free fatty acid and ATP levels in adipocytes during lipolysis. Metabolism. 20 (1), 87-99 (1971).
- Husted, A. S., et al. Autocrine negative feedback regulation of lipolysis through sensing of NEFAs by FFAR4/GPR120 in WAT. Molecular Metabolism. 42, 101103 (2020).
- Fain, J. N., Shepherd, R. E. Free fatty acids as feedback regulators of adenylate cyclase and cyclic 3':5'-AMP accumulation in rat fat cells. The Journal of Biological Chemistry. 250 (16), 6586-6592 (1975).
- Burns, T. W., Langley, P. E., Terry, B. E., Robinson, G. A. The role of free fatty acids in the regulation of lipolysis by human adipose tissue cells. Metabolism. 27 (12), 1755-1762 (1978).
- Kalderon, B., et al. Suppression of adipose lipolysis by long-chain fatty acid analogs. Journal of Lipid Research. 53 (5), 868-878 (2012).
- Schweiger, M., et al. Measurement of lipolysis. Methods in Enzymology. 538, 171-193 (2014).
- Decaunes, P., Bouloumie, A., Ryden, M., Galitzky, J. Ex vivo analysis of lipolysis in human subcutaneous adipose tissue explants. Bio-Protocol. 8 (3), e2711 (2018).
- Roy, D., Myers, J. M., Tedeschi, A. Protocol for assessing ex vivo lipolysis of murine adipose tissue. STAR Protocols. 3 (3), 101518 (2022).
- Baskaran, P., Thyagarajan, B. Measurement of basal and forskolin-stimulated lipolysis in inguinal adipose fat pads. Journal of Visualized Experiments. 125 (125), 55625 (2017).
- Reilly, S. M., et al. Catecholamines suppress fatty acid re-esterification and increase oxidation in white adipocytes via STAT3. Nature Metabolism. 2 (7), 620-634 (2020).
- Liu, L., et al. Isolation of mouse stromal vascular cells for monolayer culture. Methods in Molecular Biology. 1566, 9-16 (2017).
- DeLuca, J. H., Reilly, S. M. . Methods in Molecular Biology. , (2023).
- Richard, G., Vernon, R. A. C. New Perspectives in Adipose Tissue. Butterworth-Heinemann. , (1985).
- Brito, M. N., Botion, L. M., Brito, N. A., Kettelhut, I. C., Migliorini, R. H. Lipolysis and glycerokinase activity in brown adipose tissue of rat fed a high protein, carbohydrate-free diet. Hormone and Metabolic Research. 26 (1), 51-52 (1994).
- Bertin, R. Glycerokinase activity and lipolysis regulation in brown adipose tissue of cold acclimated rats. Biochimie. 58 (4), 431-434 (1976).
Przedruki i uprawnienia
Zapytaj o uprawnienia na użycie tekstu lub obrazów z tego artykułu JoVE
Zapytaj o uprawnieniaPrzeglądaj więcej artyków
This article has been published
Video Coming Soon
Copyright © 2025 MyJoVE Corporation. Wszelkie prawa zastrzeżone